Assignment 4-RADIOSS Material Laws Challenge
OBJECTIVE:
Compare the simulation results of different material formulations and to study the comparative results along with choosing a case which might represent an on-field scenario.
PROCEDURE:
Case 1:
Initially the given RAD file is imported to Hypermesh.
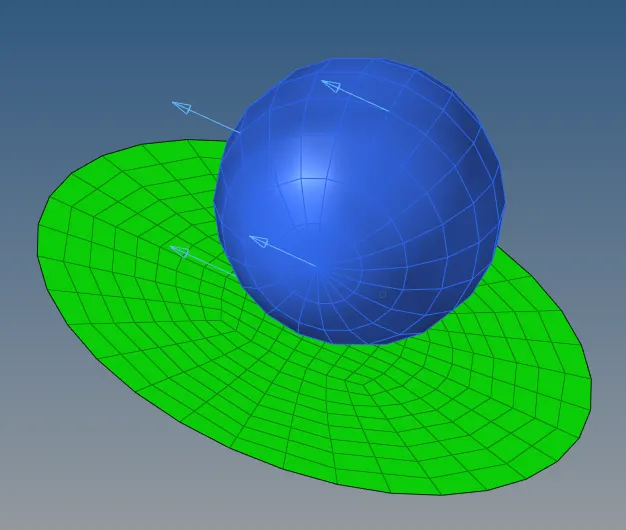
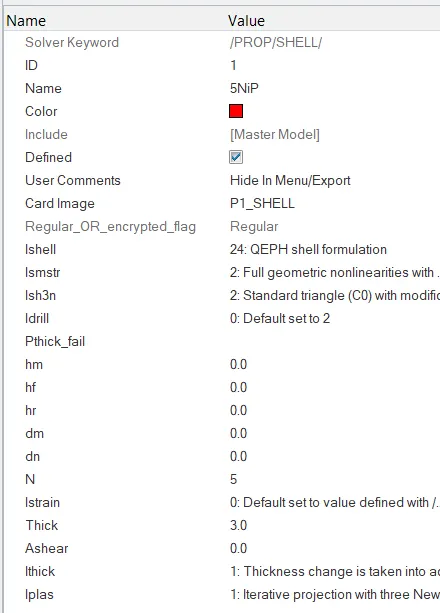
Keeping the property values at the best recommended values:
Carrying out simulation with properties given and without altering failure card, the OUT file containing energy error and mass error simulation results are viewed to check for model stability:
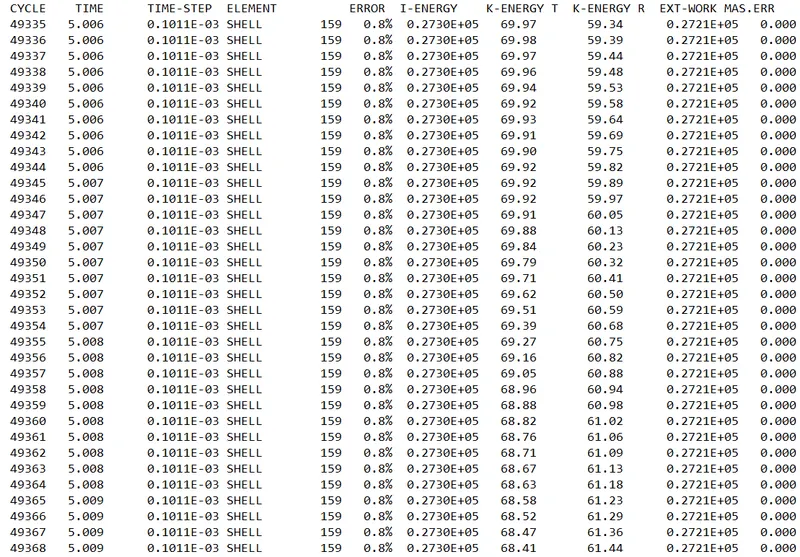
From the OUT file,
- energy error = -0.6% to 1.3%
- mass error = 0.00
Since the energy and mass error are within the acceptable range, the model is stable.
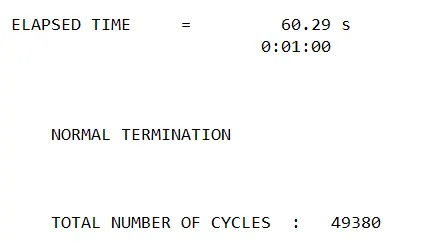
Now the time for simulation and number of cycles taken to complete the simulation is also noted from the OUT file.
Plotting the energy curves using Hypergraph 2-D with the help of T01 File:
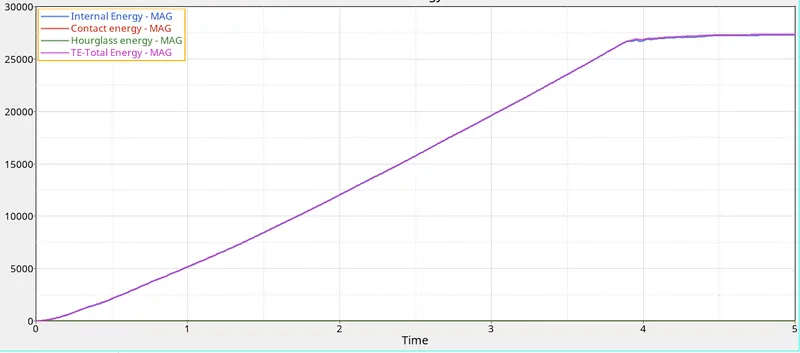
- Internal Energy, and total energy of the system increases with time since there is a force acting on the elements throughout the simulation.
- The hourglass energy and contact energy are zero till end of the simulation.
Animation and Contour plot of the simulation is obtained under Hyperview using the h3d file saved in the directory:
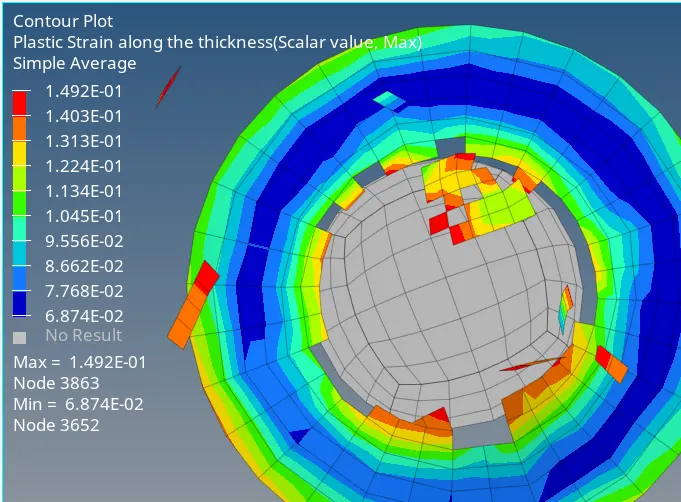
- maximum plastic strain along thickness reaches a value of 14.92.
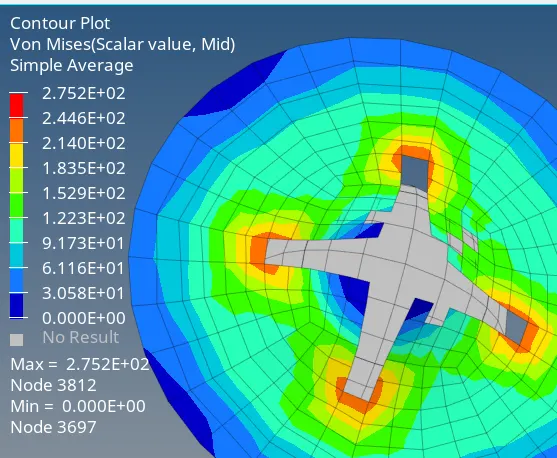
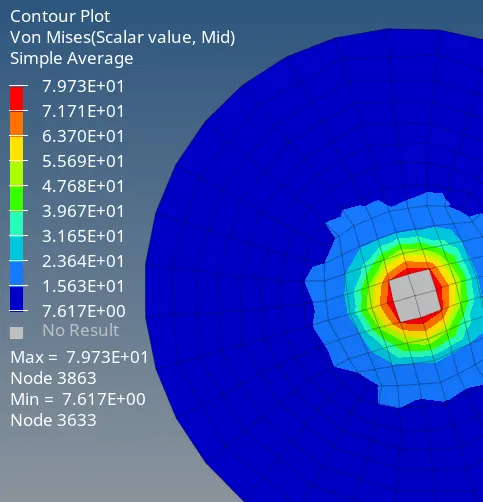
- At end of the simulation, it is clear from the contour plot that most of the elements considered under John-Cook failure model have got deleted.
- The maximum stress developed is 275MPa.
- Elements start to delete when stress values reaches upto 79.7MPa at time of 0.5 ms.
Case 2:
Initially the given RAD file is imported to Hypermesh.
Keeping the property values at the best recommended values:
Altering failure card formulations as per recommendation.
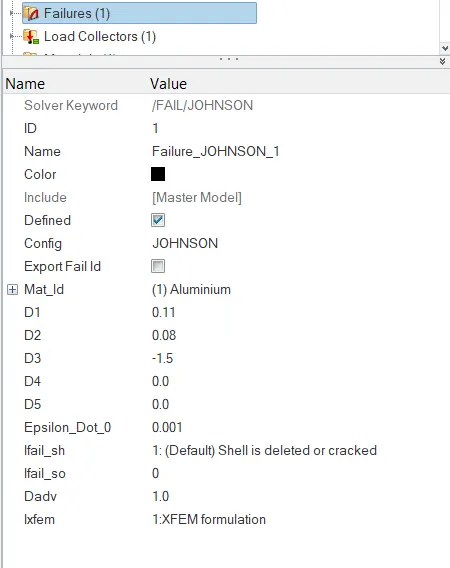
- Ifail_sh is changed to 1 which will now allow decision to be made when a shell element is deleted or cracked at each integration points.
- when Ixfem = 1, element is cracked
- Dadv=1 is default criterion for the crack advancement.
- Carrying out simulation with properties given and failure card as per recommendation, the OUT file containing energy error and mass error simulation results are viewed to check for model stability:
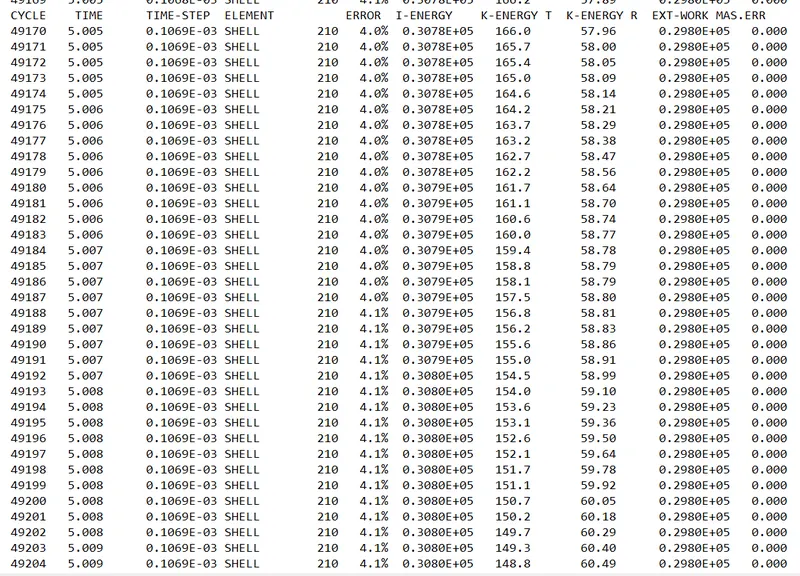
From the OUT file,
- energy error = -1.1% to 4.1%
- mass error = 0.00
Since the energy and mass error are within the acceptable range, the model is stable.
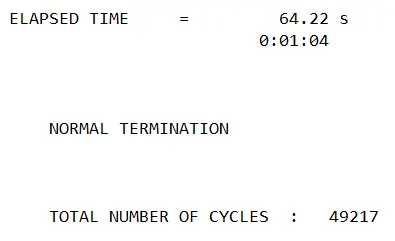
Now the time for simulation and number of cycles taken to complete the simulation is also noted from the OUT file.
Plotting the energy curves using Hypergraph 2-D with the help of T01 File:
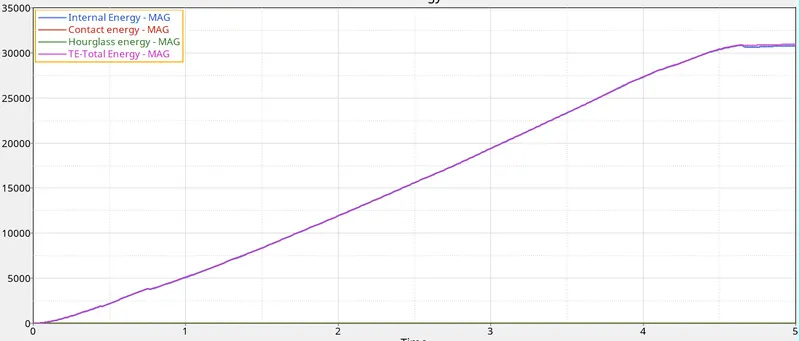
- Internal Energy, and total energy of the system increases with time since there is a force acting on the elements throughout the simulation.
- Internal energy and total energy at end of the simulation have increased from 27100 to 30600 due to modifications in the failure card.
- There is zero hourglass energy and contact energy developed till end of the simulation. The hourglass energy and contact energy characteristics are similar with the case before altering the failure card formulations.
Animation and Contour plot of the simulation is obtained under Hyperview using the h3d file saved in the directory:
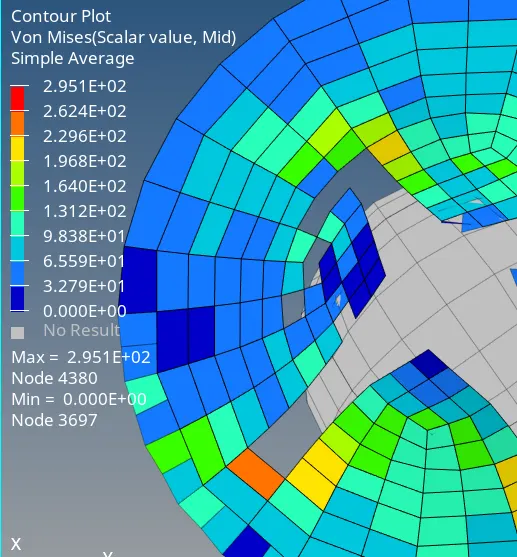
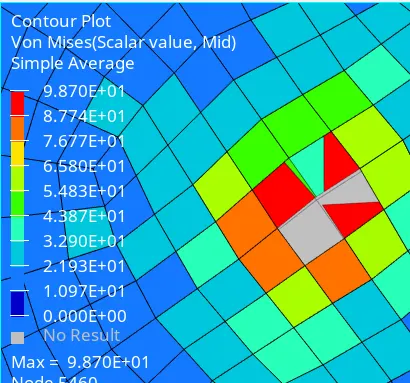
- At end of the simulation, it is clear from the contour plot that most of the elements considered under John-Cook failure model have got deleted.
- Rather than elements getting deleted from the start, some of the elements start to crack when stress values reaches upto 98MPa from time of 0.5 ms.
- The maximum von mises stress developed is 295MPa.
Case 3:
Initially the given RAD file is imported to Hypermesh.
Keeping the property values at the best recommended values:
Deleting the failure card to model no failure model:
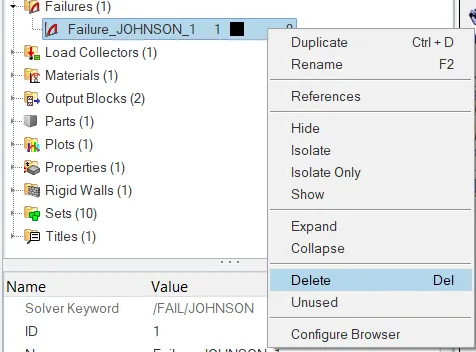
- Carrying out simulation with properties given and no failure card as per recommendation, the OUT file containing energy error and mass error simulation results are viewed to check for model stability:
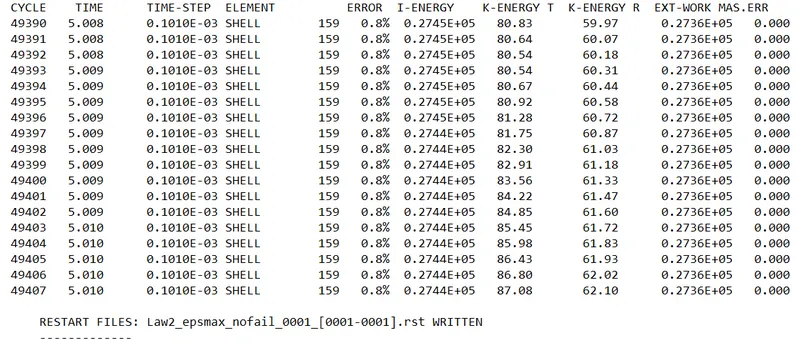
From the OUT file,
- energy error = -0.3% to 1.3%
- mass error = 0.00
Since the energy and mass error are within the acceptable range, the model is stable.
Now the time for simulation and number of cycles taken to complete the simulation is also noted from the OUT file.
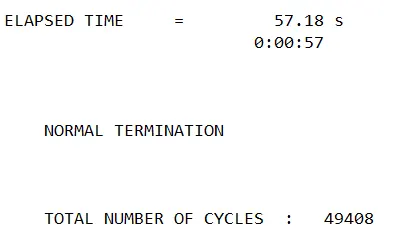
Plotting the energy curves using Hypergraph 2-D with the help of T01 File:
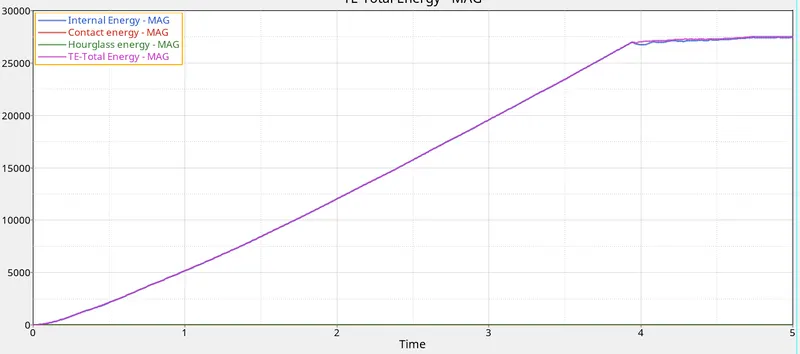
- Similar to the default and modified failure case, in no failure case also energy curves follow the same characteristics.
- Total energy and internal energy curves reach a final value of about 21000 towards the end of the simulation.
- However hourglass energy and contact energy remains zero in this case too.
Animation and Contour plot of the simulation is obtained under Hyperview using the h3d file saved in the directory:
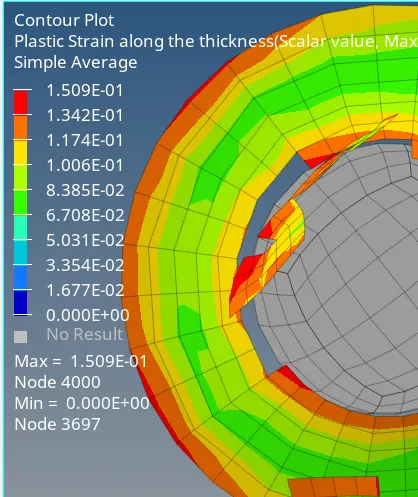
- maximum plastic strain along thickness reaches a value of 15.09.
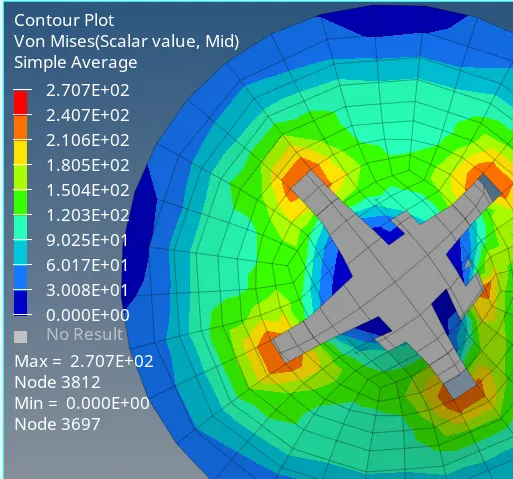
- At end of the simulation, it is clear from the contour plot that most of the elements considered under John-Cook failure model have got deleted.
- The maximum stress developed is 270.7MPa.
- elements start to delete when stress values reaches upto 79.5MPa at time of 0.5 ms.
Case 4:
Initially the given RAD file is imported to Hypermesh.
Changing value of EPS_p_max to 0 and keeping all other formulations similar to case 3:
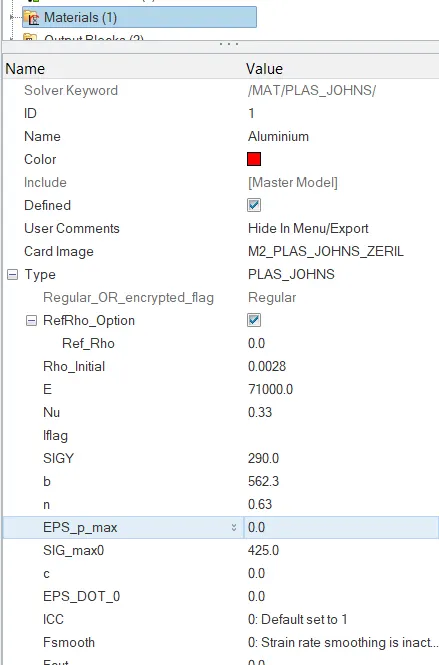
- Carrying out simulation with properties as per recommendation, the OUT file containing energy error and mass error simulation results are viewed to check for model stability:
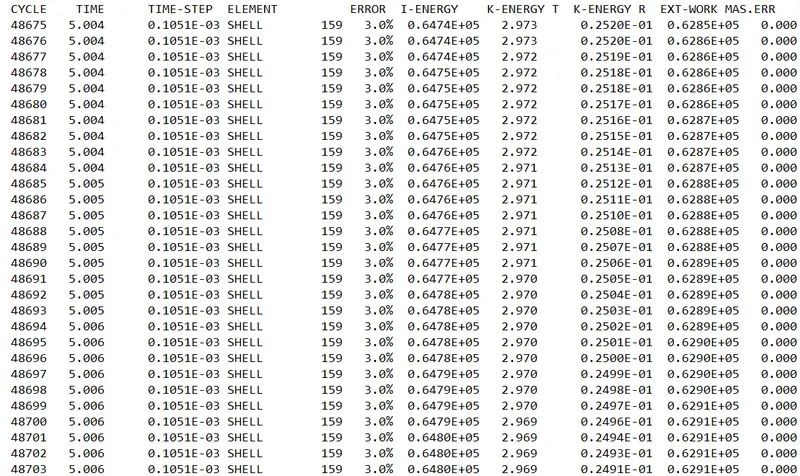
From the OUT file,
- energy error = 0% to 3%
- mass error = 0.00
Since the energy and mass error are within the acceptable range, the model is stable.
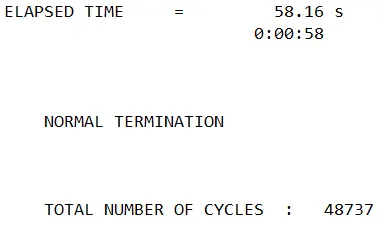
Now the time for simulation and number of cycles taken to complete the simulation is also noted from the OUT file.
Plotting the energy curves using Hypergraph 2-D with the help of T01 File:
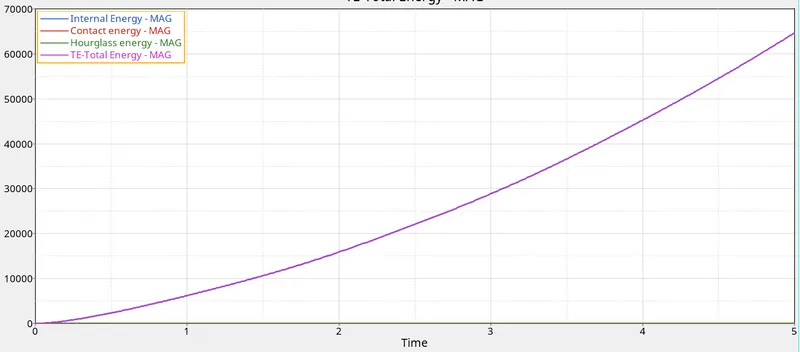
- internal energy and total energy curves follows the same characteristics with an increasing energy value till the end of the simulation.
- Contact energy and hourglass energy are zero throughout the simulation.
Animation and Contour plot of the simulation is obtained under Hyperview using the h3d file saved in the directory:
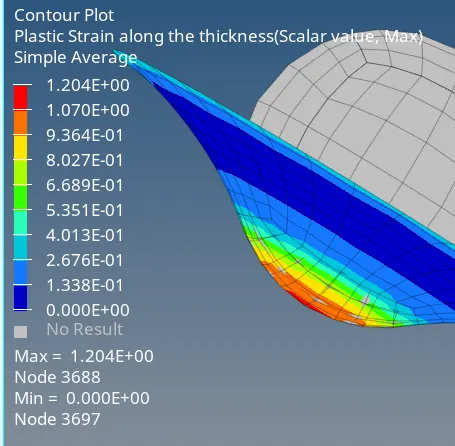
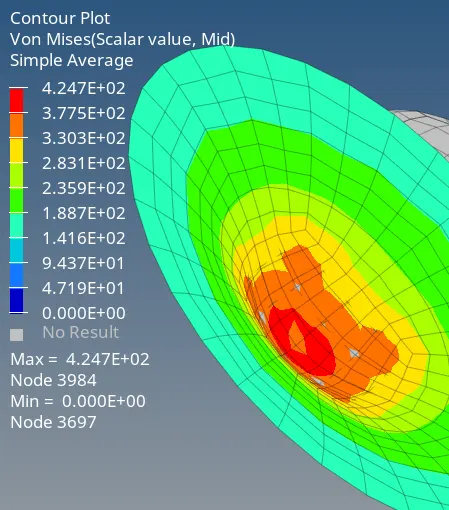
- Since in this case, there is no failure card defined and value of EPS_p_max defined as 0, therefore no elements are cracked or deleted in this case.
- maximum plasic strain developed is 1.2 and maximum von mises stress value reaches 424.7 MPa.
- High value of stress is due to non-failure characteristic of elements.
Case 5:
Initially the given RAD file is imported to Hypermesh.
Converting model to Law 1 elastic by changing the card image to M1_elast:
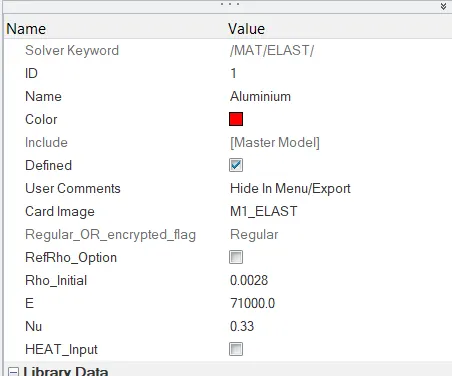
- Carrying out simulation with properties as per recommendation, the OUT file containing energy error and mass error simulation results are viewed to check for model stability:
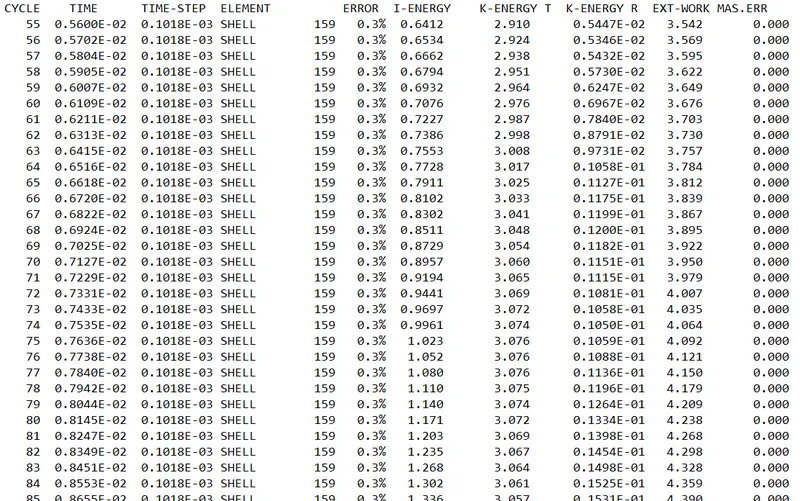
From the OUT file,
- energy error = -0.6% to 4%
- mass error = 0.00
Since the energy and mass error are within the acceptable range, the model is stable.
Now the time for simulation and number of cycles taken to complete the simulation is also noted from the OUT file.
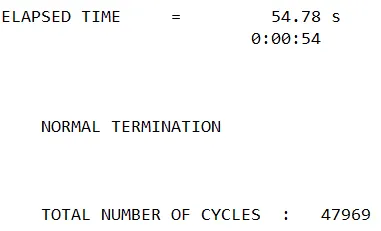
Plotting the energy curves using Hypergraph 2-D with the help of T01 File:
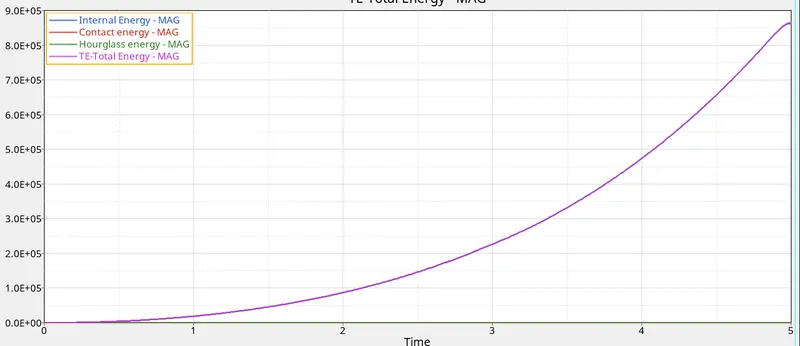
- internal energy and total energy curves follows the same characteristics with an increasing energy value similar to exponential growth curve till the end of the simulation.
- Contact energy and hourglass energy are zero throughout the simulation.
Animation and Contour plot of the simulation is obtained under Hyperview using the h3d file saved in the directory:
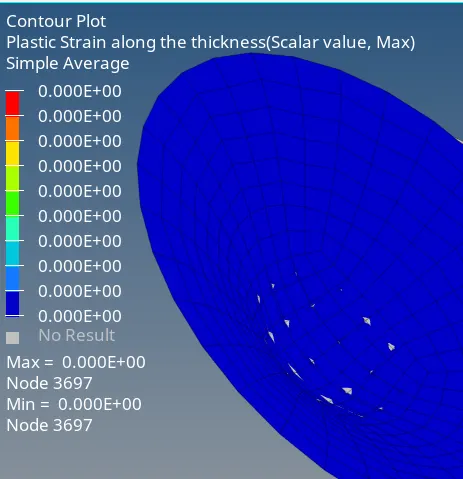
- Material card modified to M1_elast which represents linear elastic material, there is no plastiuc strain developed on the elements.
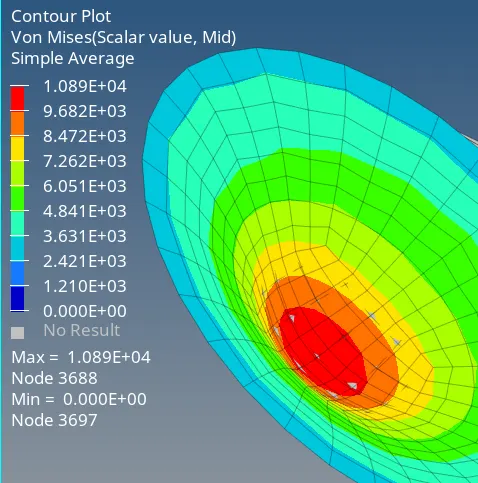
- In this case also, due to the linear elastic behaviour of the material and since no failure criteria is defined, there is no material failure and deletion of elements. Also due to lack of maximum stress defined to the elements, recorded maximum von mises stress is very high, 10890MPa.
Case 6:
Initially, the give file Law27_0000.rad is imported.
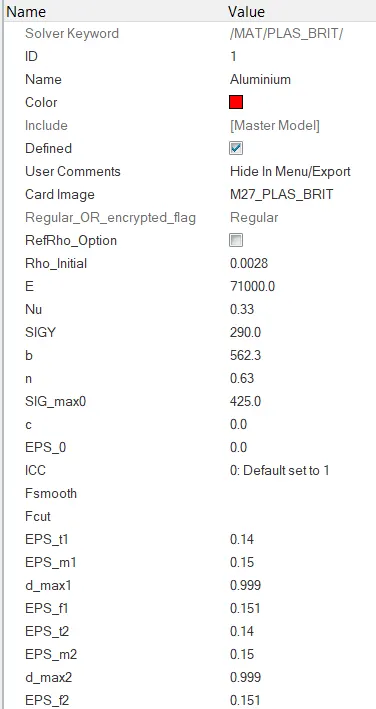
- Carrying out simulation with properties as per recommendation, the OUT file containing energy error and mass error simulation results are viewed to check for model stability:
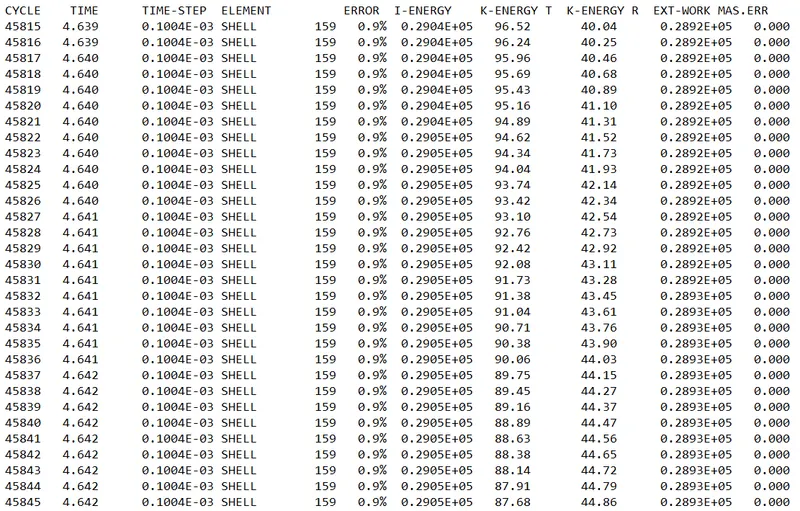
From the OUT file,
- energy error = -0.6% to 0.9%
- mass error = 0.00
Since the energy and mass error are within the acceptable range, the model is stable.
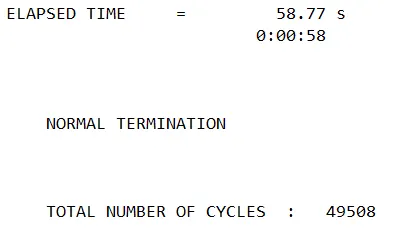
Now the time for simulation and number of cycles taken to complete the simulation is also noted from the OUT file.
Plotting the energy curves using Hypergraph 2-D with the help of T01 File:
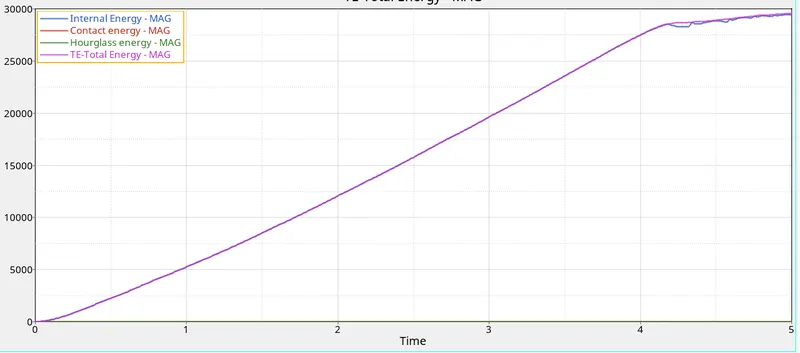
- The internal energy and Total energy of the system increases steadily with time and at time after 4ms, the slope of increase decreases.
- Hourglass energy and contact energy remains zero throughout the simulation as similar to all the cases above.
Animation and Contour plot of the simulation is obtained under Hyperview using the h3d file saved in the directory:
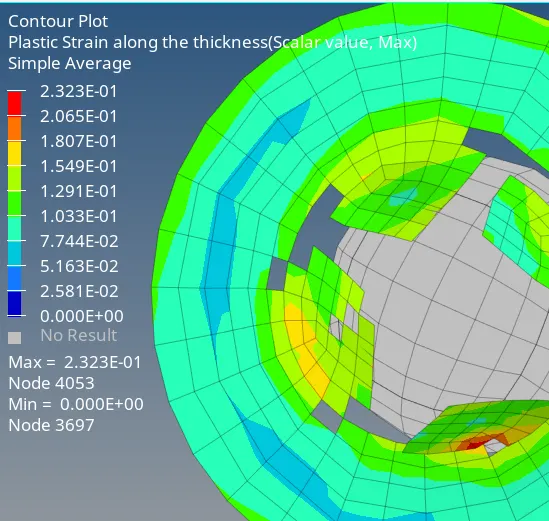
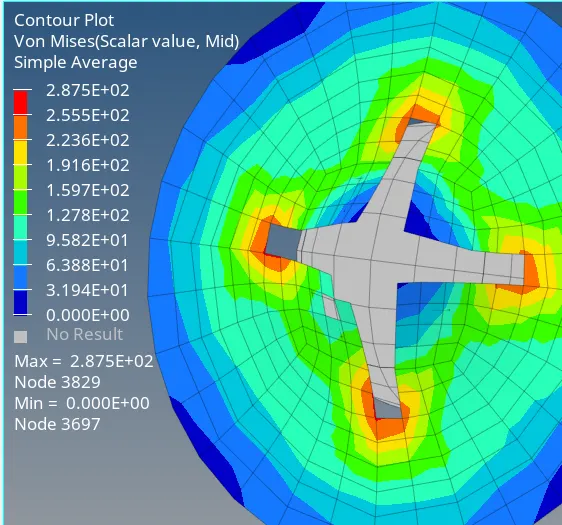
- At end of the simulation, it is clear from the contour plot that most of the elements considered under the model have got deleted.
- The maximum stress developed is 287.5MPa.
- elements start to delete when stress values reaches upto 64MPa at time of 0.5 ms.
Case 7:
Initially, the give file Law27_0000.rad is imported.
New material card is created with formulations as recommended in the video.
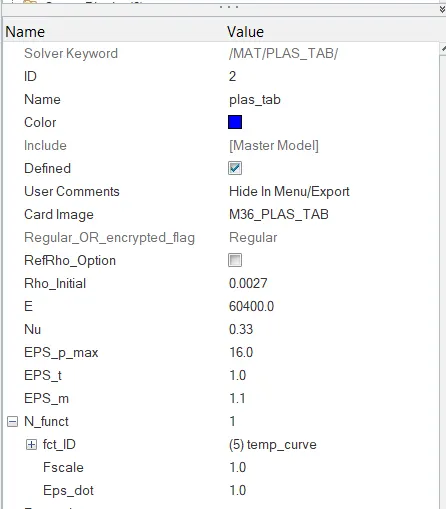
Curve function created with suggested stress strain values from the video:
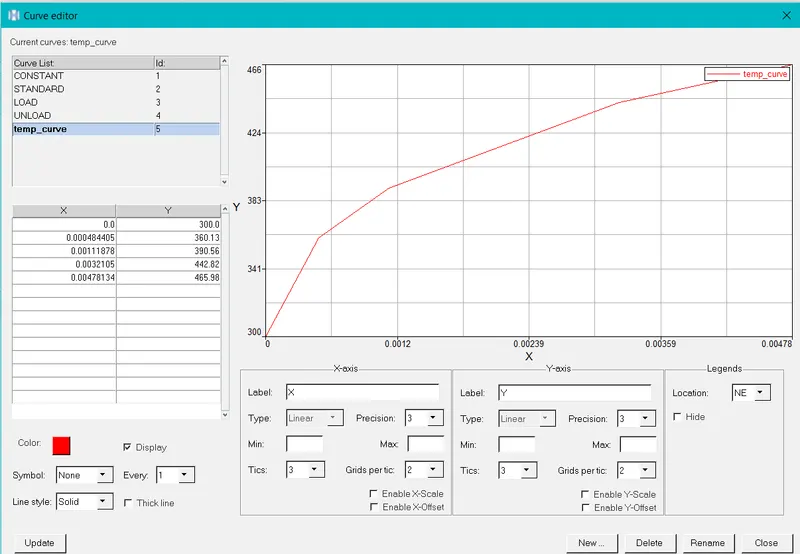
Created curve is assigned to the newly created material card under N_funct with scale factor 1:
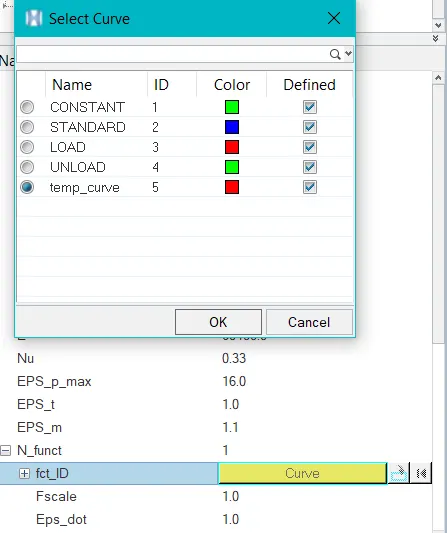
- With this, Carrying out simulation with properties as per recommendation, the OUT file containing energy error and mass error simulation results are viewed to check for model stability:
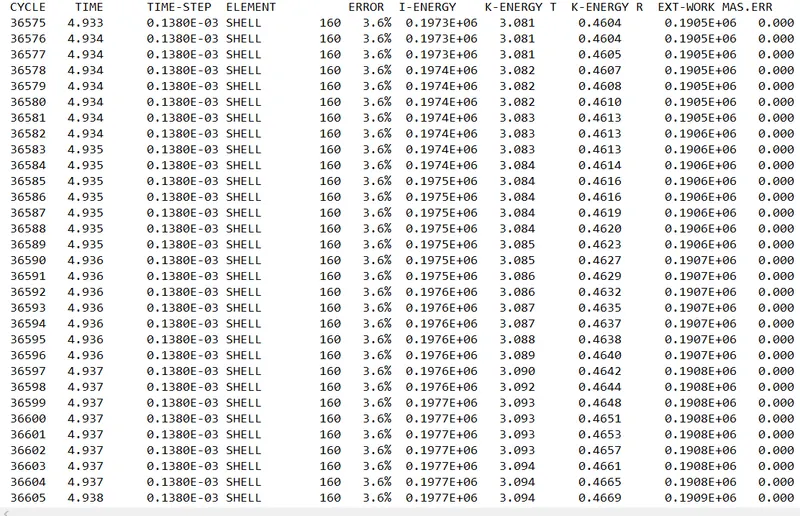
From the OUT file,
- energy error = -3.4% to 3.7%
- mass error = 0.00
Since the energy and mass error are within the acceptable range, the model is stable.
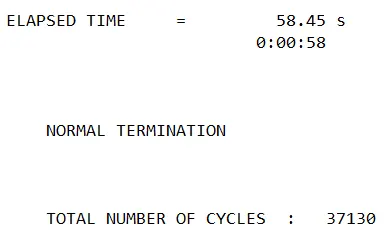
Now the time for simulation and number of cycles taken to complete the simulation is also noted from the OUT file.
Plotting the energy curves using Hypergraph 2-D with the help of T01 File:
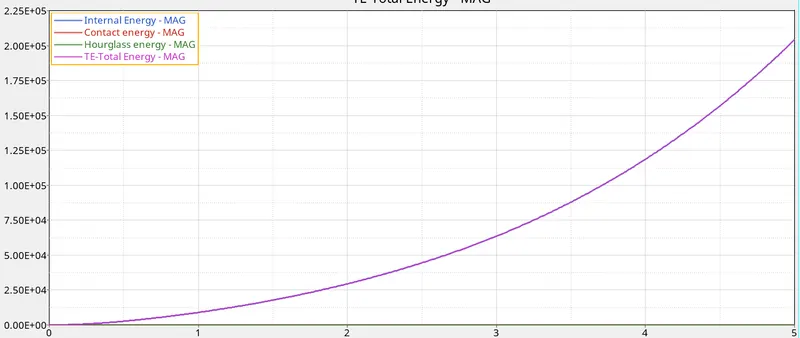
- internal energy and total energy curves follows the same characteristics with an increasing energy value similar to exponential growth curve till the end of the simulation.
- Contact energy and hourglass energy are zero throughout the simulation.
Animation and Contour plot of the simulation is obtained under Hyperview using the h3d file saved in the directory:
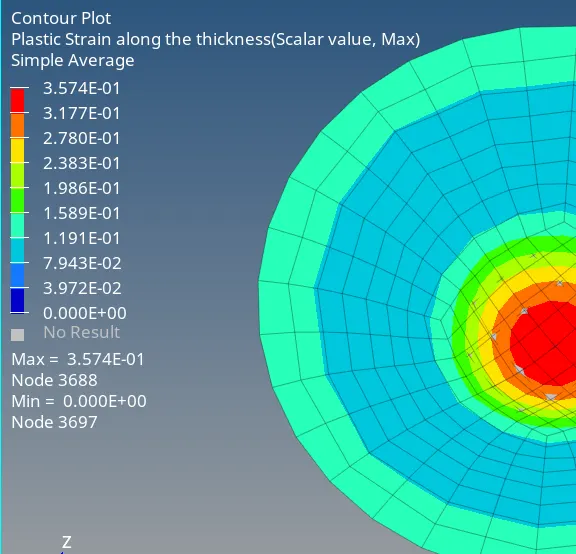
- A maximum plastic strain of 0.3574 is developed in the model, but there is no crack and deletion of elements observed.
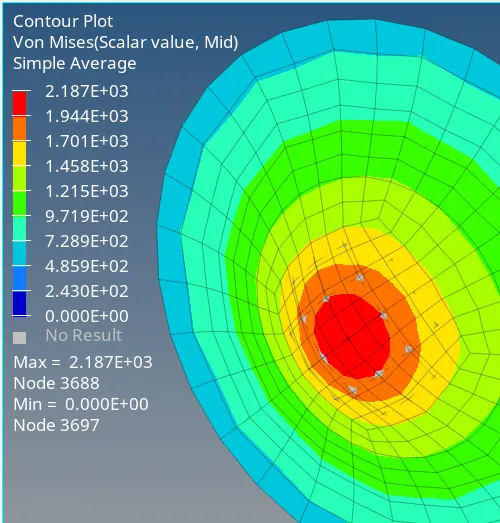
- A maximum von mises stress of 2187MPa is observed. No deletion of elements observed since value of EPS_p_max of the elements not crossed the defined value of 16.0.
Comparison Table:
| CASE | MATERIAL MODEL | NAME | ENERGY ERROR (%) | MASS ERROR | No. of Cycle | TIME (s) | ELEMENT CHANGES | Reason |
| CASE 1 | FAIL/JOHNSON | Law2_EPSmax_failure | -0.6 to 1.3 | 0 | 49380 | 60.29 | Elements Deleted | Failure model |
| CASE 2 | FAIL/JOHNSON | Law2_EPSmax_crack | -1.1 to 4.1 | 0 | 49217 | 64.22 | Elements Cracked & Deleted | Crack due to ifail, I_xfem & Dadv |
| CASE 3 | FAIL/JOHNSON | Law2_EPSmax_nofail | -0.3 to 1.3 | 0 | 49408 | 57.18 | Elements Deleted | elements crossed EPS_p_max values |
| CASE 4 | FAIL/JOHNSON | Law2 | 0 to 3 | 0 | 48737 | 58.16 | No elements Deleted/Cracked | Elastic Behaviour |
| CASE 5 | FAIL/JOHNSON | Law1_elastic | -0.6 to 4 | 0 | 47969 | 54.78 | No elements Deleted/Cracked | Elastic Behaviour |
| CASE 6 | PLAS_BRIT | Law27 | -0.6 to 0.9 | 0 | 49508 | 58.77 | Elements Deleted | Brittle Nature |
| CASE 7 | PLAS_TAB | Law36 | -3.4 to 3.7 | 0 | 37130 | 58.45 | No elements Deleted/Cracked | Elasto-plastic Behaviour |
From the comparative study of a model with different material formulations, the model characteristics also changed with each formulation types.
- On closer look, in a real time incident, in case of an elastic material, Law2, Law1 Elastic and Law36 characteristics can be considered.
- But since the material selected for the plate is Aluminium, a ductile material which have defined values of young's modulus, density, poisson's ratio etc, case2 - Law2_epsmax_crack in which the elements initially cracked rather than getting deleted can be considered.
- For stress values less than the young's modulus of Aluminium, being a ductile material, Case 5 - Law1_elastic can also be an on-Field scenario.
CONCLUSION:
The given model characteristics are studied under various element formulations and its behaviour to a load application is observed and tabulated.