Analysis of 3D External Flow past a submarine Using Ansys Fluent
Aim: Analysis of 3D External Flow past a submarine
Objectives: For the given submarine geometry, you need to perform an external flow simulation in Ansys Fluent to analyze and study the essential phenomena/parameters. The simulation procedure is as follows;
- Clean up the given submarine CAD model, look for geometric errors, resolve them and create the fluid domain in Spaceclaim
- Create an optimum mesh with refinements in the critical regions
- Setup the simulation in Fluent and run the solution until convergence
- Post-process the results in CFD post
The fluid is water and the speed of the submarine is 20 miles an hour. Compute the drag coefficient and drag force encountered by the submarine. Analyse the flow pattern around the submarine and explain the cause for the drag force encountered by it. Use suitable post-processing tools to demonstrate the same.
You can assume suitable boundary conditions but you need to provide reasoning for the BSc you assume. For fluid, you can consider sea water at 20 deg Celsius. You need to choose the fluid properties accordingly.
Expected Output
- You need to describe the workflow in detail from how you cleaned up the geometry and resolved errors.
- You need to show that your solution has converged and explain the criteria used to determine convergence
- Perform the Grid independence test and share your conclusions (if you are not able to achieve grid-independence due to the student license limitation you can include that in your conclusion too)
- The turbulence model needs to be chosen appropriately and the basis for your choice must be explained. You can also calculate y+ for the submarine surface in fluent and include that plot in the report.
Theory:
Introduction:
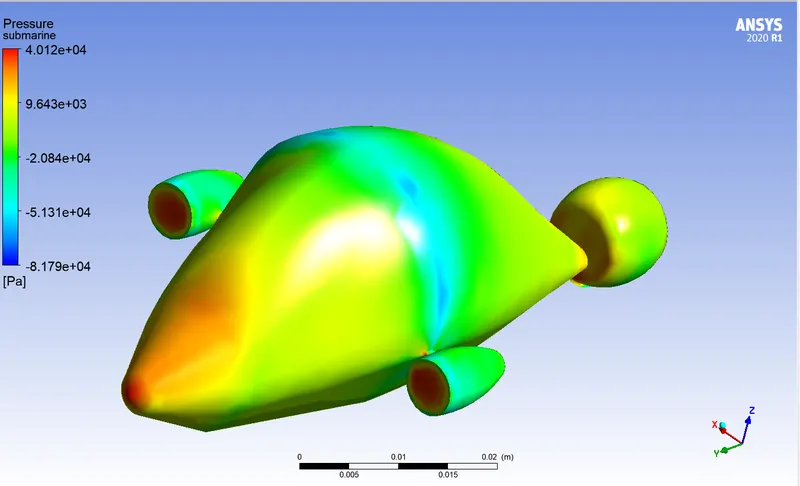
A submarine is a vessel capable of independent operation underwater. It is used as a surface naval weapons platform or as a tool of exploration and recreation. Their stealth plays an important role in a modern naval force. Therefore submarine is a warship with a streamlined hull design to operate completely submerged in the sea for long periods, equipped with a periscope and typically armed with torpedoes or missiles. Most large submarines have a cylindrical body with hemispherical (and/or conical) ends and a vertical structure, usually located amidships having navigation and other equipment devices as well as periscopes. Sometimes known as the conning tower.
As it is well known, flow around submarines is exceedingly complicated, even at simple flow conditions, and the need to reduce submarine signatures from flow-induced noise put high demands on the computational model. Most of the boundary layer on a submarine is predominantly turbulent because of the high Reynolds (Re) number, which typically is encountered in ship hydrodynamics. At the bow, the flow is usually laminar, but rapidly undergoes transitions into a fully turbulent boundary layer, which often makes it reasonable to assume a fully turbulent boundary layer along the entire hull. The boundary layer is further affected by pressure gradients (mainly around the bow and the stern) and the hull curvature, potentially causing a vortex separation usually resulting in distortion of the propeller inflow.
Significance of the point of separation.
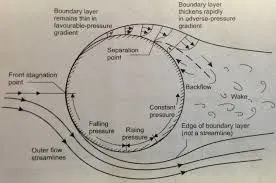
The point of separation is that point at which the velocity gradient changes from positive into negative value. In this point of seperatione the velocity profile du/dy is 0 at the wall. If the adverse pressure gradient acts over a sufficiently extended distance, the deceleration in the flow will be sufficient to reverse the direction of flow in the boundary layer. Hence the boundary layer develops a point of inflection, known as the point of boundary layer separation, beyond which a circular flow pattern is established.
Prediction of Submarine Resistance , Lift, and Drag
Whenever a body is placed in a flow, the body is subject to a force from the surrounding fluid. In general, the force acting on a body is resolved into a component D in the flow direction U and the component L in a direction normal to U. The component D is called drag and L is called lift.
Drag is the force, which acts along the direction of motion of force on the body.
Lift is the force that acts at a right angle to the motion of force through the air. Lift is created by the Pressure Difference.
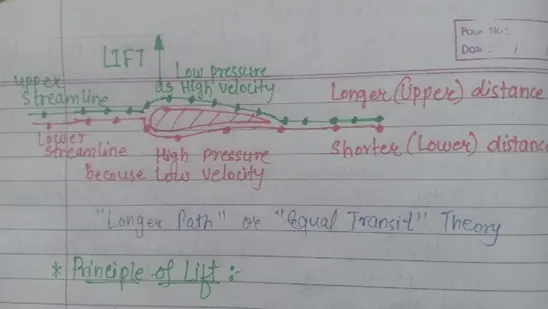
Top of Air foil is shaped to provide to provide longer path than bottom. Air molecules have farther to go over the top. Air molecules must move faster over the top to meet the molecules at the trailling edges that have gone underneath. From the Bernoulli’s eqution , higher velocity produces lower pressure on the top.
Lift over Drag ratio (L/D ratio):
It is the ratio of lift coefficient to drag coefficient.
Skin friction and Form Drag(Pressure Drag)
Whenever a solid moves through a fluid, a parasitic drag is created . Skin friction and Form drag are two sub topics under parasitic drag. Form grad is also called as pressure drag.
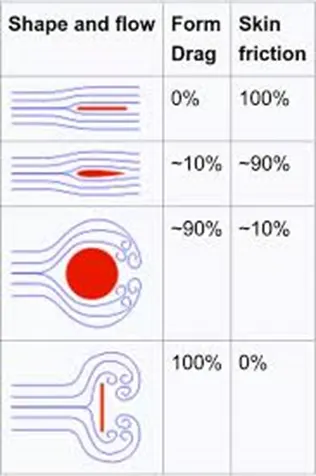
Skin friction drag and form drag are in actual opposite concepts. A streamlined body has higher skin friction drag but lower form drag (the first figure) whereas a blunt body will have higher form drag and lesser skin friction drag (the last figure).
Skin friction drag is dependent upon the presented surface of the object. Friction is created due to the movement of the solid through the fluid and this prevents further movement of the solid forward. This is more for turbulent flows as it would increase the quantum of interaction between the solid and fluid. Thus skin friction drag is reduced by decreasing the presented surface area and by delaying transition of laminar to turbulence. Boundary layer present the surface can give rise to further skin friction drag.
Drag as a result of separation of boundary layer and the wake is called form drag. It has a dependence upon the configuration of the solid rather than the presented surface area. By having a smooth surface , lesser wake region will give rise to lesser form drag.
Turbulence Model:
The k - ω model is well-suited for prediction in the vicinity of the wall, while the k - ε model is for the remaining area near the boundary region. The k- SST-model is using blending functions to be able to use the k-ω model near the wall and the k-ε in the free stream and to get a smooth transition between them. Therefore it is a hybrid between the k- ε and the kω model. The SST k - ω model is known to be fairly effective for better prediction of adverse pressure gradient and flow separation. This model has been designed to promote turbulence in the congestion zone of fluid flow.
The SST k-ω turbulence model is a two-equation eddy-viscosity model developed to effectively blend the robust and accurate formulation of the k-ω model in the near-wall region with the free-stream independence of the k-ε model in the far field. Hence in our Simulation, we have chosen SST k-ω turbulence model near-wall region.
Y plus:
It is important that the mesh near the wall is properly sized to ensure accurate simulation of the flowfield. By knowing the Y+ (1-5 for laminar flow & 30-10,000 for Turbulent flow) value, the height of the first mesh cell off the wall can be calculated.
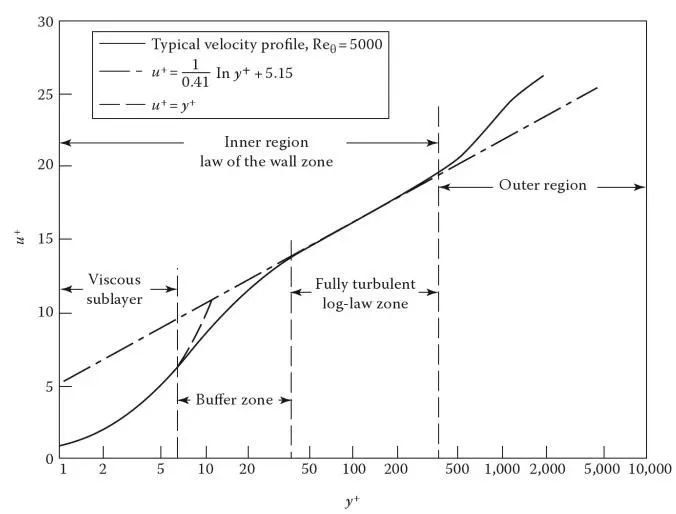
SST is some kind of a hybrid model that can handle full range of Y+. From less than 1 and up to 300.
On one side of the spectrum it behaves like k-omega. On the other side it behaves likes k-epsilon.
Inflation layer calculation:
The Y plus value in the Simulation for Turbulence SST K-omega is taken as 5. (The value ranges from 1 upto 300, but for external flow over the body it is taken as 1 to 10).
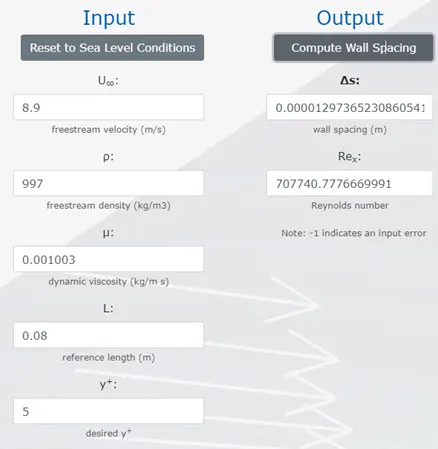
Total Thickness: First cell thickness*(Growth rate ^ No of inflation layers)
0.0000129*1.2^2 = 1.8576e-5 metre.
Number of inflation layers describes the scaling of mesh. As the inflation layers increases, the grid becomes more refine. But due to computational limitation of the current software, we have taken 2 inflation layers.
Reynolds Number:
The type of flow depends on the Reynolds number of the flow impinging on the body,
Re = rho*v*d/mu
= 997*8.9*0.08/ 0.001003 = 707740.777
where rho is the density of the fluid, v is the impinging free stream flow velocity, d is a characteristic length of the body, e.g. the diameter for a sphere or cylinder, and mu is the viscosity or inherent stickiness of the fluid. The Reynolds number essentially takes the ratio of inertial forces rho*v*d to viscous forces mu, and captures the extent of laminar flow (layered flow with little mixing) and turbulent flow (flow with strong mixing via vortices).
For Laminar Flow Re = 0 to 2300
For Transition Flow Re = 2300 to 4000
For Turbulent Flow Re = 4000 onwards.
--------------------------------------------------------------------------------------------------------------
Simulation setup:
Open Ansys Workbench. Drag and drop Fluid Flow (Fluent) onto Project Schematic.
Here, we will see Steps we need to follow to solve a particular engineering system from a CFD standpoint.
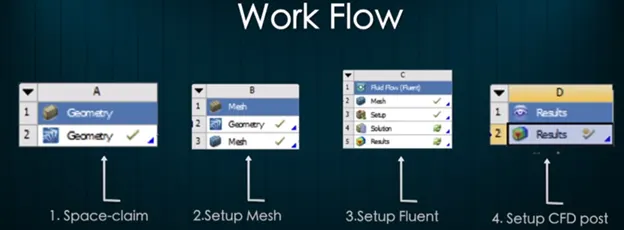
- Geometry: Spaceclaim, where we import the geometry.
- Mesh: Ansys Mesh, where Boundary naming, element sizing and mesh generation with required grid size will be done.
- Setup: Ansys Fluent, where actual case setup will be done.
- Solution: Ansys Fluent, where runtime results visualization done.
- Results: CFD-Post, where Post Processing of Results will be done.
CAD Cleanup:
Import Submarine CAD geometry into Spaceclaim, Spaceclaim is CAD cleanup software that can be used to prepare CAD models for simulation setup. It could be for CFD or FEA.
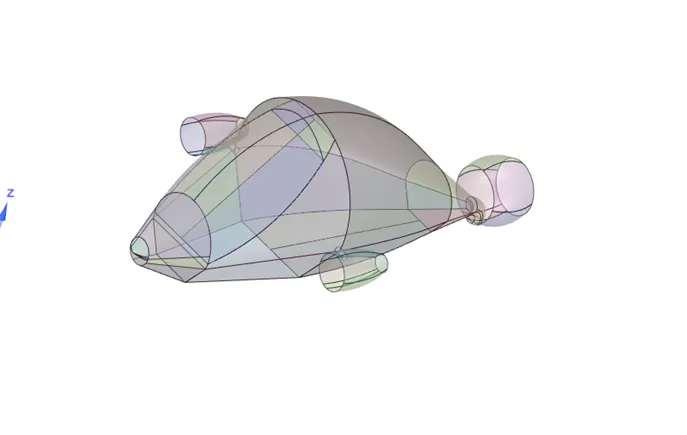
We can see that, the above CAD model has lots errors such as missing faces, split edges. First we need to convert our free edges into multiple bodies using Combine tool. For that select the surfaces which we want to combine and click on combine tool.
Then use Repair tool to automatically fix duplicate faces and edges.
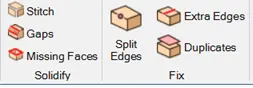
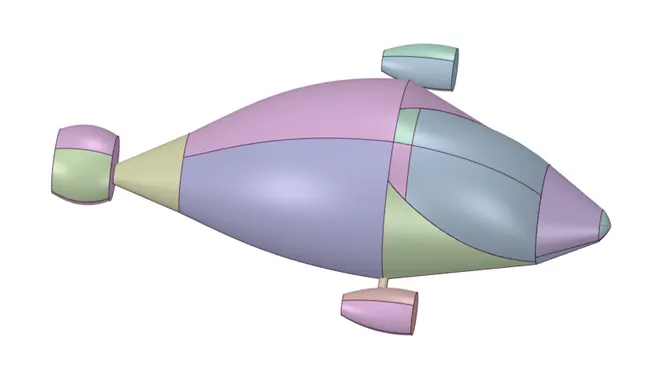
After fixing the errors our CAD model has been cleaned.
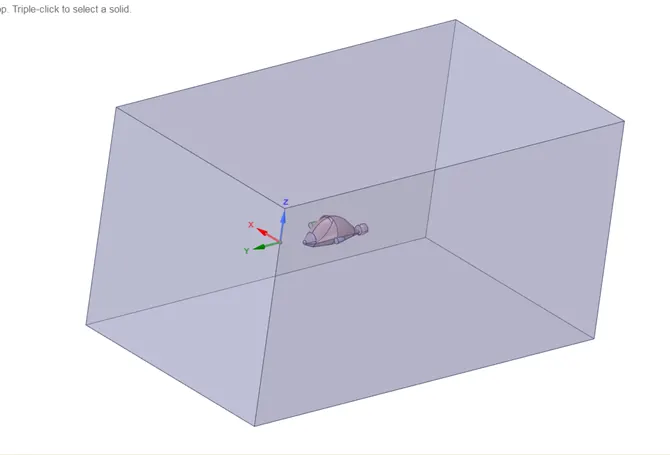
Now create an Fluid domain around the Submarine model for simulation flow around it.
Mesh Generation, Baseline and Refined Mesh:
Baseline Mesh:
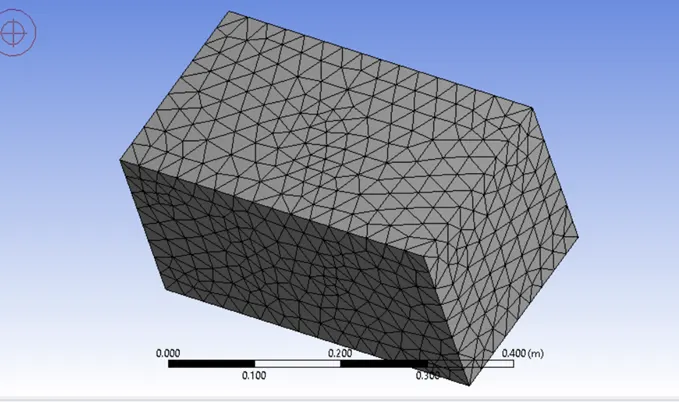
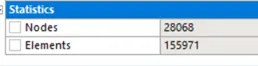
Default element size 2.7e-2 m.
Nodes and Element statistics:
Grid independence test:
Element size: 10mm
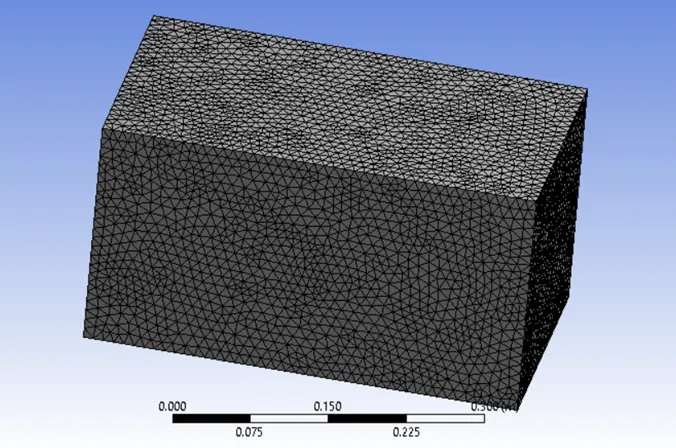
Nodes and element statistics:

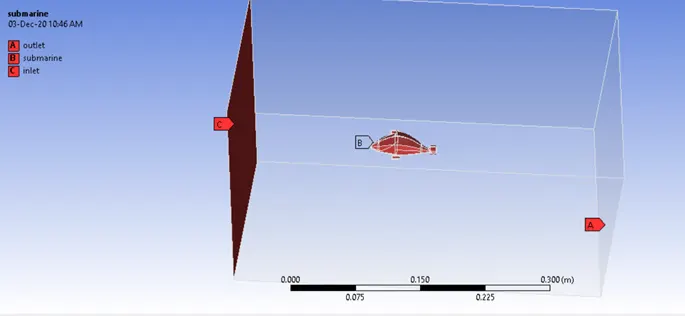
Name selection: Inlet, Outlet, walls, Submarine.
Element size: 7mm
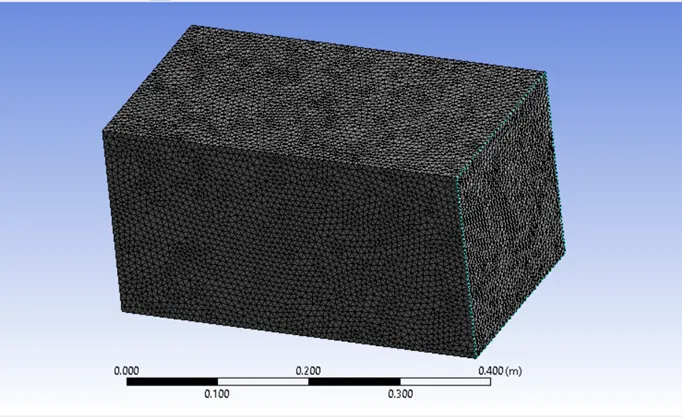
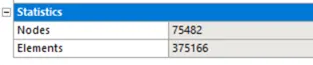
Nodes and Elements:
Inflation layers:
Total thickness = 1.8576e-5 m
Update and close Meshing.
Fluent Setup:
Setting up physics: Select k-omega turbulent model. (Description of the selected turbulence model is given in theory section)
Solver: Pressure based Solver as the Mach number is less than 0.3.
Assign Time as Steady-State Solver, as we want to calculate the end results of the solution.
Material Selection: Water with temperature of 20 degree celcius.
Properties of Material:
Density = 998 kg/m^3
Viscosity = 0.001003 kg/m.s
Setting Boundary Condition:
Inlet:
Type: Velocity inlet with velocity of 20 miles/ hr=8.904 m/s
Temperature = 20 degree celcius
Outlet
Type: Pressure outlet: 0 Pascal. (Ambient Pressure)
Submarine = wall (Slip boundary condition.)
Walls: Type walls (top, bottom and side surfaces)
Assigning different Flow quantities:
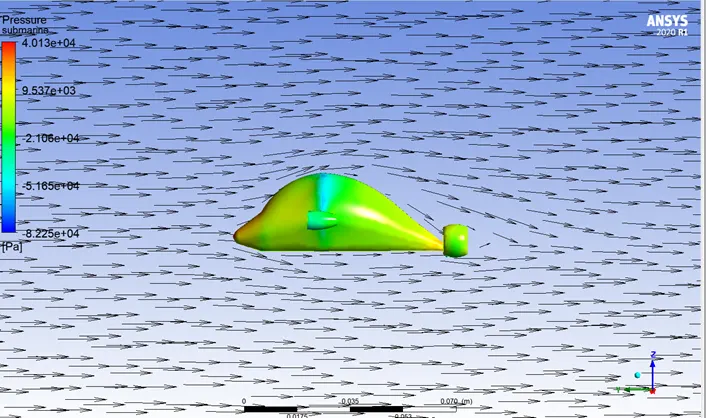
- Create Pressure and Velocity contour
- Create the cut Plane to see velocity and Pressure profile.
- Create the report Plot for drag and Lift Coefficient.
- Hybrid Initialize and run the Simulation.
Results and Plots:
Residuals:
Baseline Mesh
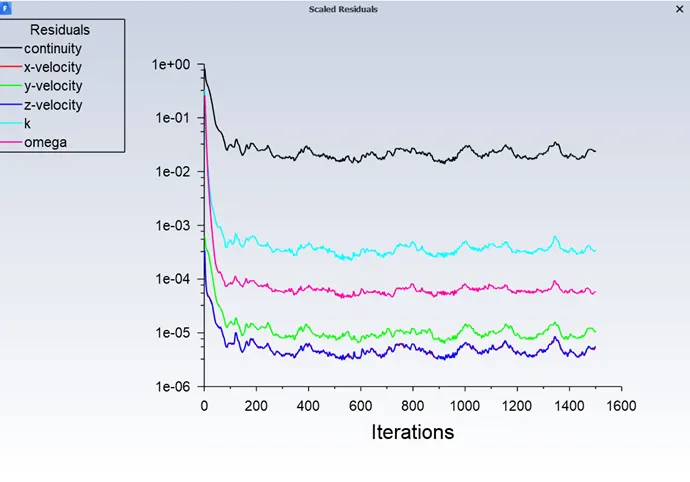
The solution of Residuals are repeating their values and giving common trend, hence converge has been reached at about 1200 iterations.
Refined Mesh
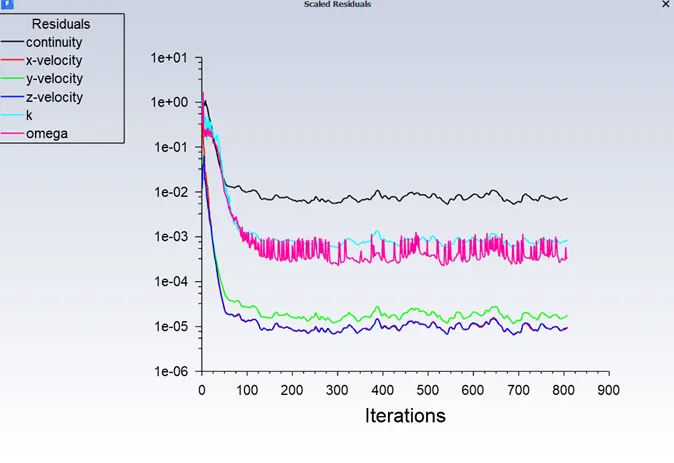
The solution of Residuals are repeating their values and giving common trend, hence converge has been reached at about 700 iterations.
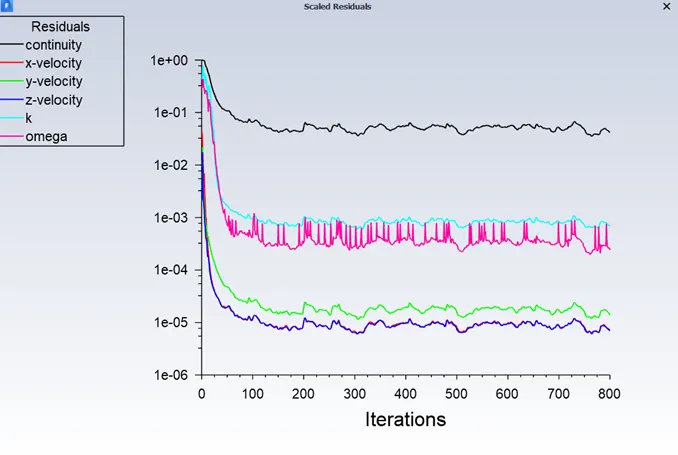
The solution of Residuals are repeating their values and giving common trend, hence converge has been reached at about 650 iterations.
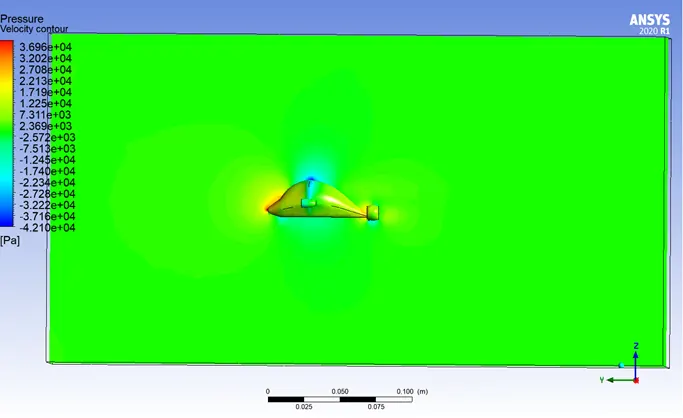
Pressure Contour:
Baseline:
Refined:
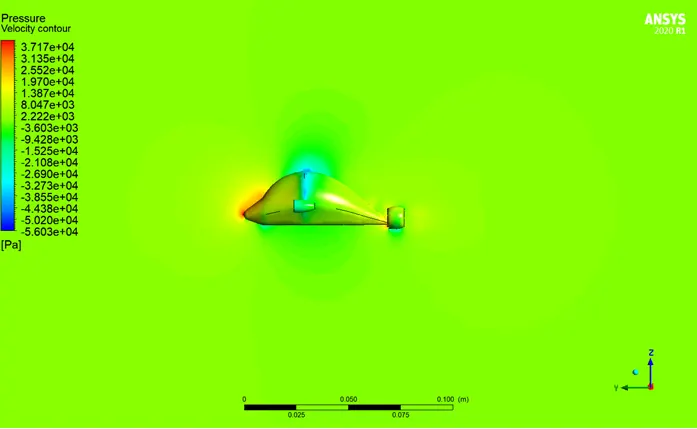
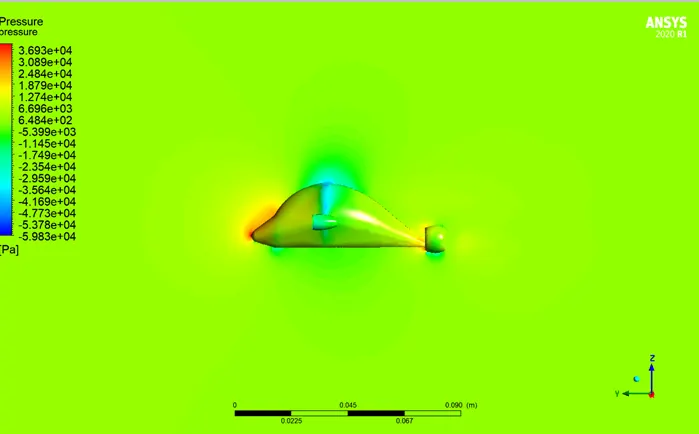
From both the mesh cases we can see that, the pressure is maximum at the nose of the submarine whereas it is minimum at the top.
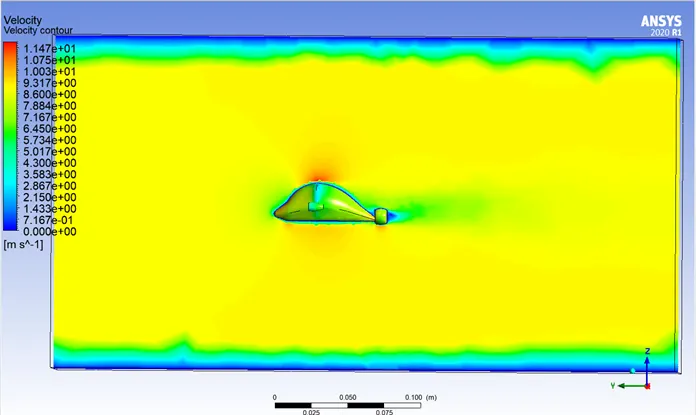
Velocity contour:
Baseline:
Refined:
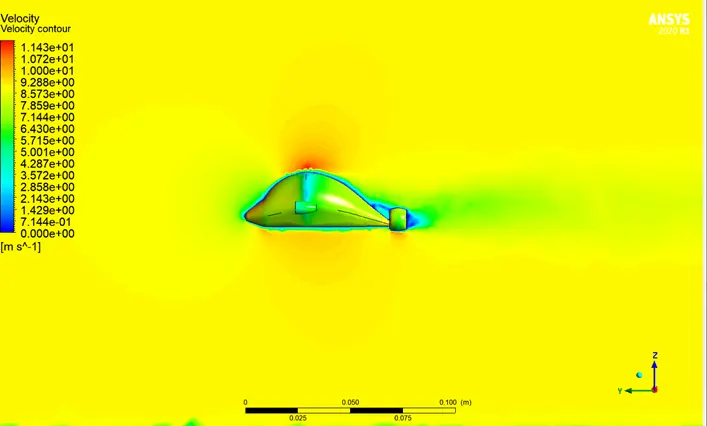
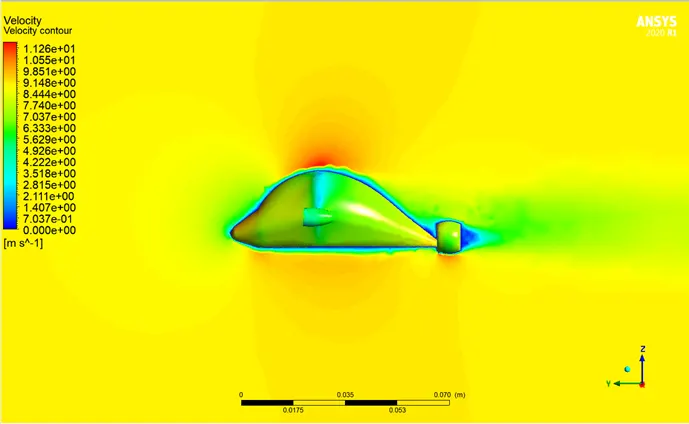
From both the contour, we can see that the velocity is maximum at the top of the submarine due to minimum pressure there and velocity is minimum at the end of tail due to flow separation.
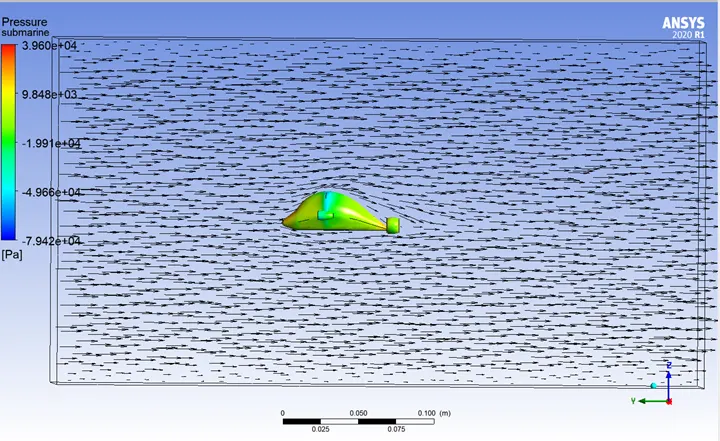
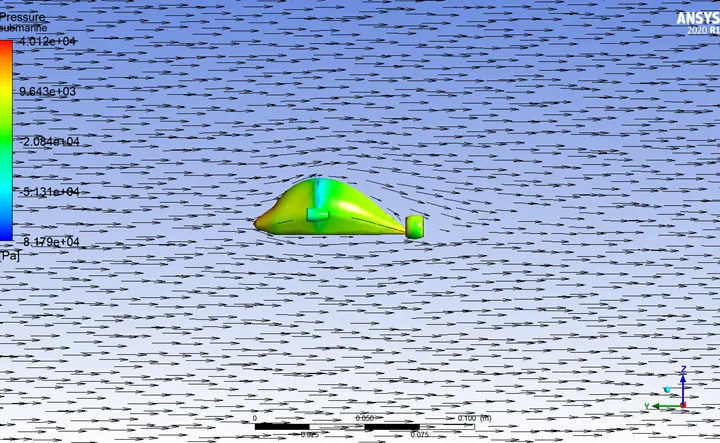
Velocity Vectors:
Baseline:
Refined:
Y Plus Plot:
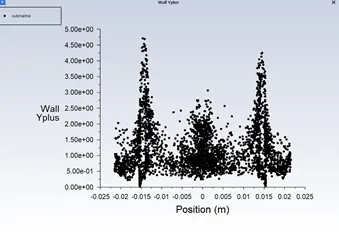
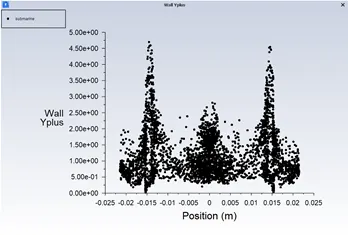
From the Y plus plot, we can see that for both the refined meshes, the Y plus value for ranges from 0 upto 5.
Drag, Lift forces and drag coefficients:
Baseline
Drag:

The drag force (Fd) is 7.696439 N, and drag coefficient (Cd) is 12.565615.
Lift:

The Lift force (Fl) is 1.611524 N, and Lift coefficient (Cl) is 2.6310597.
L/D = Fl/Fd = Cl/Cd = 0.209
As the Lift over Drag coefficient is less than 1, hence the Drag is dominant as compared to Lift.
Refined(10mm):
Drag:

The drag force (Fd) is 7.8909156 N, and drag coefficient (Cd) is 12.883127.
Lift:

The Lift force (Fl) is 1.4387115 N, and Lift coefficient (Cl) is 2.3489168.
Refined(7mm):
Drag:

The drag force (Fd) is 8.0247 N, and drag coefficient (Cd) is 13.101.
Lift:

The Lift force (Fl) is 1.35624 N, and Lift coefficient (Cl) is 2.2142747.
Velocity Profiles at different line probes:
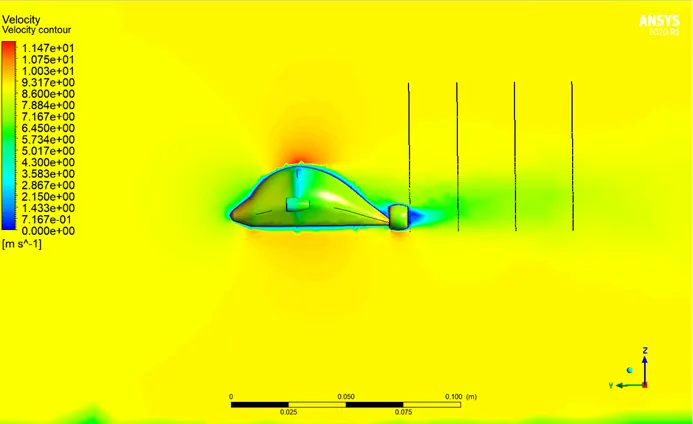
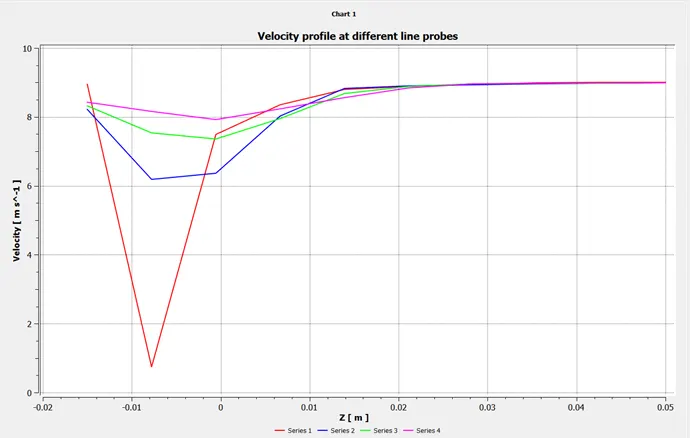
At different line probes. The velocity profile changes. We can see that the velocity near the end of Nose is very less change in cross section, whereas at some distance the velocity increases.
In the graph, Series 1,2,3,4 indicates velocity probes position from near to far from the tail end of Submarine respectively.
At some vertical distance velocity is equal to the free stream velocity.
Effect of Grid Independence test on Drag and Lift, and Number of Nodes and Elements:
|
Mesh size (mm) |
Inflation layer (Total thickness in mm) |
Drag Force(N) |
Coefficient of Drag (Cd) |
Lift Force (N) |
Coefficient of Lift (Cl) |
Nodes |
Elements |
|
27 (Baseline Mesh) |
- |
7.696439 |
12.565615 |
1.611524 |
2.6310597 |
28068 |
155971 |
|
10 (Refined Mesh) |
0.372 |
7.8909156 |
12.883127 |
1.4387115 |
2.3489168 |
54477 |
266367 |
|
7 (Refined Mesh) |
0.372 |
8.0247 |
13.101 |
1.35624 |
2.2142747 |
75482 |
375166 |
Conclusion:
The Submarine’s body resistance depends on the pressure distribution around the body. Therefore is evident that, if the displaced volume of the submarine is contained in a long thin shape, then the skin friction is greater than for a shorter shape of the same volume which has less wetted surface. Shorter length and greater diameter which will reduce the total drag force closer to the ideal.
As Lift over drag ratio increases, the lift increases and skin friction drag decreases.
The Combine tool and Repair tools in Spaceclaim has been used for CAD cleanup.
As the mesh becomes finer, the convergence achieved with less number of iterations, however computational time increases.
The Grid independence test has been performed and there is not very large variations in the solutions.
The SST K-omega Turbulence model is used due to its versatile application (as mentioned in Turbulence theory section).
For the Y plus value of 5, total thickness of Inflation layer for refined cells near the wall region is 1.8576e-5 m.