Linearised Stress Results in Ansys Workbench
Ansys workbench provides different options on deformation, stress, strain, probe, energy, contact etc. One can easily select a particular option in the model and evaluate the results.
 Navin Baskar·12 Oct 2022·4 min read
Linearised Stress Results in Ansys Workbench
Ansys workbench provides different options on deformation, stress, strain, probe, energy, contact etc. One can easily select a particular option in the model and evaluate the results. The contour results that are requested using the above-said options are 3-dimensional. These 3D contour results give the overall stress/strain intensity of the model.
Let’s say the 3D result is not enough, especially when you are performing an important simulation like pressure vessel simulations, gun barrel simulations etc., where the pressure or stress flow through the thickness is required, one can use cross-sections to cut the model and check the results. The disadvantage of a cross-section is that only the model is cut and the stress results are not going to change. To perfectly know the change in results through the thickness or anywhere through the path, the linearised stress results help us in understanding them. For a deeper understanding, the bevel gear model is taken as an example.
Where to find Linearized Stress in Ansys?
The linearised stress result option is available under the solution set as shown below,
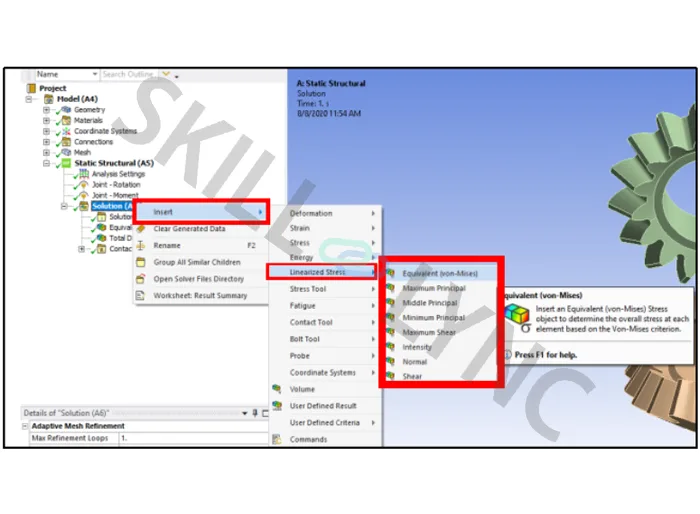
The insert > linearized stress > further results help in creating new linearized stress results in the outline window. Once linearized stress is selected, the associated details view is displayed as shown below,
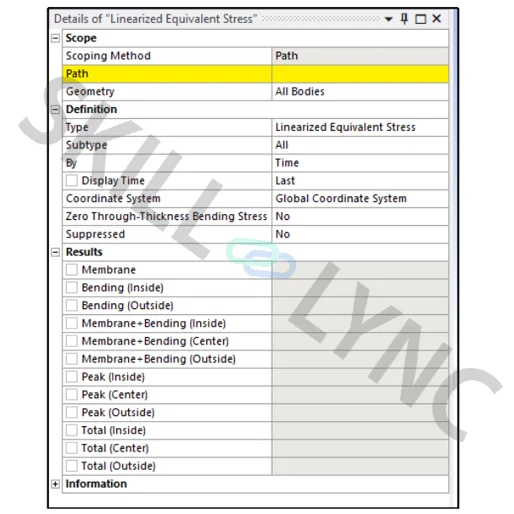
In the above image, you have the path option under a scope. Under the definition, options like type, subtype, by and coordinate system are present. Under the results option, you have various output results, which will be displayed once the model is simulated. It also provides the option to parameterize the listed outputs.
How do we create a path in Ansys Workbench?
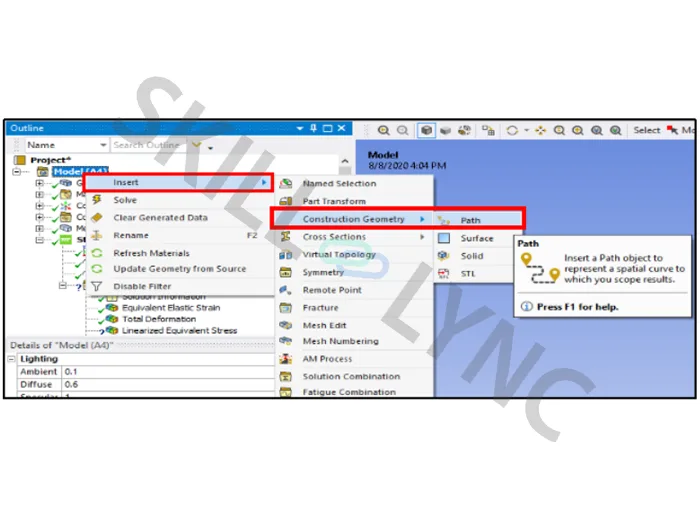
Now for the path, you need to create a particular path and assign that path under linearized stress. The path is available under the projects scheme, as construction geometry by right-clicking on the same name of options as shown below,
On creating the path, detailed options are displayed as shown below,
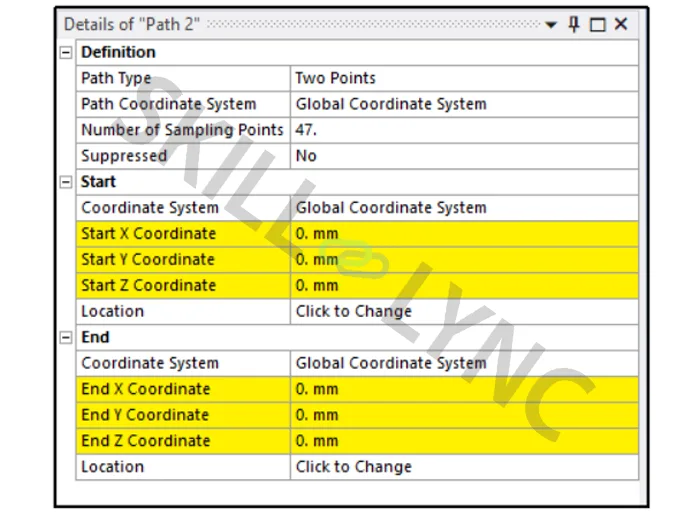
The path type provides 3 options: those are two points, edge, and X axis intersection. If you have the coordinates of the points, you can directly enter the coordinate values in the start X, Y, Z, and end X, Y, and Z values. Option two points are preferred.
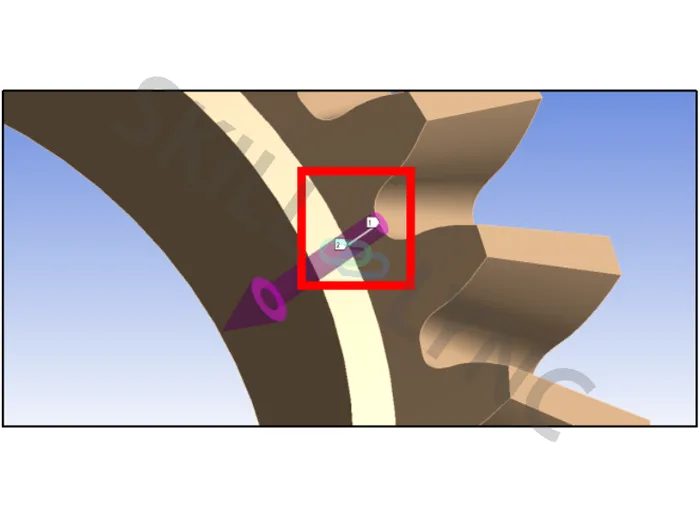
As mentioned above, when the path is created, this path can be assigned in the PATH option under linearised stress details menu.
In the linearised results, under the definition, you can find the options like Type, subtype, by, and display time.
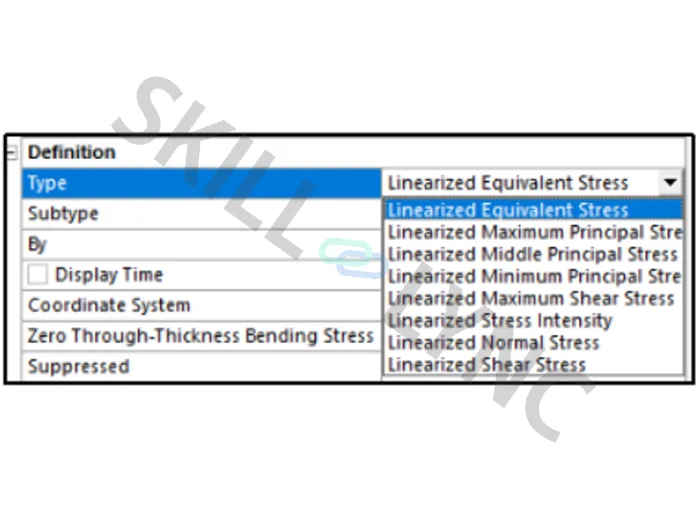
Type provides the different types of results required. Linearized equivalent stress, maximum principal stress, middle principal stress etc. If the type is selected, that particular result is displayed after running the simulation.
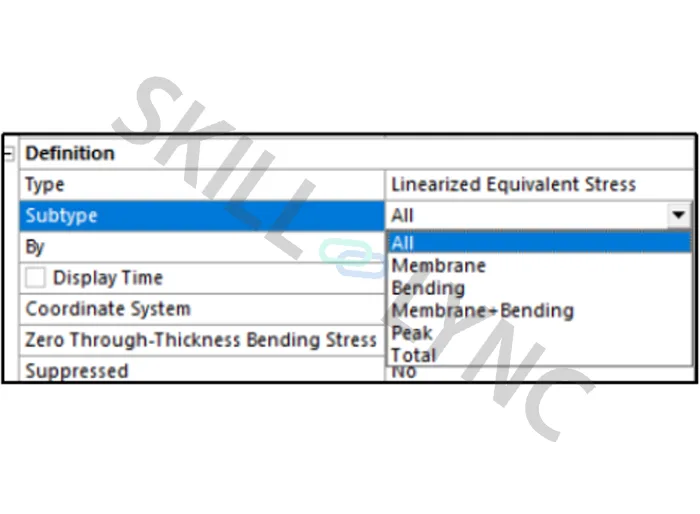
The subtype is what kind of result you require from the path. It provides options like All, Membrane, bending, Membrane+Bending, Peak, and Total.
Membrane stresses are generated along the thickness of the geometry. It is a compressive or tensile load that acts along the thickness. This membrane stress can be divided into three, based on the direction of the load generated. These are translational membrane stress, longitudinal membrane stress and in-plane shear stress. Plays an important role in the design of thin shells and pressure vessels.
Bending stress is the normal stress that an object encounters when it is subjected to a large load at a particular point that causes the object to bend and become fatigued.
Display Time is the time till which the linear stress must be calculated. Now you may ask, how the stress is calculated in that path? There are points created through the path as shown below, the saved path includes the endpoints and each interval point along the stress line.
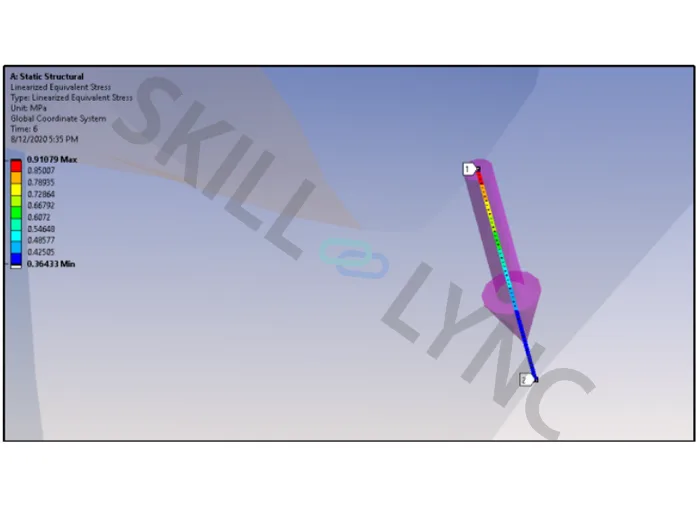
The values are obtained at equally spaced intervals along the line in a local coordinate system defined by the line. If ALL options are selected, the solver provides Membrane, Bending, and Membrane+bending results. After running the simulation, when a linearized stress result is clicked, membrane stresses, and bending stresses tabular values are down below in the mechanical browser. These bending membrane and peak values are displayed for the length of the path. The length is the distance between one sample point to the other.
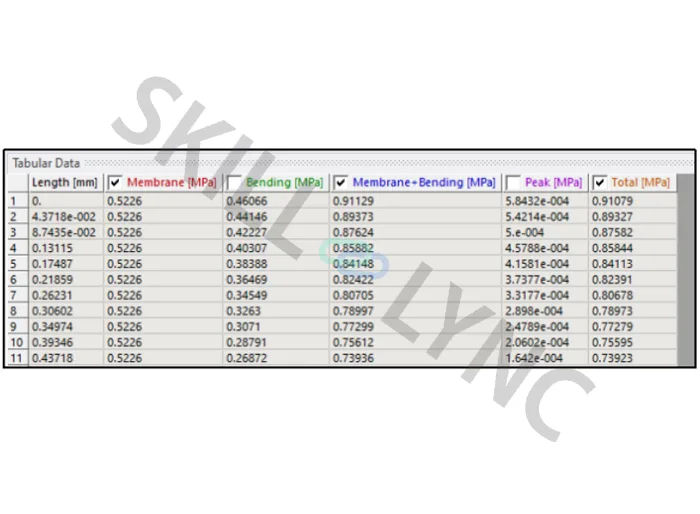
If you want to increase the number of sampling points, under the path option, one can enter the value in the path details option.
To conclude, the linearised stress results are used to determine the stress or any other results in a line. One can find the bending stress, membrane stress, peak stress, etc through a line. This stress is calculated through bending stress present in the line. These results will be very helpful in the situations like pressure vessel design and pressure or force-related models. One can take the length and membrane stress values and plot them separately to find the change in stress through the thickness.