All About Tolerance Stack-Up Analysis
Tolerance stack-up analysis is a method used in the industry to find out the allowable variation in the gap between parts in an assembly. By using tolerance stack-up analysis, we can optimize the tolerances in the component, thereby reducing the production cost.
 Navin Baskar·29 Jul 2022·2 min read
All About Tolerance Stack-Up Analysis
Tolerance stack-up analysis is a method used in the industry to find out the allowable variation in the gap between parts in an assembly. By using tolerance stack-up analysis, we can optimize the tolerances in the component, thereby reducing the production cost.
There are mainly two methods used in the industry to do tolerance stack-up analysis:
- Worst Case
- Statistical analysis (Root Sum Square/Root Mean Square)
The worst-case method calculates the maximal and minimal distance between two parts or attributes (based on worst cases).
The statistical analysis (root sum square/root mean square) uses arithmetic and statistical methodologies to achieve similar objectives.
Worst Case Method
Here we calculate the maximum and the minimum tolerance variation between the parts and we find out the total variation by subtracting the maximum value and minimum value and dividing it by two.
Hence we obtain the worst-case stack-up tolerance value.
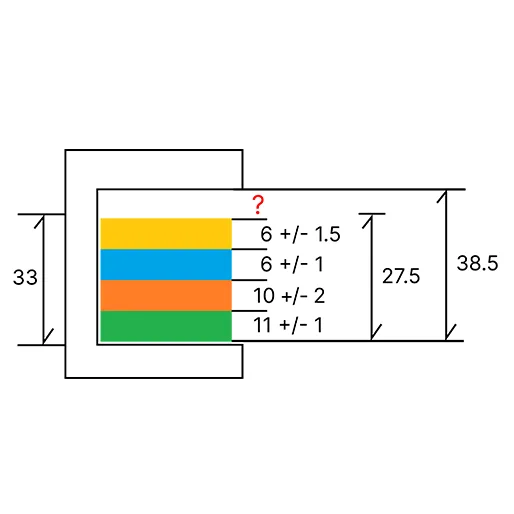
Image 1: Tolerance stack up
In this case, we will calculate the worst case. First, the maximum values of sizes possible are:
- 11+1 = 12
- 10+2 = 12
- 6+1 = 7
- 6+1.5 = 7.5
Total value = 12 +12+7+7.5 -= 38.5
Now the minimum value of sizes possible are:
- 11-1 = 10
- 10-2 = 8
- 6-1 = 5
- 6-1.5 = 4.5
Total value = 10+8+5+4.5 = 27.5
Thus the worst case value will be = (Max value total - Min value total)/2 = (38.5 -27.5)/2 = 5.5
So the total size tolerance for the assembly can be written as 33±5.5
Root Sum Square (RSS)
Unlike the previous method, Root Sum Square (RSS) assumes the certainty of tolerance estimate and the arrangement of tolerances being considered.
Here we calculate the root of the square of all the tolerance values
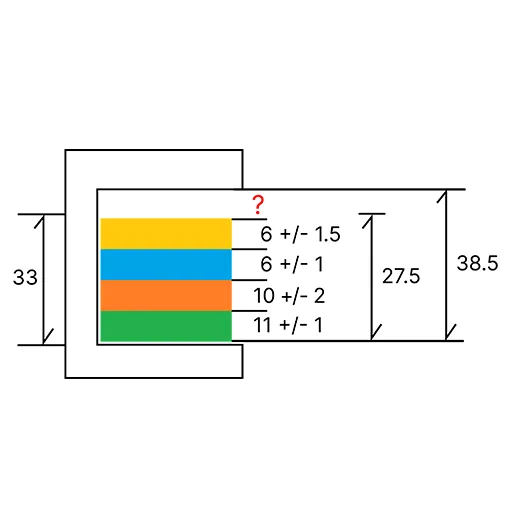
Image 2: tolerance stack up
RSS = √1^2 +2^2+1.5^2+1^2
= 2.87
So 2.87 is the Root Sum Square value.
So the total size tolerance for the assembly can be written as 33±2.87
The Best Tolerance Stack-Up Analysis Method
The fast-paced manufacturing sector often highlights the best (and, the worst) of both methodologies. While the worst-case method is always simple, the root sum square method often guarantees exact results. After weighing the benefits of each methodology, the fact remains unchanged for its better variation and its impact.
In such times, tolerance stack-up analysis should be able to cater to the need of achieving accuracy at a minimal cost. Irrespective of the method used, optimization in both existing and new designs needs to be ensured.
Benefits of Tolerance Stack-Up Analysis
To sum it all up, below are the benefits of tolerance stack-up analysis:
- Reduces the rework resulting in cost reduction
- Optimized use of resources at the disposal
- Sure fit which reduces the span of design-to-manufacture
- Anticipate demand in advance
Knowing the cost and performance impact on the final assembled part.