Writing a MATLAB/Octave Program To Observe The Effect of (dx) On Truncation Error For First, Second & Fourth Order Approximations
Problem Statement
1. For a range of dx, plot the first order, second and fourth-order error.
dx range = [pi/4000,pi/40,20]
2. Make sure that you plot dx vs error in a way that makes sense.
3. Explain the results in the space provided. What can you say about the slope of the curves in this plot?
4. Write a detailed explanation for your results, plots, or codes without explanation will be awarded zero marks.
You need to Attach screenshots of the output, paste the code here using the "INSERT CODE SAMPLE" option. If you fail to do these, marks will be deducted accordingly.
                                                                      #Function For First Order Approximations
----------------------------------------------------------------------------------------------------------------------------------------------------------------------------------------------

function error_first_order = first_order_approx(x,dx)


     analytical_derv = (x^3*(cos(x)) - sin(x)*3*(x^2))/(x^6);
     forward_diff = ((sin(x+dx)/(x+dx)^3) - (sin(x)/(x)^3))/dx;
     error_first_order = abs(forward_diff - analytical_derv);


end
                                                                    #Function For Second Order Approximations
--------------------------------------------------------------------------------------------------------------------------------------------------------------------------------------


function error_second_order = second_order_approx(x,dx)


     analytical_derv = (x^3*(cos(x)) - sin(x)*3*(x^2))/(x^6);
     central_diff = ((sin(x+dx)/(x+dx)^3) - (sin(x-dx)/(x-dx)^3))/(2*dx);
     error_second_order = abs(central_diff - analytical_derv);


end
                                                                    #Function For Fourth Order Approximations
------------------------------------------------------------------------------------------------------------------------------------------------------------------------------------------


function error_fourth_order = fourth_order_approx(x,dx)


     analytical_derv = (x^3*(cos(x)) - sin(x)*3*(x^2))/(x^6)
     fourth_order_diff = ((sin(x-2*dx)/(x-2*dx)^3) - 8*(sin(x-dx)/(x-dx)^3) + 8*(sin(x+dx)/(x+dx)^3) - (sin(x+2*dx)/(x+2*dx)^3))/(12*dx)
     error_fourth_order = abs(fourth_order_diff - analytical_derv)


end
                                                                                    #Main Program
------------------------------------------------------------------------------------------------------------------------------------------------------------------------------


clear all
close all
clc

x = pi/3;
dx = linspace(pi/4, pi/4000, 20);

for i=1:length(dx)

     first_order_error(i) = first_order_approx(x,dx(i));
     second_order_error(i) = second_order_approx(x,dx(i));
     fourth_order_error(i) = fourth_order_approx(x,dx(i));
end

figure (1)
loglog(dx,first_order_error,'r');
hold on
loglog(dx,second_order_error,'g');
hold on
loglog(dx,fourth_order_error,'b');
hold off

xlabel('Errors')
ylabel ('dx')

legend ('first_order_error','second_order_error','fourth_order_error')
Result:-
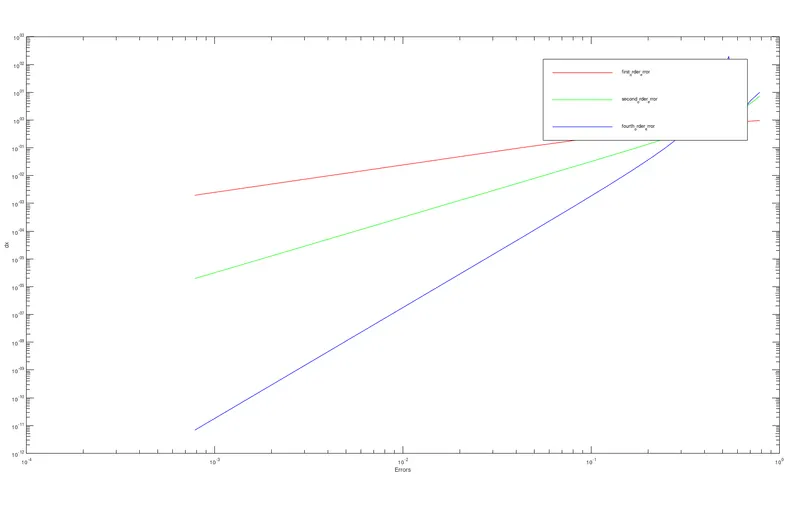
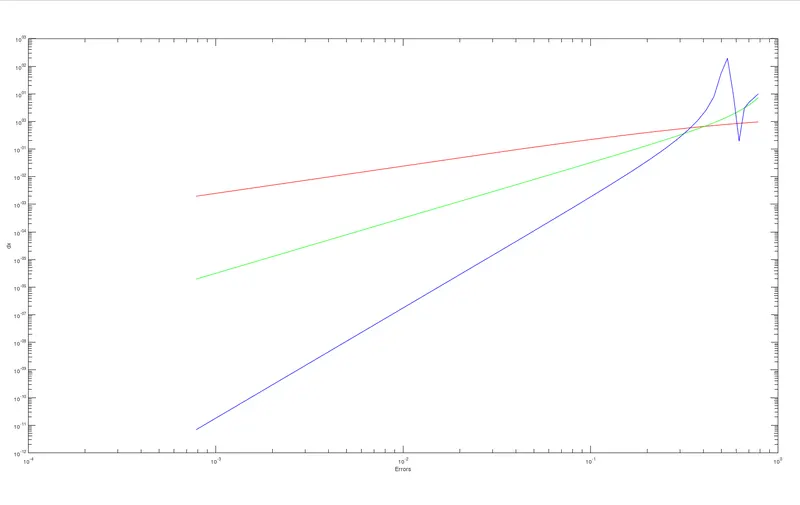
Observation & Conclusion:-
From the above plot, we can observe that as the value of (dx) increases as the error also increases steadily. For the first-order approximation, denoted by a red line, we notice that the line remains straight with no sudden deviation. The same can be observed for the second-order approximation, the only difference being that at a certain point on the graph the slope intersects with the first-order approximation slope & then drops indicating that the errors are lower. For fourth-order approximation, we observe a very steep upward deviation indicating the most number of truncation errors when compared to the rest but then almost immediately the slope drops down to have the least number of errors. Thus, we can conclude that fourth-order approximations are extremely accurate at some point, will contain the lowest errors but after that point, errors will start showing an upward steep again.