Week 9 - Parametric study on Gate valve.
AIM
To perform parametric study on gate valve simulation using ANSYS software.
OBJECTIVE
- To perform gate valve simulations by setting the opening from 10% to 80%.
- To obtain the mass flow rates at the outlet for each design point.
- To calculate the flow coefficient and flow factor for each opening and then plot the graph.
THEORY
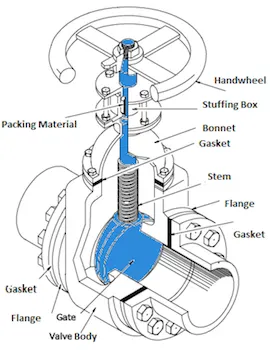
A gate valve is a type of valve that opens by lifting a barrier out of the path of the fluid. They are operated by a threaded stem which is connected to the hand wheel that acts as the actuator. Such valves when fully open has no obstruction to the fluid flow and has a very low pressure drop.
Gate valve and its parts are shown in the diagram given below,
Flow coefficient & Flow factor
These two terms are basically the valve’s capacity to allow fluid flow through it. Both of these are a designing factor which relates head drop or pressure drop across the valve with the flow rate. The difference between the two is that flow coefficient is in imperial units where as flow factor is in metric units.
Flow coefficient is hence defined as the flow rate in US Gallons per minute of water at a temperature of `60 °F` with a pressure drop across the valve of 1 psi. It is represented as `C_v`.
`C_v = Q*sqrt((SG)/(DeltaP))`
Where , Q is the flow rate in US Gallons per minute , SG is the specific gravity and `DeltaP` is the pressure drop in psi.
Flow factor is defined as the flow rate in cubic meters per hour of water at temperature of `16 °C` with a pressure drop across the valve of 1 bar. It is represented as `K_v`
`K_v = Q*sqrt((SG)/(DeltaP))`
Where , Q is the flow rate in `m^3/(h)`, SG is the specific gravity and `DeltaP` is the pressure drop in bar.
PROCEDURE
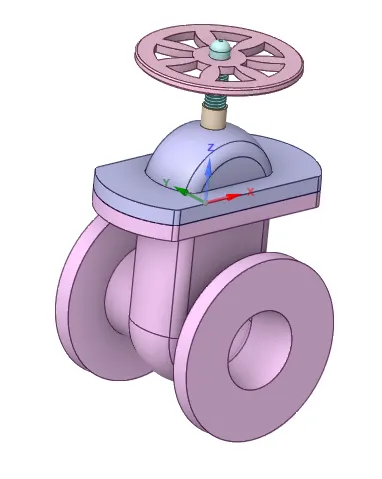
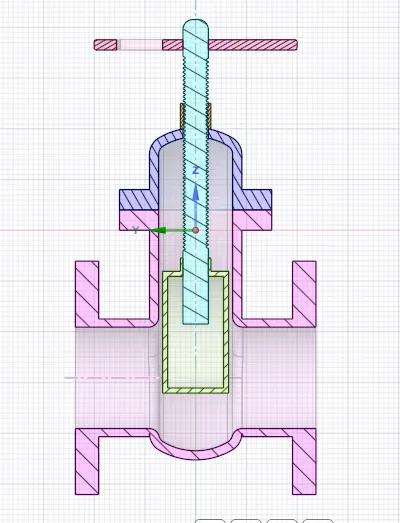
- The 3-D geometry of gate valve is processed using space-claim software in ANSYS.
The 3-D geometry is shown below,
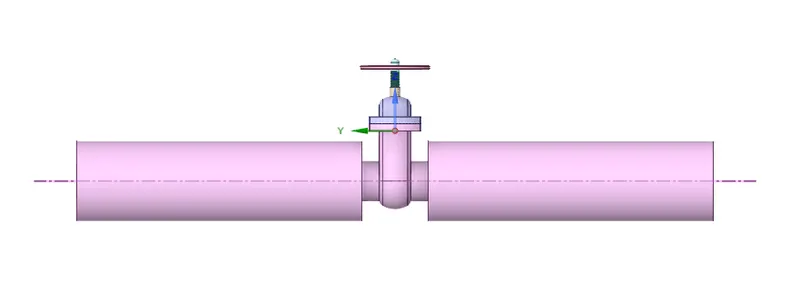
- The inlet and outlet pipes are pulled on either side of the valve using the pull tool by 800mm as shown below,
- Then the fluid volume is extracted using the volume extract tool. The extracted volume is shown below,
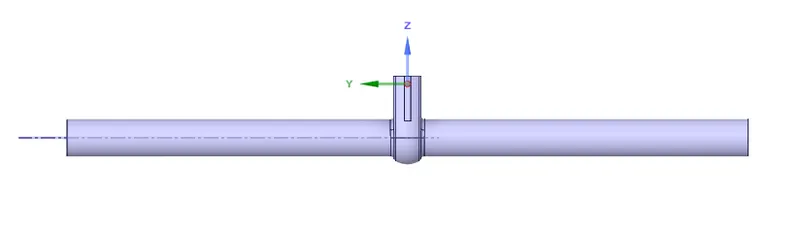
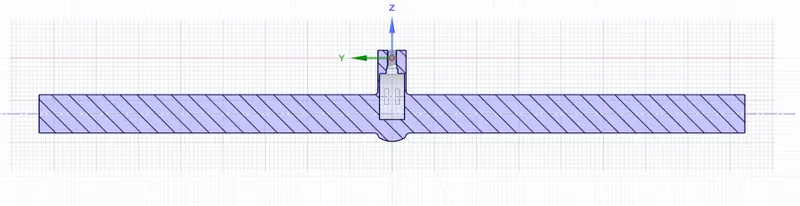
Cross-section of the extracted volume,
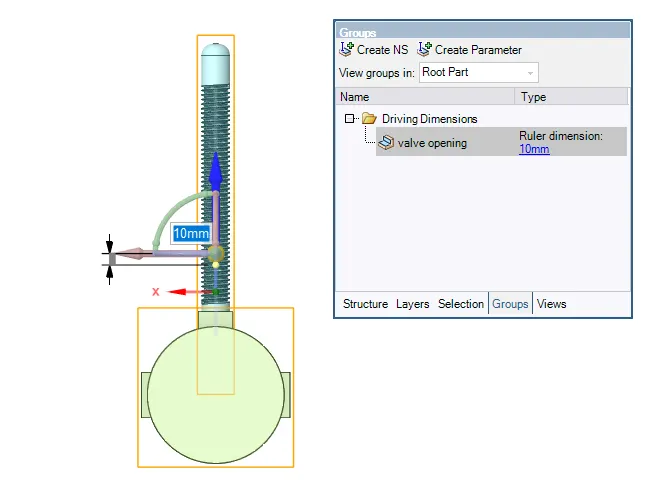
- The spindle and the gate is parametrized as shown below,
- This extracted volume is meshed using ANSYS meshing software. The meshed geometry is shown below,
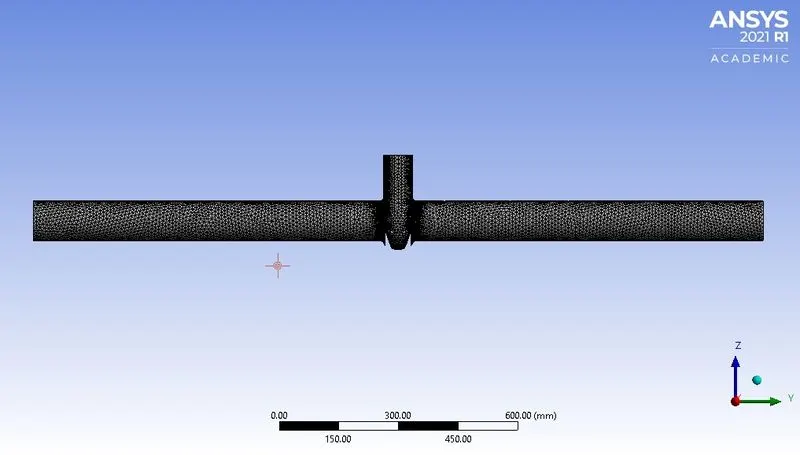
- The size of the element used is 10mm and the total number of elements is 193370.
- Using the named selection , inlet and outlet are named.
SIMULATION SET-UP
- Pressure based steady state solver is used and the solution scheme is Coupled pressure-velocity coupling. Gravity is also enabled.
- The viscous model used is Realizable k-epsilon with scalable wall function.
- The fluid volume material is Fluent default water-liquid of density 998.2 Kg/m3
- Pressure based inlet and outlet boundary condition is used. The inlet pressure is set to `10` Pa and the outlet pressure is set to `0` Pa (`1` atm) .
- A report definition to calculate the outlet mass flow rate is defined using flux report.
- Standard initialization calculated from inlet is done.
Post simulation calculations
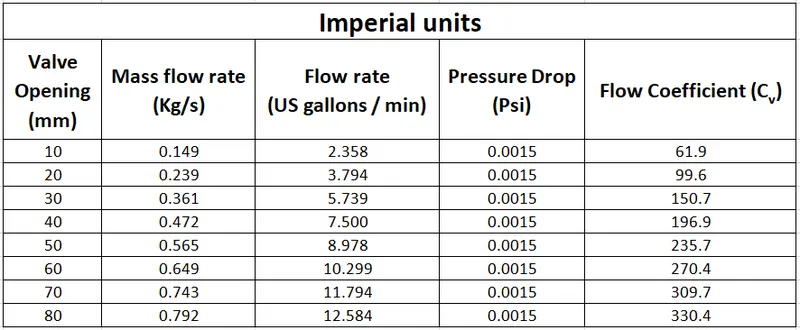
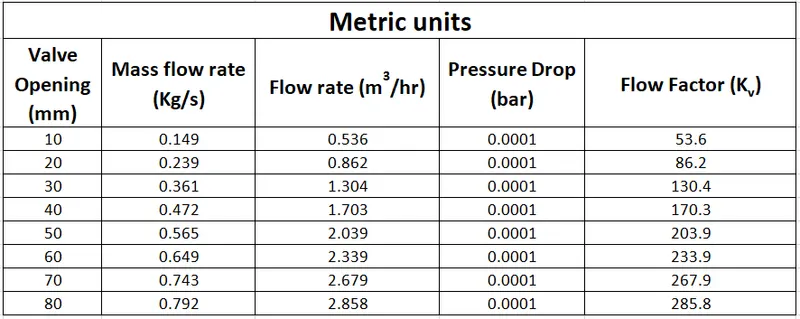
- After performing the parametric study , the flow coefficient and flow factor are calculated using their respective formulas.
- The flow rate is calculated from the mass flow rate using the following equations,
For flow rate in metric units (Cubic meter per hour),
`Q = (dotm*3600)/rho`
For flow rate in imperial units (US gallons per minute),
`Q = (dotm*60*264.17)/rho`
Where , `dotm` is the mass flow rate in Kg/s and `rho` is the density of the fluid in Kg/m3.
- The pressure drop is calculate as follows,
`DeltaP = "inlet pressure" - "outlet pressure"`
Since the outlet pressure specified is `0` , `DeltaP = "inlet pressure"`
`DeltaP = 10` Pa
For metric unit , `DeltaP = "(inlet pressure in Pascal)"*10^-5` bar
For imperial unit , `DeltaP = "(inlet pressure in Pascal")*14.5*10^-5` psi
RESULTS
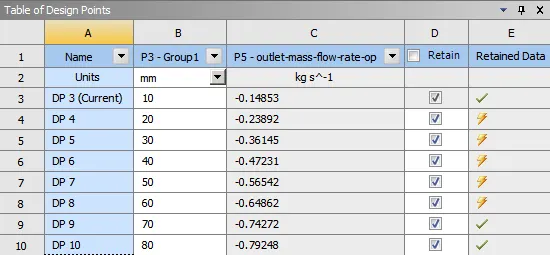
The mass flow rate values calculated using the parametric study for different valve openings are shown below,
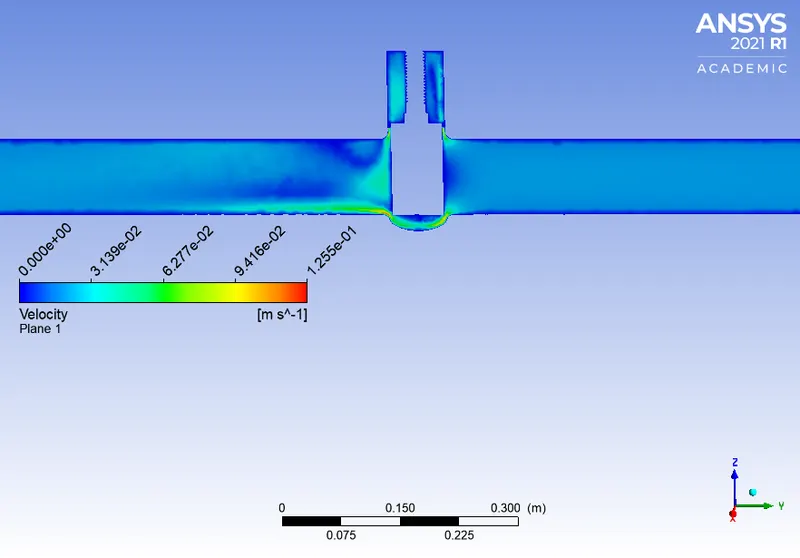
Contour plot showing the velocity at different valve openings is given below,
For 10mm opening ,
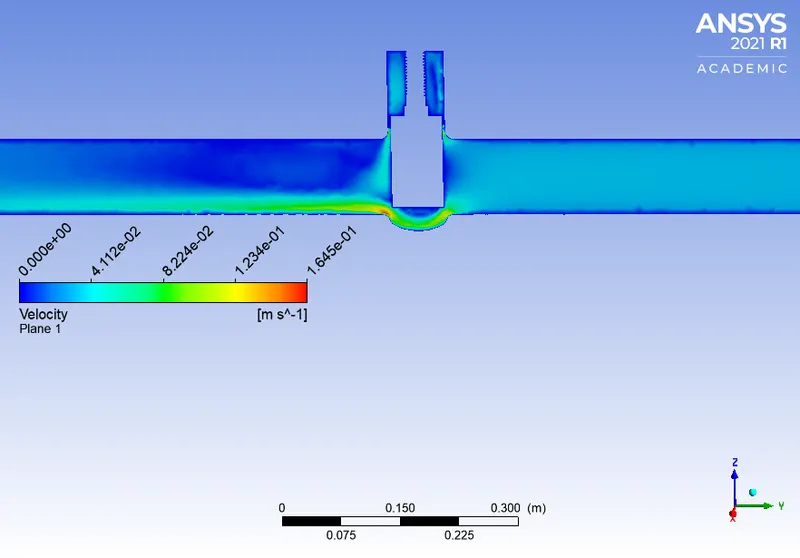
For 20mm opening ,
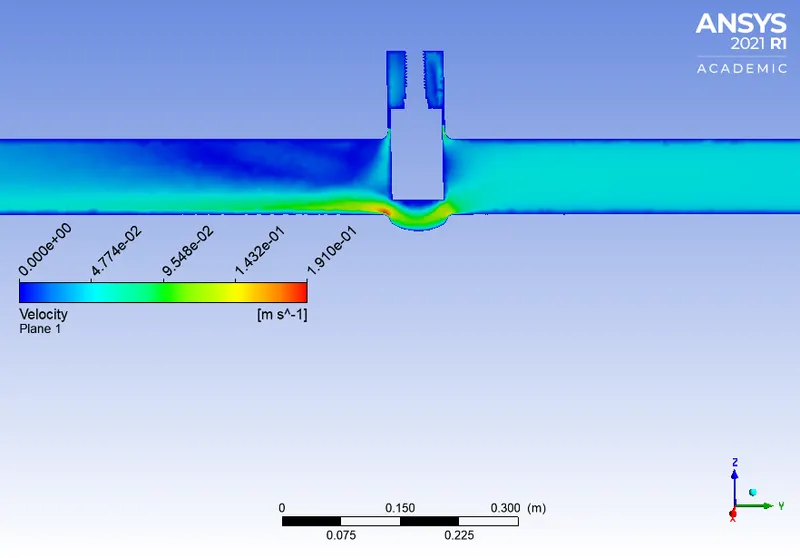
For 30mm opening ,
For 40mm opening ,
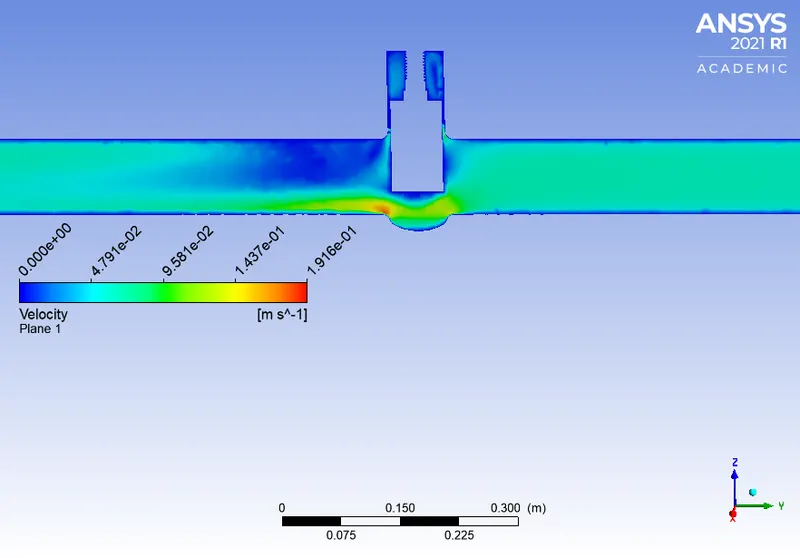
For 50mm opening ,
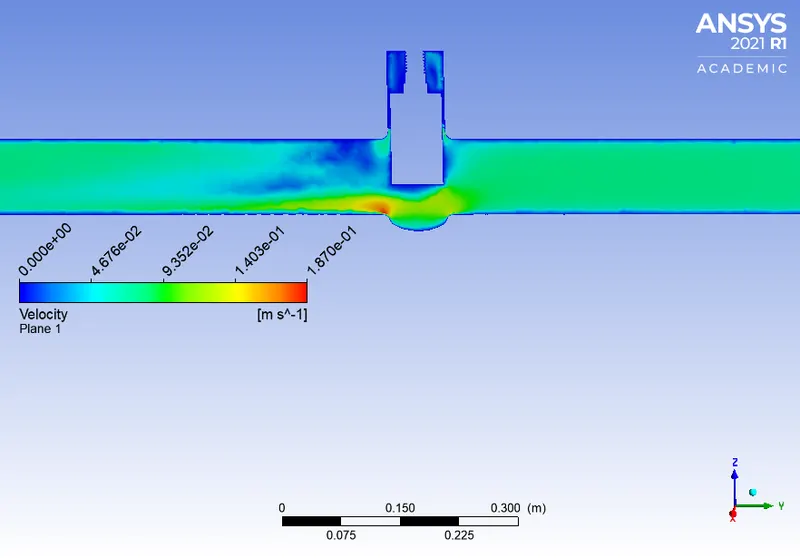
For 60mm opening ,
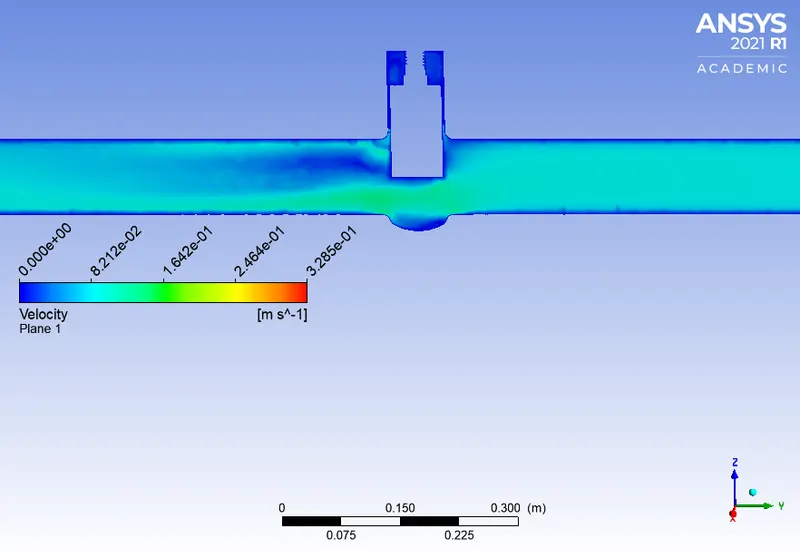
For 70mm opening ,
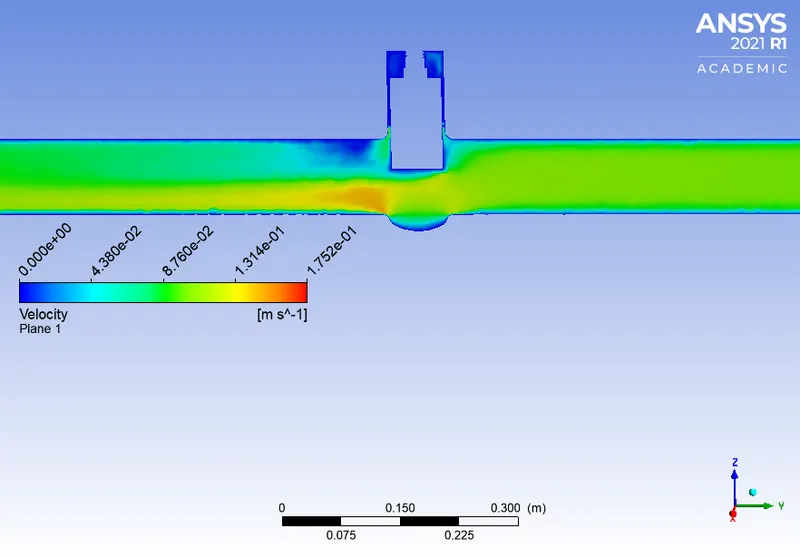
For 80mm opening ,
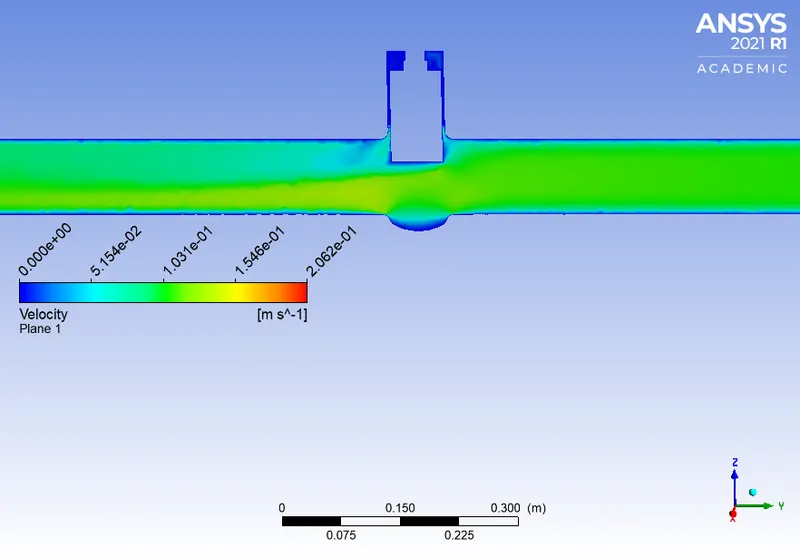
Note :- Fluid flow is from right to left in the contour plots given above.
Tabulation of flow coefficient values at different valve openings,
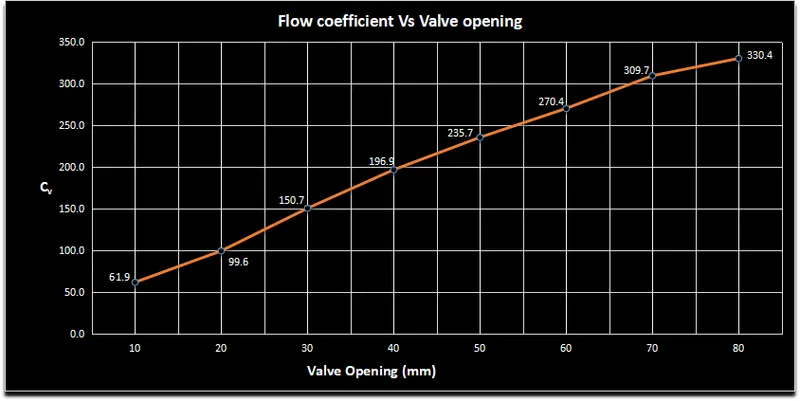
Graph showing the variation of flow coefficient with respect to valve opening,
Tabulation of flow factor values at different valve openings,
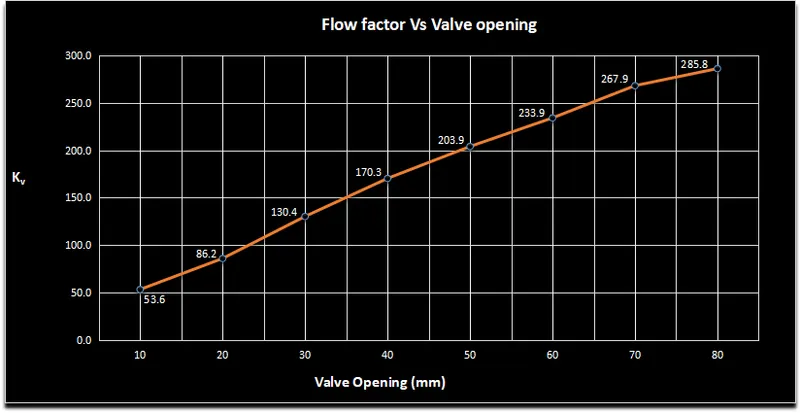
Graph showing the variation of flow factor with respect to valve opening,
CONCLUSION
The parametric study on the gate valve simulation has been done successfully using ANSYS software. The mass flow rate and the flow coefficient for different valve openings has been calculated.
The results of the parametric study shows us the mass flow rate values for corresponding valve opening , from this result it could inferred that the mass flow rate increases as the valve opens up.
The velocity contour plots shows us the flow velocity behaviour as the valve opening changes. It could be seen that the velocity increases and reaches a constant value in the range of 0.1m/s after the valve is opened more than 40mm. Highest velocity at the outlet is attained when the valve opening is at 80mm.
The flow coefficient and flow factor calculated from the mass flow rate values shows us that values of these two increases with increasing flow rate. And from the graphs showing the variation of these two factors with respect to valve opening it could be said that these two factors are directly proportional to the valve opening values. Hence it could be concluded that at higher values of valve opening the efficiency of allowing the fluid flow is also higher.