Week 9 - Parametric study on Gate valve.
For this challenge, you will have to perform a parametric study on the gate valve simulation by setting the opening from 10 % to 80%.
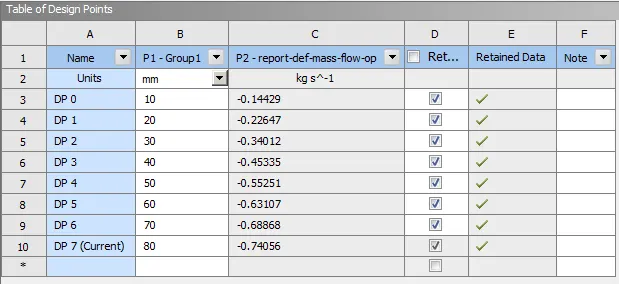
- Obtain the mass flow rates at the outlet for each design point.
- Calculate the flow coefficient and flow factor for each opening and plot the graph.
- Discuss the results of the mass flow rate and flow coefficient.
Answer:
Introduction :-
A gate valve, also known as a sluice valve, is a valve that opens by lifting a barrier (gate) out of the path of the fluid. Gate valves require very little space along the pipe axis and hardly restrict the flow of fluid when the gate is fully opened. The gate faces can be parallel but are most commonly wedge-shaped (in order to be able to apply pressure on the sealing surface).
Uses :-
Gate valves are used to shut off the flow of liquids rather than for flow regulation. When fully open, the typical gate valve has no obstruction in the flow path, resulting in very low flow resistance. The size of the open flow path generally varies in a nonlinear manner as the gate is moved. This means that the flow rate does not change evenly with stem travel. Depending on the construction, a partially open gate can vibrate from the fluid flow
Parametric Study
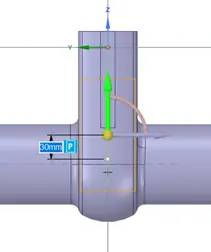
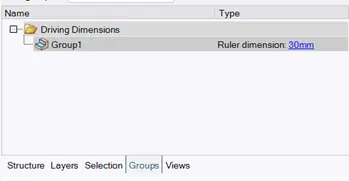
For this challenge we have to perform a parametric study on the gate valve simulation by setting up 5 design points starting from the initial condition of lift with the least value of mass flow rate
Design Points are :
- 10 mm (initial position)
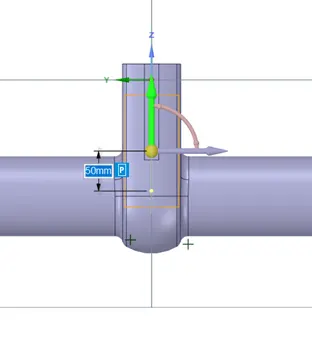
- 20 mm lift
- 30 mm lift
- 40 mm lift
- 50 mm lift
- 60 mm lift
- 70 mm lift
- 80 mm lift
Meshing: Element size = 6 mm common for all cases.
Boundary condition :
Inlet
- Pressure inlet = 10 Pa (Gauge pressure)
Outlet
- Pressure outlet = 0 Pa (Gauge pressure)
Simulation Setup :
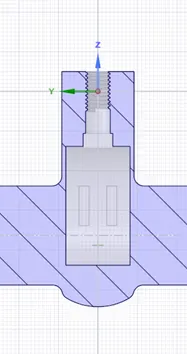
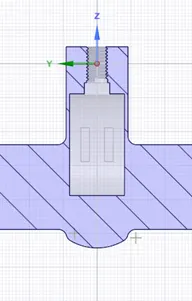
Setting up the physics for Gate valve in ANSYS fluent.
- For this case we are using pressure-based transient solver
- Velocity formulation - Absolute
- Gravity Acceleration
- X-direction = 0 m/s^2
- Y- direction = 0 m/s^2
- Z- direction = -9.81 m/s^2
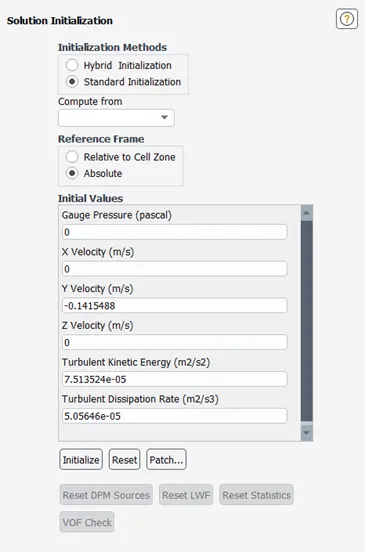
Viscous model :
- model - k-epsilon
- k-epsilon model - Realizable
- Near wall treatment - scalable wall function
Material :
- Water
Boundary condition and simulation setup is same for all the five design points.
Case 1:
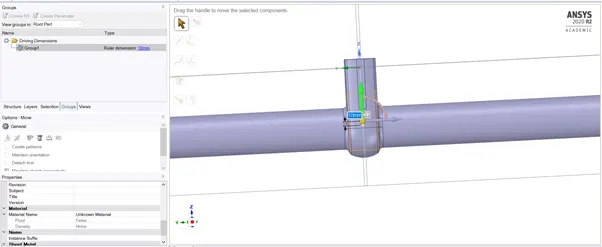
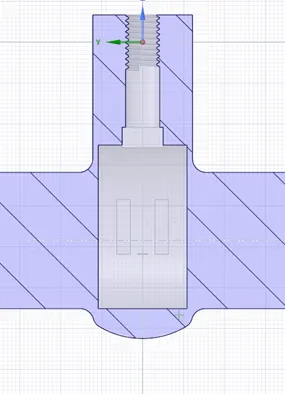
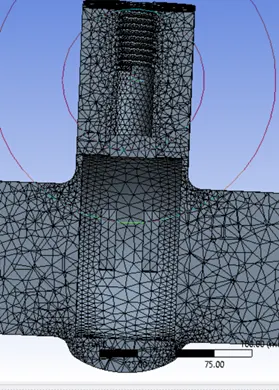
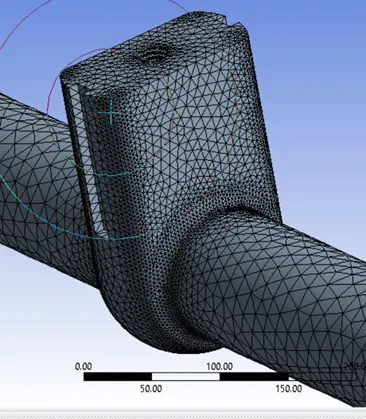
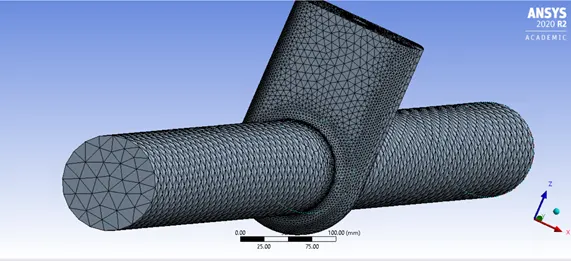
Number of nodes: 29009
Number of elements: 137156
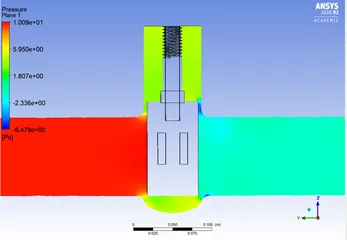
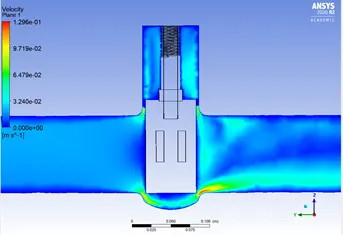
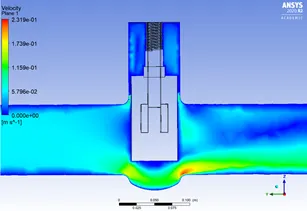
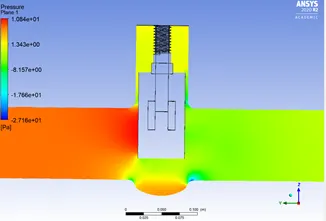
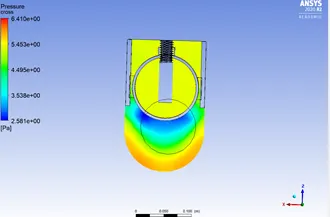
Result Case 1: 10 mm lift condition
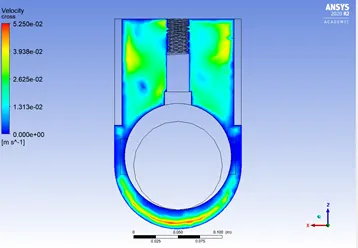
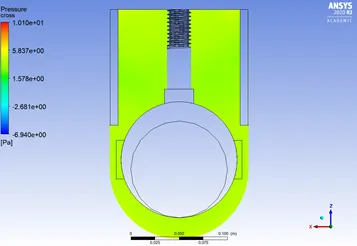
Case 2:
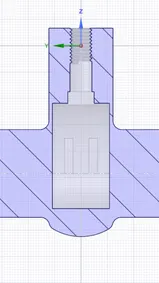
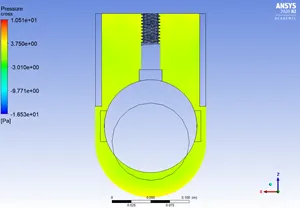
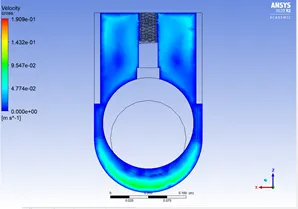
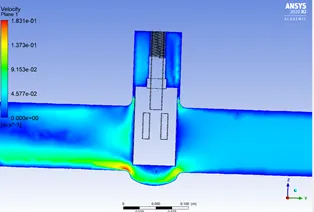
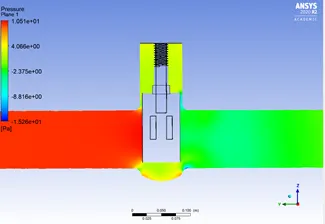
Case 3:
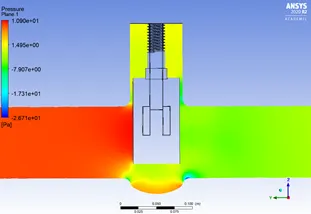
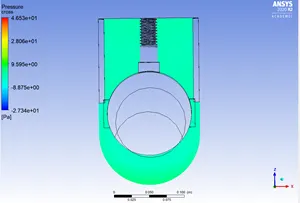
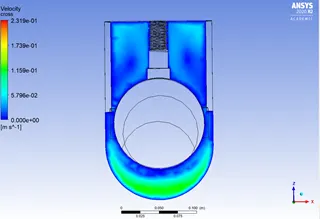
Case 4:
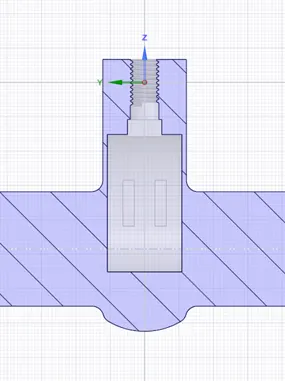
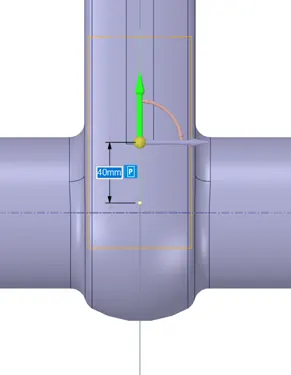
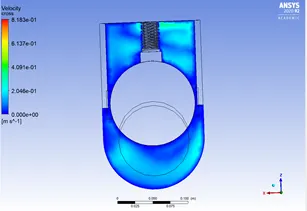
Results:
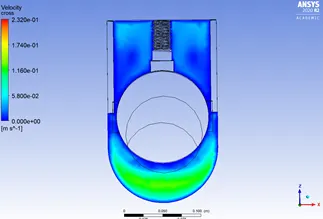
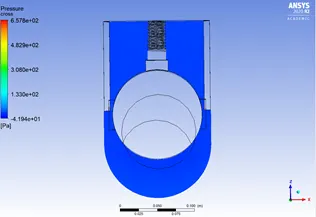
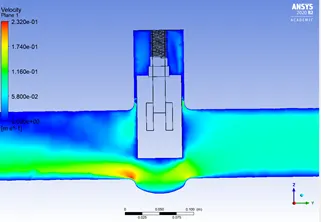
Case 5:
Results
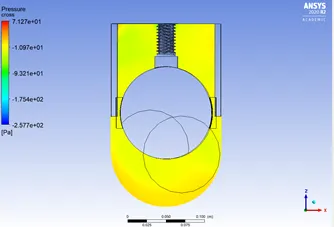
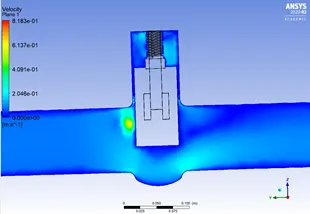
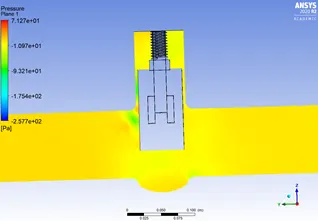
Case 6:
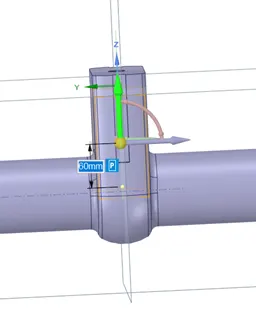
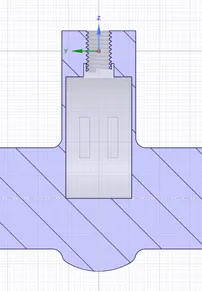
Results:
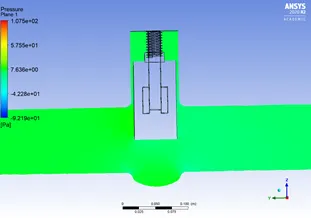
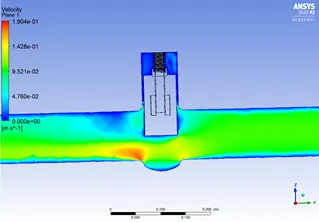
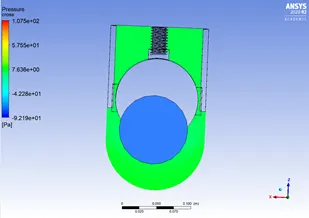
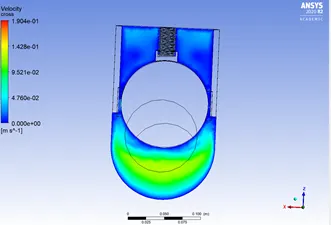
Case 7:
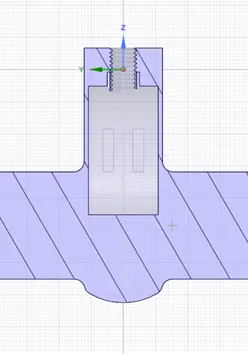
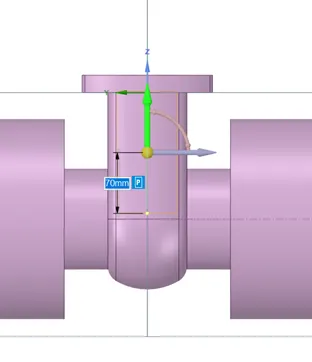
Results:
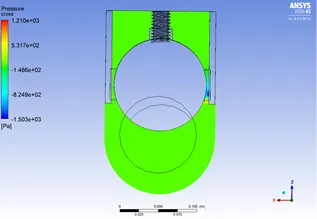
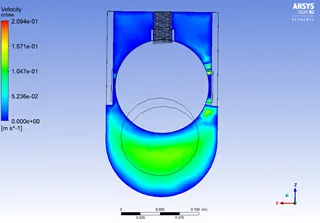
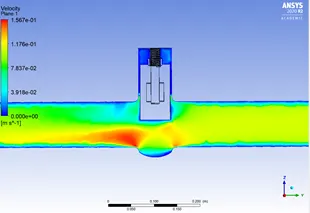
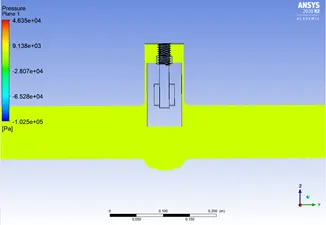
Case 8:
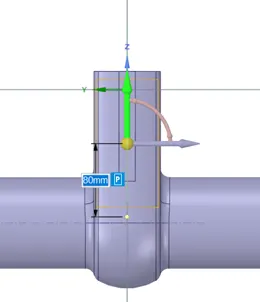
Results:
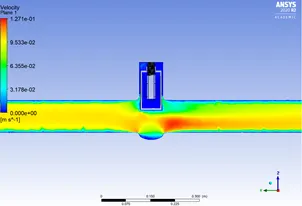
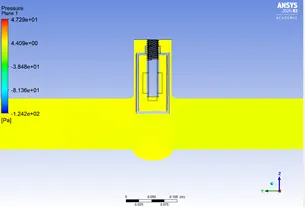
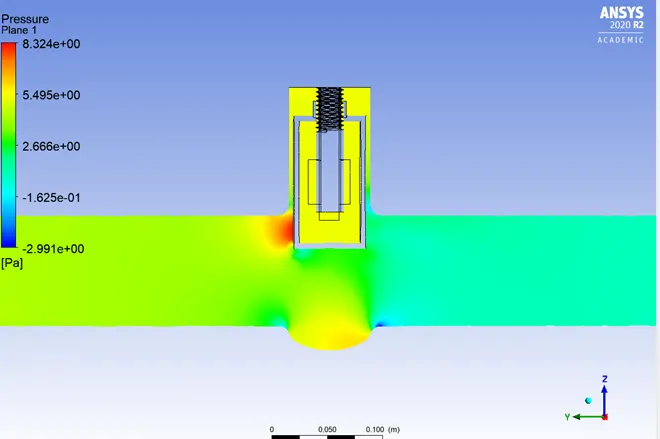
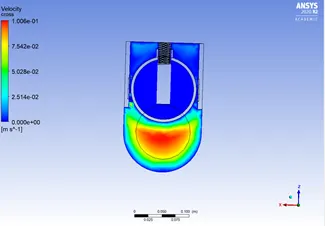
Summary:
Flow-Factor(kv):
Kv is the flow coefficient in metric units. It is defined as the flow rate in cubic meters per hour [m3/h] of water at a temperature of 16º celsius with a pressure drop across the valve of 1 bar. Cv is the flow coefficient in imperial units.
Flow-coefficient(Cv):
The coefficient of flow (Cv) is a formula which is used to determine a valve's flows under various conditions and to select the correct valve for a flow application. The Cv was designed for use with liquid flows, it expresses the flow in gallons per minute of 60º F water with a pressure drop across the valve of 1 psi.
K=Q.√Sg/ΔP
K = Cv , when k is referenced in [gpm] [psi] unit
K = Kv , when k is referenced in [m3/hr] [bar] unit
where Q = mass flow rate
Sg = Specific gravity of water which is equal to 1
DeltaP = Change in pressure or pressure drop across valve
Relation between Kv and Cv:
Cv = Kv*1.156
Tabulated data:
Q obtained is in kg/s so we have to convert it into m3/hr
Q m3/hr = 3.6 * Q kg/s
|
Lift mm |
Pin |
Pout |
Pr drop |
Q m3/hr |
Kv |
Cv |
kg/s |
|
10 |
10 |
0.1493 |
9.851 |
0.519 |
0.166 |
0.191 |
0.144 |
|
20 |
10 |
0.2407 |
9.759 |
0.815 |
0.261 |
0.302 |
0.226 |
|
30 |
10 |
0.3631 |
9.637 |
1.224 |
0.394 |
0.456 |
0.340 |
|
40 |
10 |
0.4743 |
9.526 |
1.632 |
0.529 |
0.611 |
0.453 |
|
50 |
10 |
0.5667 |
9.433 |
1.989 |
0.648 |
0.749 |
0.553 |
|
60 |
10 |
0.6439 |
9.356 |
2.272 |
0.743 |
0.859 |
0.631 |
|
70 |
10 |
0.7117 |
9.288 |
2.479 |
0.813 |
0.940 |
0.689 |
|
80 |
10 |
0.7903 |
9.210 |
2.666 |
0.878 |
1.016 |
0.741 |
Conclusion:
- The negative sign in the mass flow rate term comes due to mass leaving at the outlet.
- Parametric study helps a lot to reduce the solving time in studying the effect of change of parameters on the system.
- From Graphical analysis we can say that, As lift of the gate valve is increased, increase in mass flow rate of fluid is observed and decrease in the level of pressure drop.
- As flow rate is increased, flow factor (Kv) increases as a result of which flow co-efficient (Cv) also increased.