Week 9 Challenge
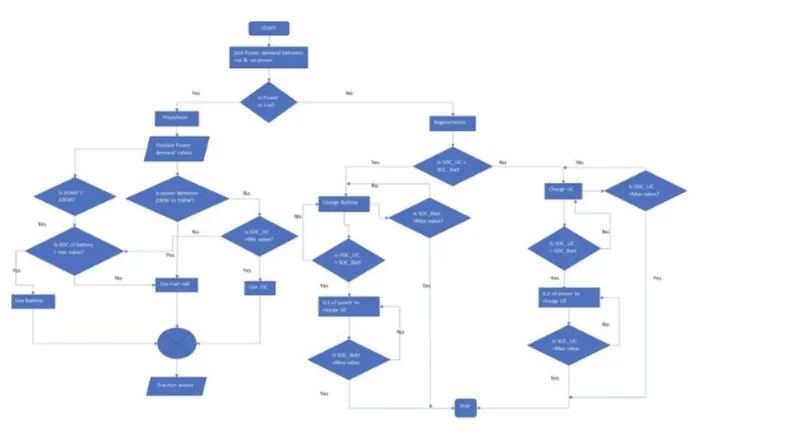
The above Flow Chart shows the flow of Energy Management System (EMS) and it shows how the 3 energy sources are distributing the power that is been required by the vehicle, by which the vehicle will always run on the maximum possible efficiency.
Flow-Chart Process :
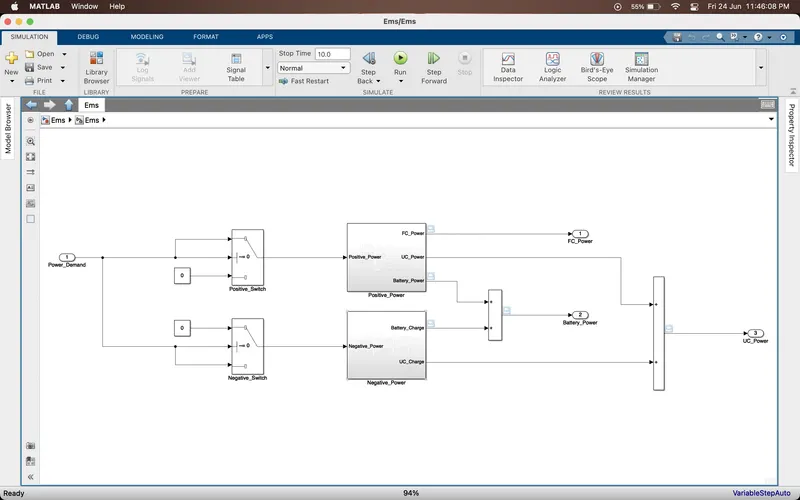
- First it will check whether the power requirement is positive or the negative after separating it will come to know that if the power demand is positive than the vehicle is in demand of the power to propel the vehicle and if the power request is negative it’s in the condition of regeneration.
If it is positive power demand:
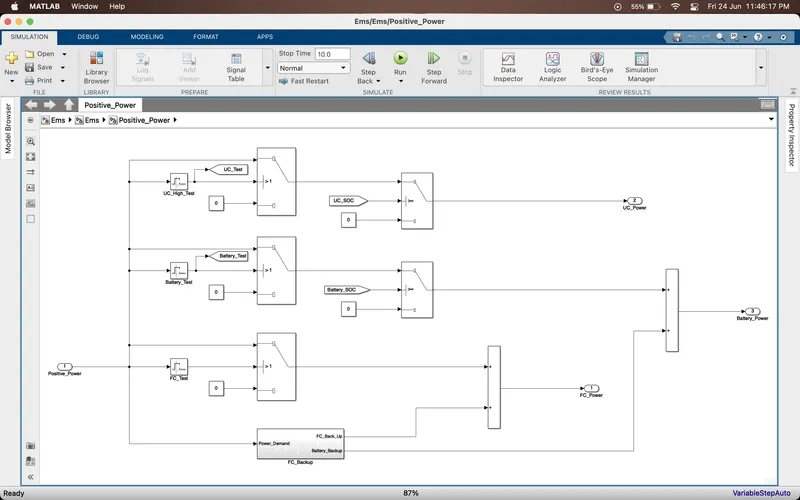
- We will first be checking the power demand from the vehicle if it’s in between 23Kw and 55Kw than the Fuel cell (FC) will be used to supply the power and if it is less than 23kw than the power will be supplied by the battery and if it is greater than 55Kw then UC
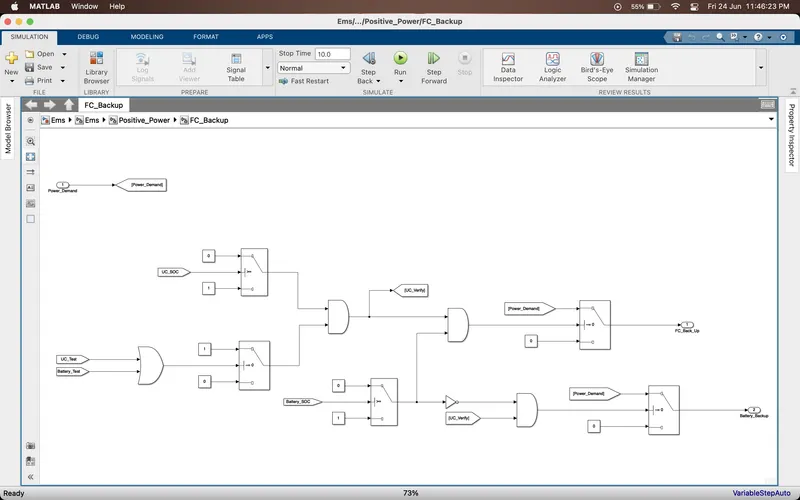
- But before the battery is supplying the power to the vehicle it has to check the SOC of the battery if its high than the min SOC level than only the battery will supply the power or else it will not supply the power.
- And when the SOC of battery is less at that time the power request will be shifted to the FC even if it is required to work in low efficiency region.
- When the power requirement is higher than 55Kw than the UC should supply the power but before this we will check for the SOC of UC here if its higher than minimum SOC level of UC than an than only the UC will supply the power or lese not and then it will shift towards the battery power and in this way there will be the positive power supply flow.
If it is negative power demand :
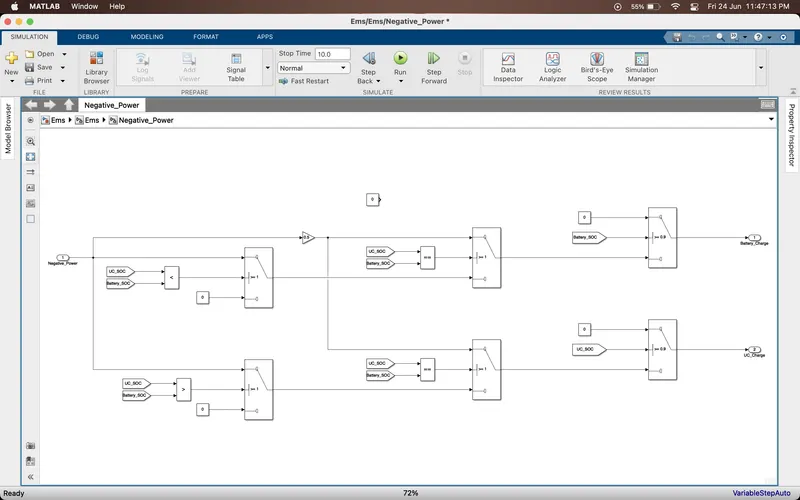
- When it has checked for the negative power request from the vehicle than the next step is that it will check whether the SOC of UC is higher than the SOC of battery if its yes than it will pass the negative power to the battery and at that time it will check the SOC of battery is it below the max SOC of battery
- If yes it will charge the battery and when its greater than the max SOC of battery than it will stop charging the battery.
- And if SOC of UC is less than SOC of battery than it will charge the UC but even at this it will be checking the SOC of UC is less than max SOC limit of UC and if yes it will keep on charging the UC still it’s not equal to the max SOC of the UC.
- After this again in battery, if the SOC of battery and SOC of UC are equal to each other than it will be charging at half the current of the total current that is been supplied, the same applies to the UC.
- If the SOC of UC is equal to SOC of battery than the UC will be charged at half the rate of total current supplied.
- In this way there will be the Energy Flow Management between all the 3 power storage systems.
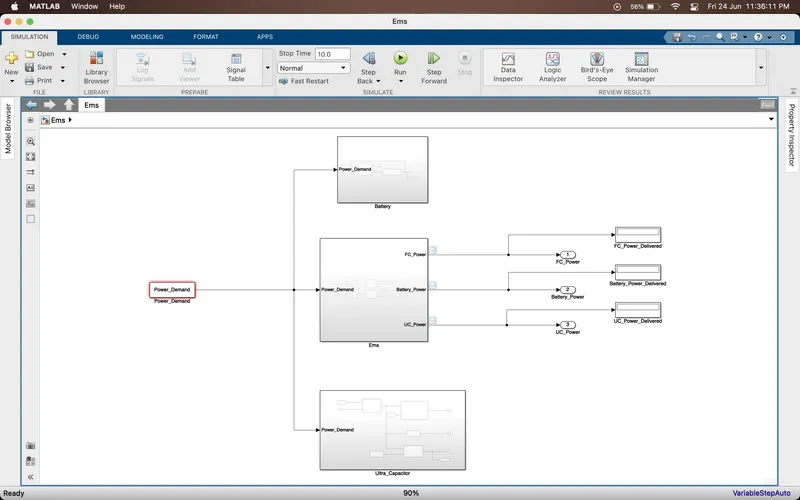
The top view of the model
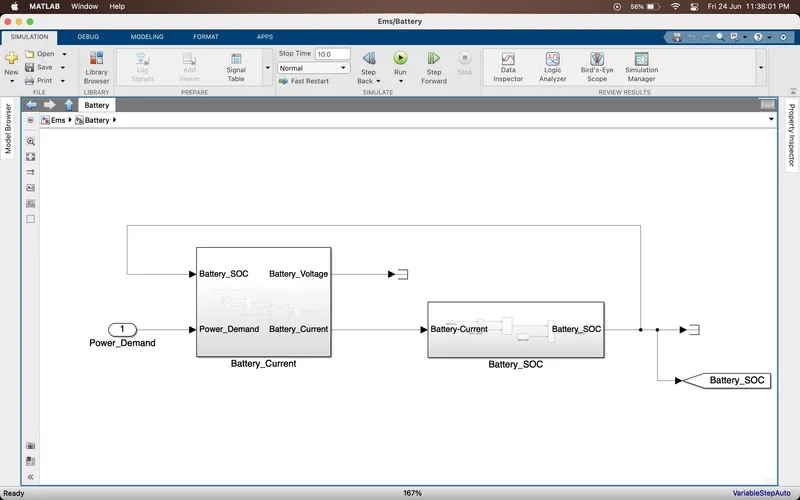
The top view of battery subsytem
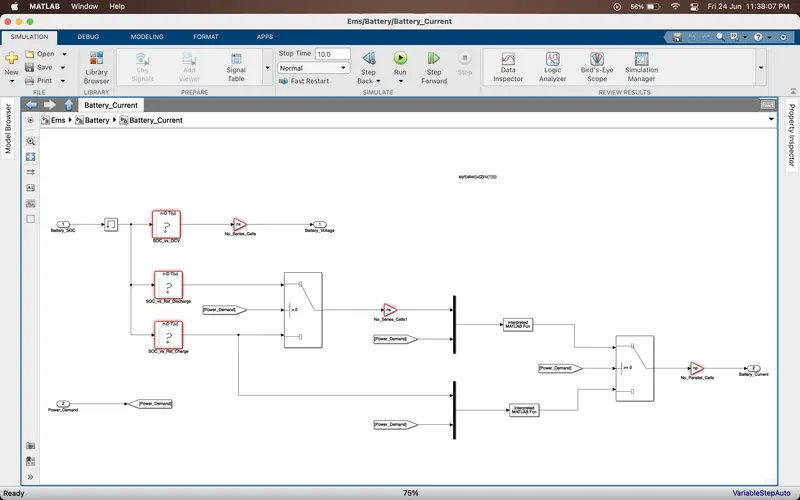
Top view of battery current subsystem
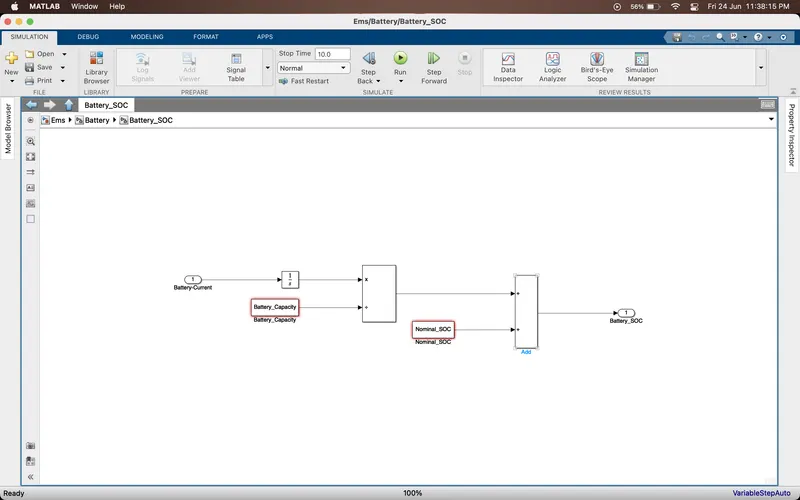
Top view of battery soc subsystem
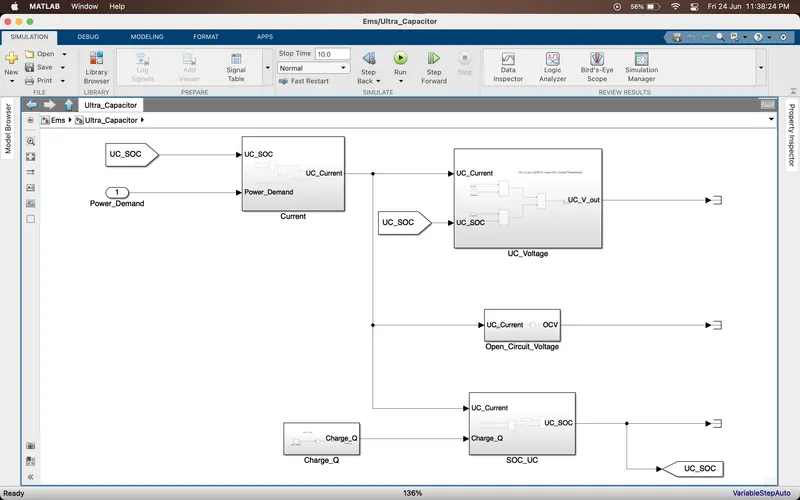
Top view of Ultra-Capacitor subsystem
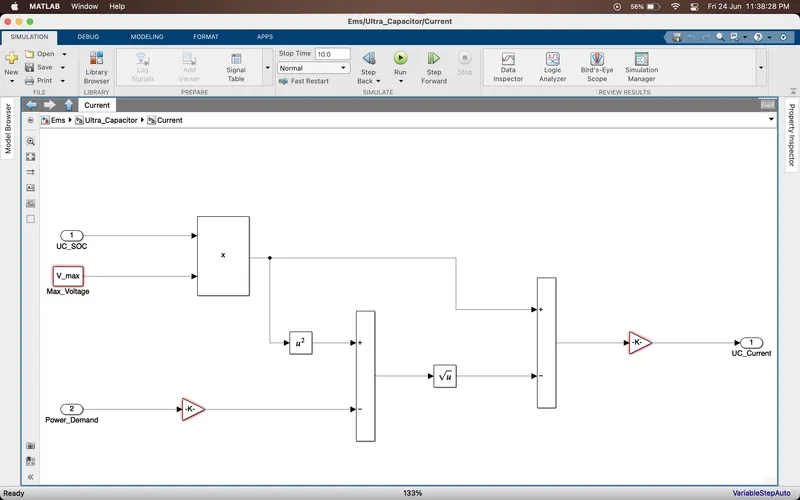
Top view of UC current subsystem
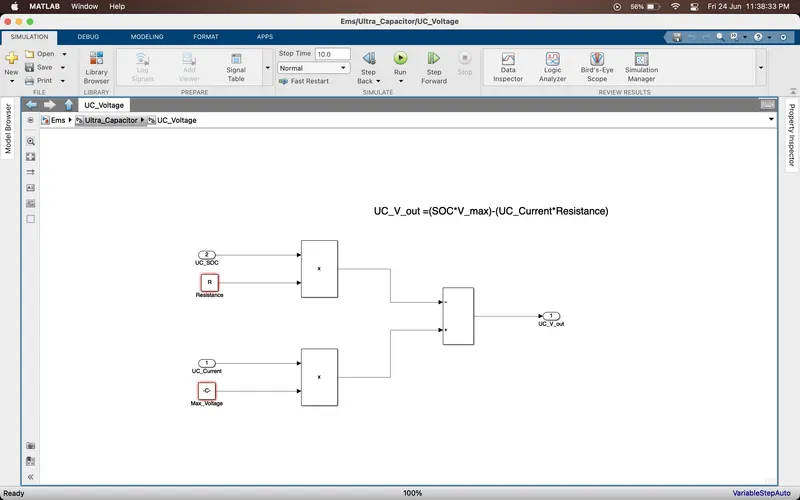
Top view of UC voltage subsystem
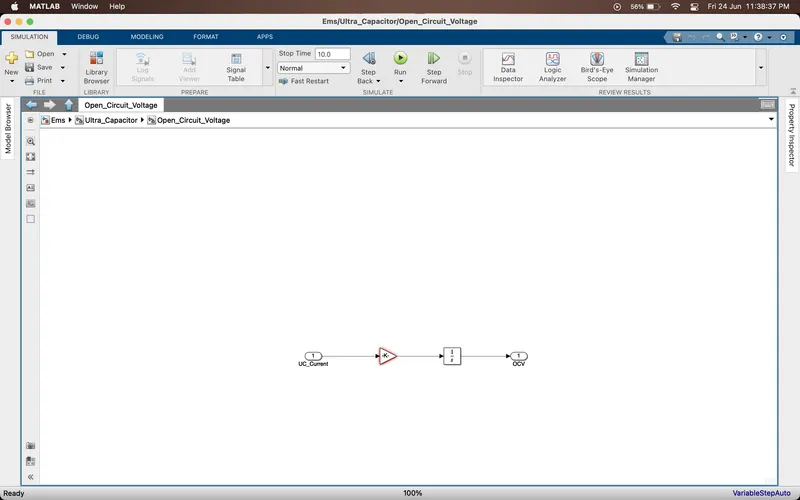
Top view of UC OCV subsystem
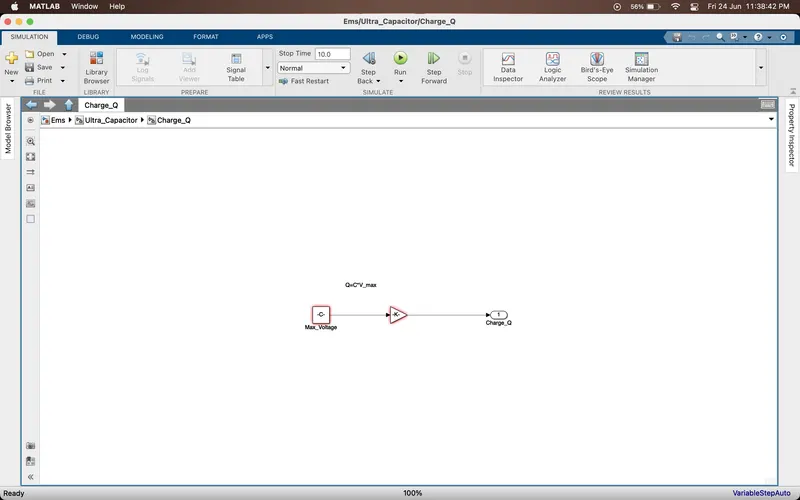
Top view of UC charge subsystem
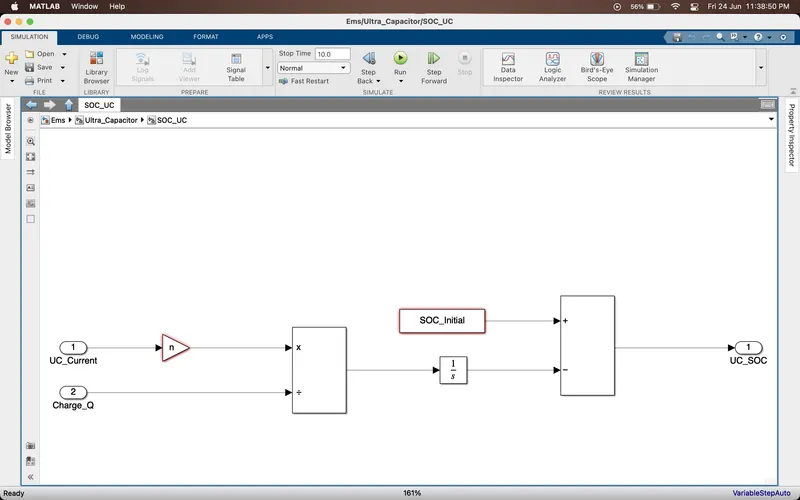
Top view of UC SOC subsystem
Top view of Energy management system
Top view of Positive power subsystem
Top view of FC & battery backup subsystem
Top view of Negative power subsystem
Results :
For Power demand 40 Kw, we can see that FC is delivering the power
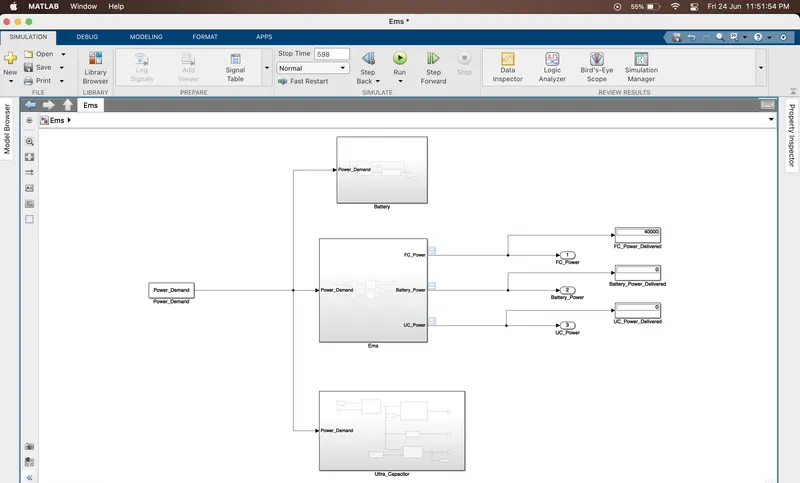
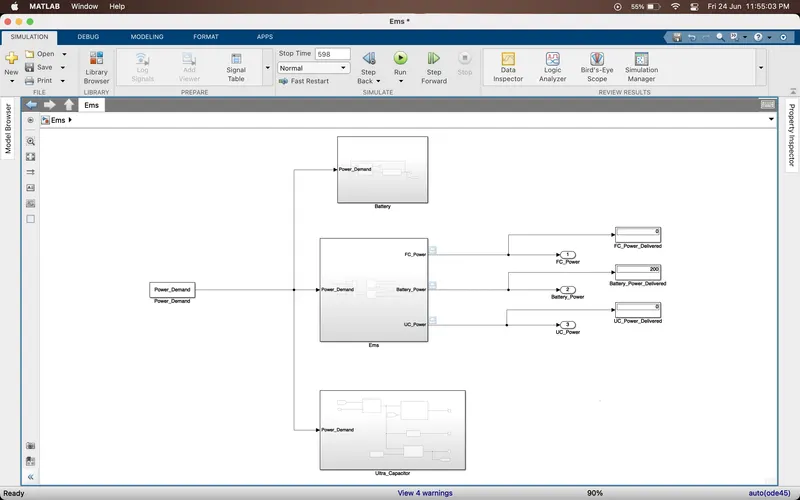
For Power demand 200 w, we can see that Battery is delivering the power
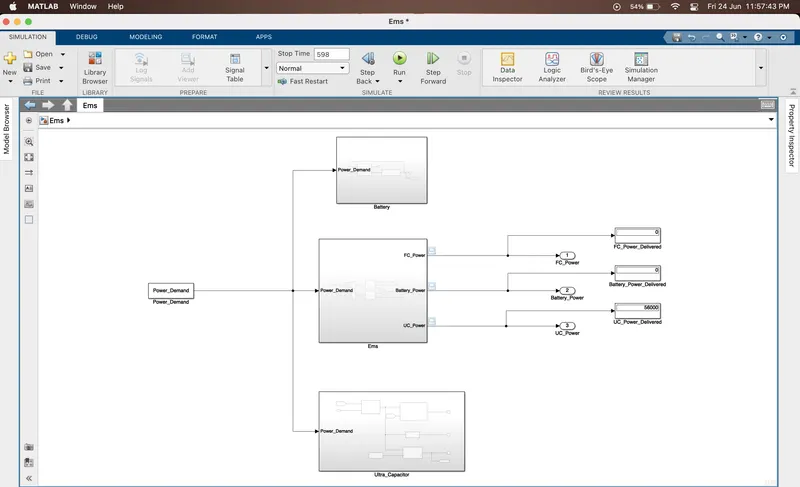
For Power demand 56 Kw, we can see that UC is delivering the power
Note : Model and .mat file for different test is attached in zip file