Project 2 Thermal modeling of battery pack
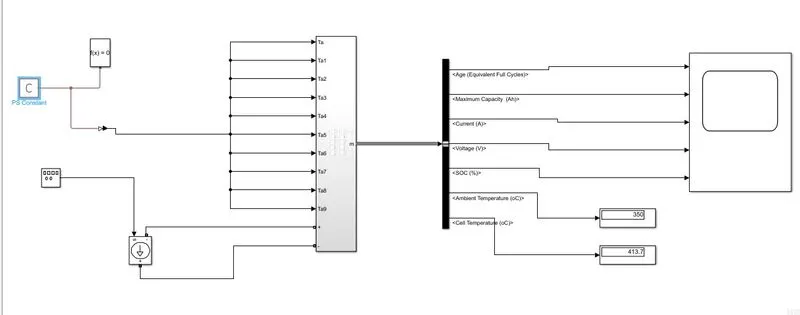
The function blocks used to design the model as per given requirements are as follows:
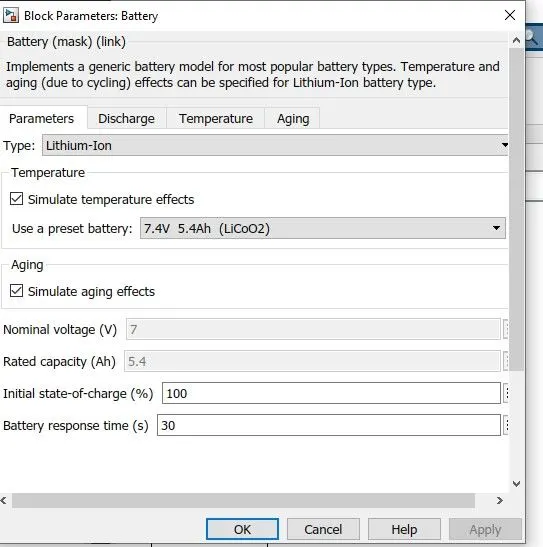
- Battery of 10 numbers and all connected in series
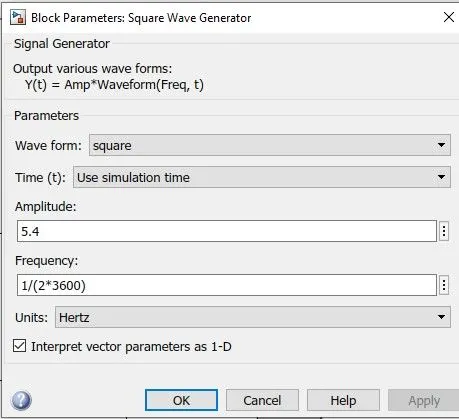
- Square wave generator as input source
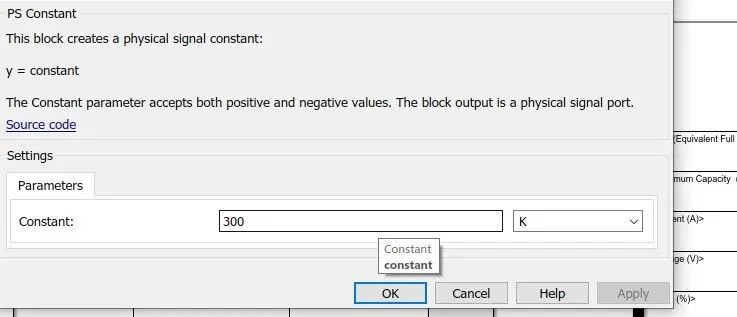
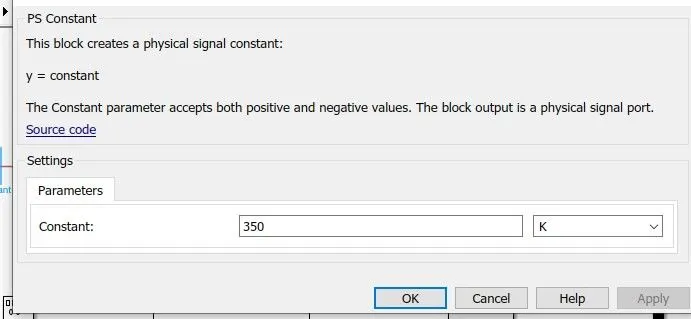
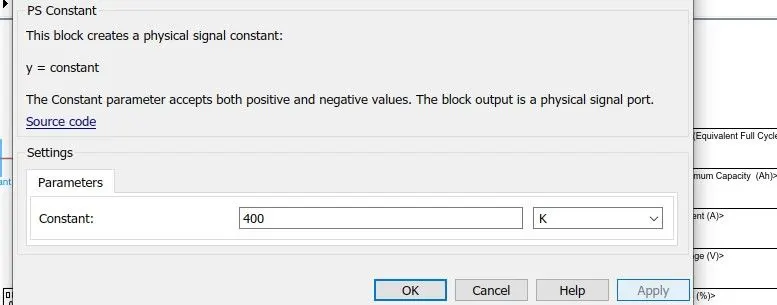
- PS Constant to vary the temperature as input
- Controlled Current Source to control the current
- Bus Selector
- PS Simulink Converter
- Solver Configuration
- Powergui
- Scope
- Display
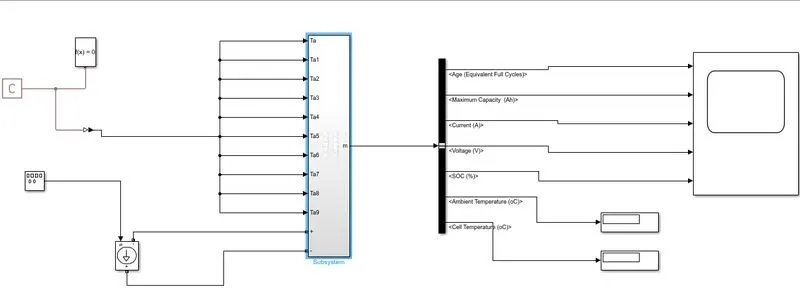
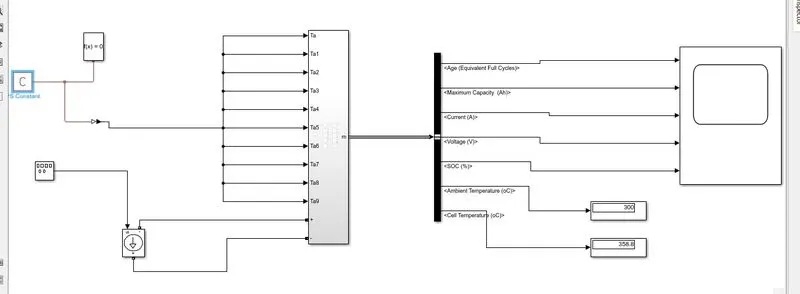
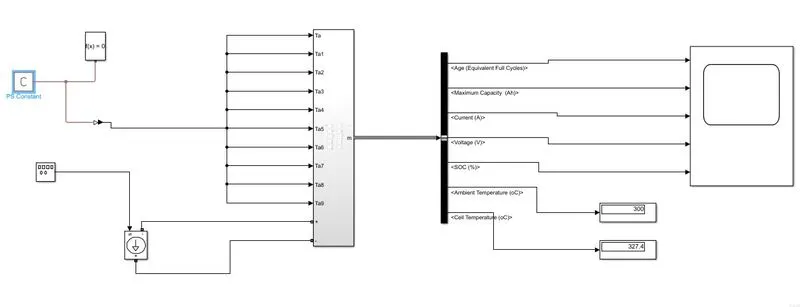
The design model is below and even the file is attached.
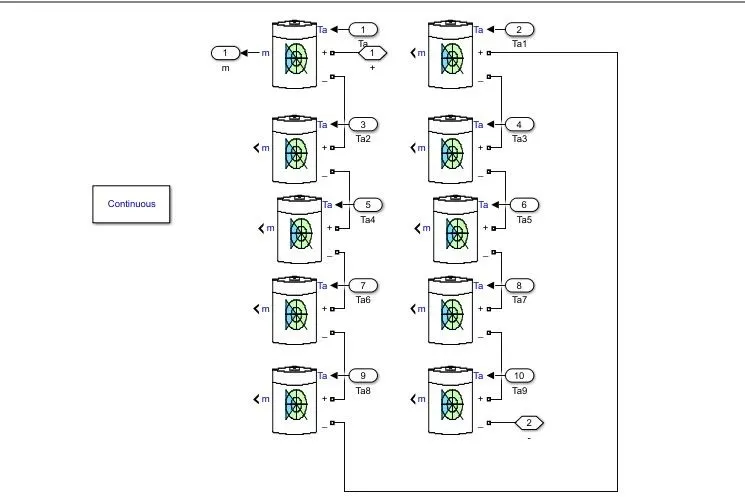
Subsytem : Series connection of 10 cells
The simulation is done for 3600 seconds of 10 cycles with 1C rate
During 300 K
Scope Output:
Results:
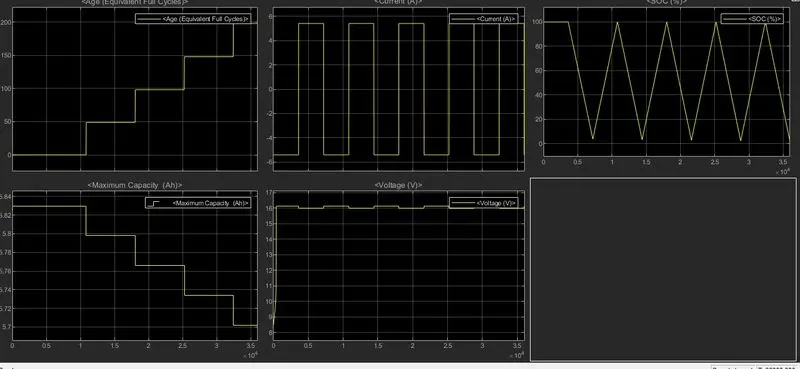
- Plot 1, it shows the life cycle of battery pack i.e., its around 200
- Plot 2, we can see that the current is fluctuating between +5.5 A and -5.5 A, its indicates the discharging and charging states of the battery
- Plot 3, shows the SOC, initially the battery is fully charged and discharged almost to 5% and again its starts charging up to 100 depending on the input given
- Plot 4 shows the maximum capacity of the battery, we can see that there is fall in capacity and its almost 5.7 Ah
- Plot 5 shows the voltage of the battery and its around 16 V we can there is slight fall in the voltage during discharging
- In the display we can see that the ambient temperature we have given is 300K but the cell temperature is 358.8K which is around 1.19% increase of ambient temperature
During 350K
Scope Output:
Results:
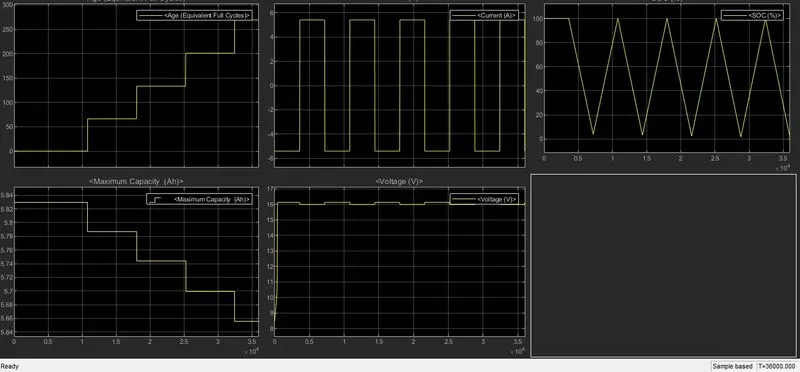
- Plot 1, it shows the life cycle of battery pack i.e., its above 250 cycles
- Plot 2, we can see that the current is fluctuating between +5.5 A and -5.5 A, its indicates the discharging and charging states of the battery
- Plot 3, shows the SOC, initially the battery is fully charged and discharged almost to 5% and again its starts charging up to 100 depending on the input given
- Plot 4 shows the maximum capacity of the battery, we can see that there is fall in capacity and its almost 5.65 Ah
- Plot 5 shows the voltage of the battery and its around 16 V we can there is slight fall in the voltage during discharging
- In the display we can see that the ambient temperature we have given is 350K but the cell temperature is 413.7K which is around 1.18% increase of ambient temperature
During 400K
Scope Output:
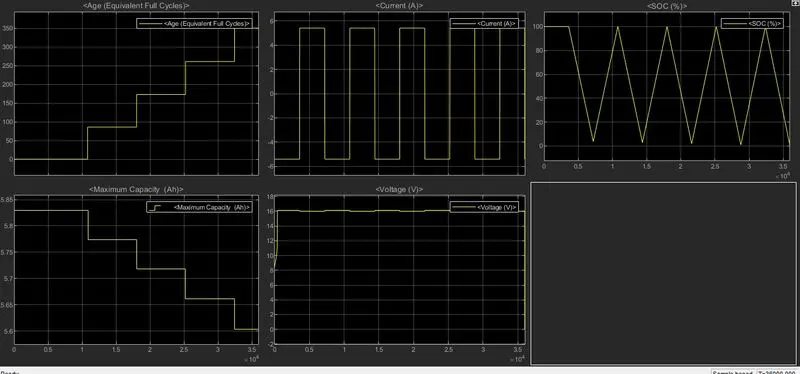
Results:
- Plot 1, it shows the life cycle of battery pack i.e., its around 350
- Plot 2, we can see that the current is fluctuating between +5.5 A and -5.5 A, its indicates the discharging and charging states of the battery
- Plot 3, shows the SOC, initially the battery is fully charged and discharged almost to 5% and again its starts charging up to 100 depending on the input given
- Plot 4 shows the maximum capacity of the battery, we can see that there is fall in capacity and its almost 5.60 Ah
- Plot 5 shows the voltage of the battery and its around 16 V we can there is slight fall in the voltage during discharging
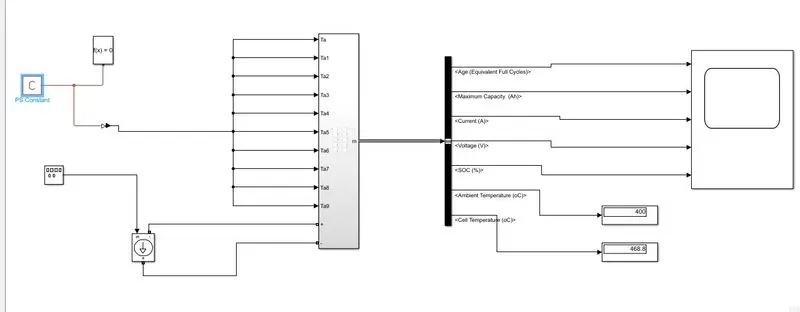
- In the display we can see that the ambient temperature we have given is 400K but the cell temperature is 468.8K which is around 1.17% increase of ambient temperature
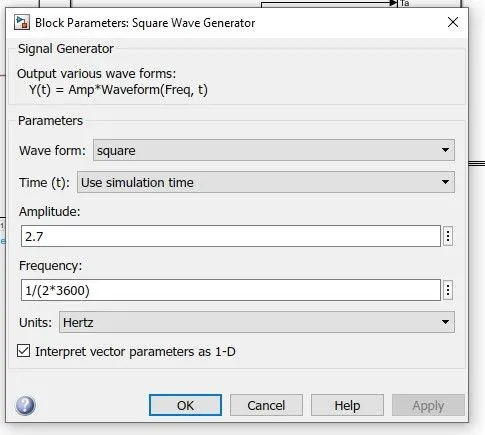
The simulation is done for 3600 seconds of 10 cycles with 0.5C rate
During 300 K
Scope Output:
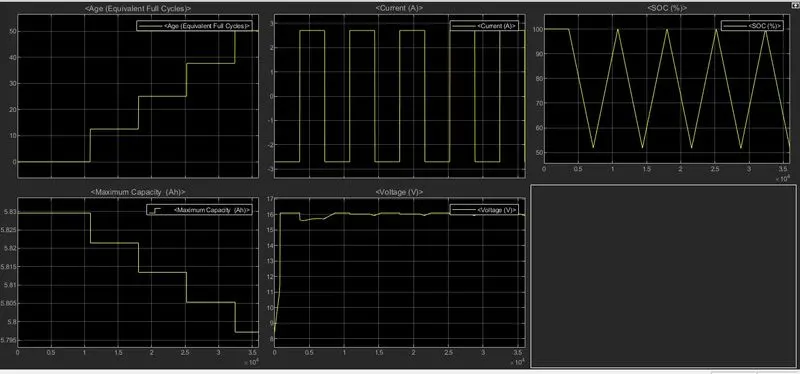
Results:
- Plot 1, it shows the life cycle of battery pack i.e., its around 50 cycles
- Plot 2, we can see that the current is fluctuating between +2.7 A and -2.7 A, its indicates the discharging and charging states of the battery
- Plot 3, shows the SOC, initially the battery is fully charged and discharged almost to 50% and again its starts charging up to 100 depending on the input given
- Plot 4 shows the maximum capacity of the battery, we can see that there is fall in capacity and its almost 5.79 Ah
- Plot 5 shows the voltage of the battery and its around 16 V we can there is slight fall in the voltage during discharging
- In the display we can see that the ambient temperature we have given is 300K but the cell temperature is 327.4 K which is around 1.09% increase of ambient temperature
During 350K
Scope Output:
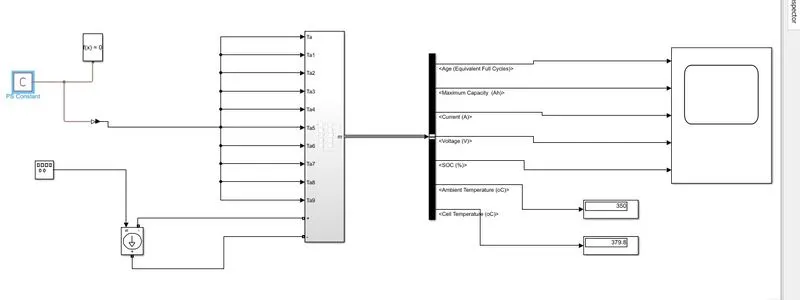
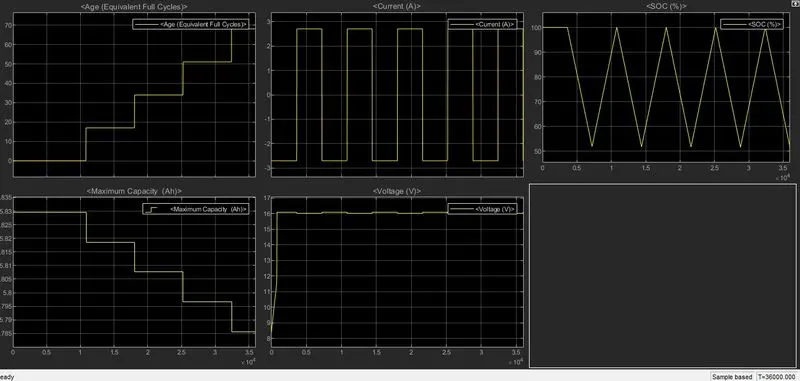
Results:
- Plot 1, it shows the life cycle of battery pack i.e., its above 65 cycles
- Plot 2, we can see that the current is fluctuating between +2.7 A and -2.7 A, its indicates the discharging and charging states of the battery
- Plot 3, shows the SOC, initially the battery is fully charged and discharged almost to 50% and again its starts charging up to 100 depending on the input given
- Plot 4 shows the maximum capacity of the battery, we can see that there is fall in capacity and its almost 5.78 Ah
- Plot 5 shows the voltage of the battery and its around 16 V we can there is slight fall in the voltage during discharging
- In the display we can see that the ambient temperature we have given is 350K but the cell temperature is 379.8K which is around 1.08% increase of ambient temperature
During 400K
Scope Output:
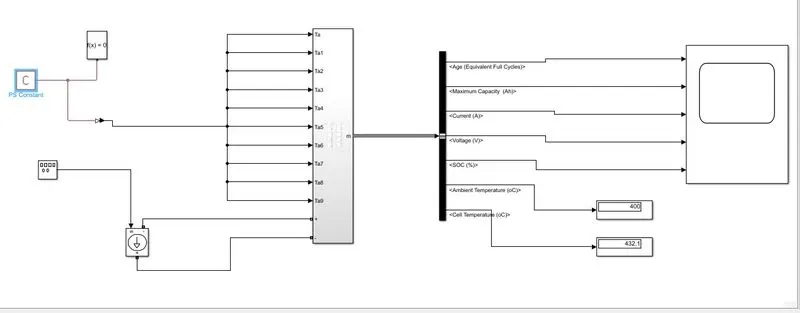
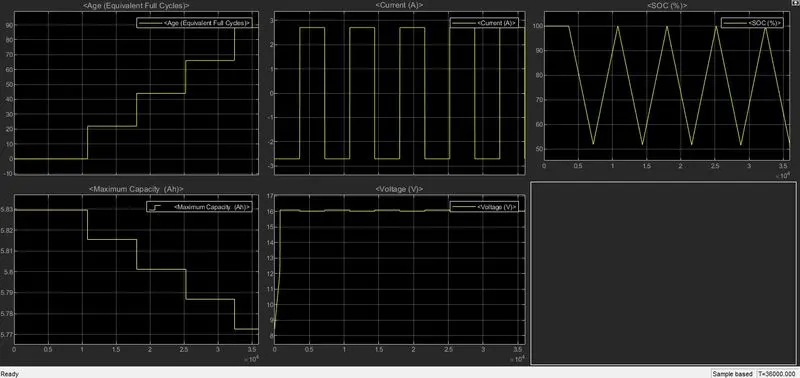
Results:
- Plot 1, it shows the life cycle of battery pack i.e., its around 90
- Plot 2, we can see that the current is fluctuating between +2.7 A and -2.7 A, its indicates the discharging and charging states of the battery
- Plot 3, shows the SOC, initially the battery is fully charged and discharged almost to 50% and again its starts charging up to 100 depending on the input given
- Plot 4 shows the maximum capacity of the battery, we can see that there is fall in capacity and its around 5.77 Ah
- Plot 5 shows the voltage of the battery and its around 16 V we can there is slight fall in the voltage during discharging
- In the display we can see that the ambient temperature we have given is 400K but the cell temperature is 432.1K which is around 1.08% increase of ambient temperature
Conclusion: As per my simulation model
- The rise in temperature increases the life cycles of the battery pack in both the cases
- Maximum Capacity falls down slightly and slowly depending on the rise in temperature in both the cases
- Voltage remains almost same in both the cases
- The Current varies between positive and negative as per the C rate respectively
- There is around 1-1.2% increase in the cell temperature when compared to the ambient temperature
- During 1C rate the SOC is nearby zero but during 0.5C rate it is almost to 50%.