Week 7 State of charge estimation
EV BATCH 17
AIM:
To Simulate the 3 test cases from harness dashboard and write a detailed report on the results.
EXPLANATION:
- The file chan be downloaded through the above link.
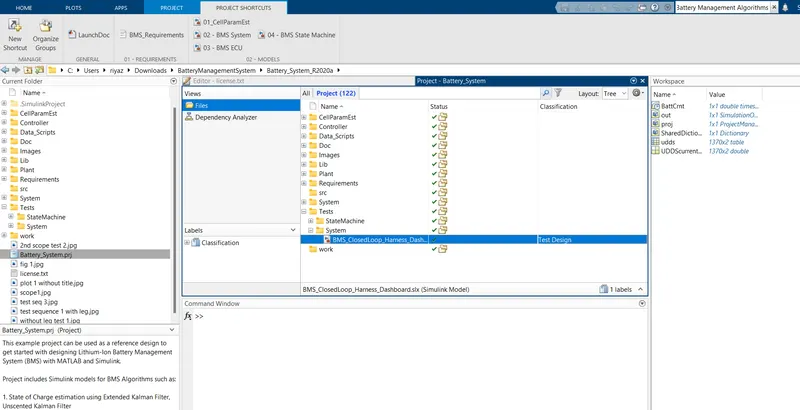
- select the path in the matlab and open the battery management system(BMS)
- inside the file open the BMS open the closed loop system of the battery pack.
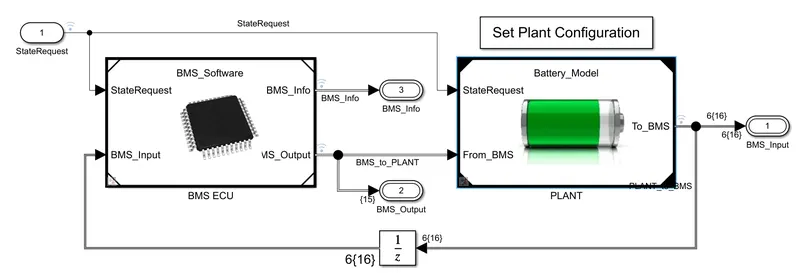
- The below figure represent the closed loop system inside the bms
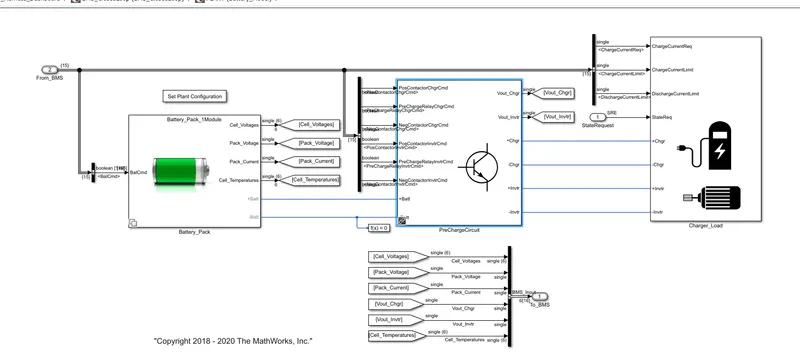
- The plant contains the battery pack,precharge circuit and charge load.that should be shower in below figure.
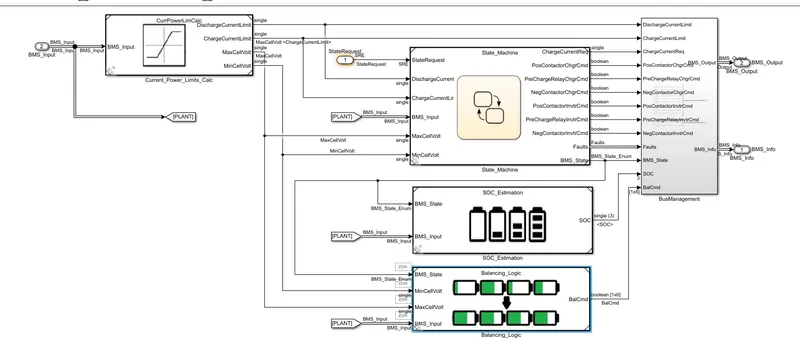
- BMS ECE (battery management system controlled unit contains state machine with the state flow,state of charge estimation subsystem and balancing logic subsystem finally connects with the battery management system.
- The state machine is created by the state flow chart.
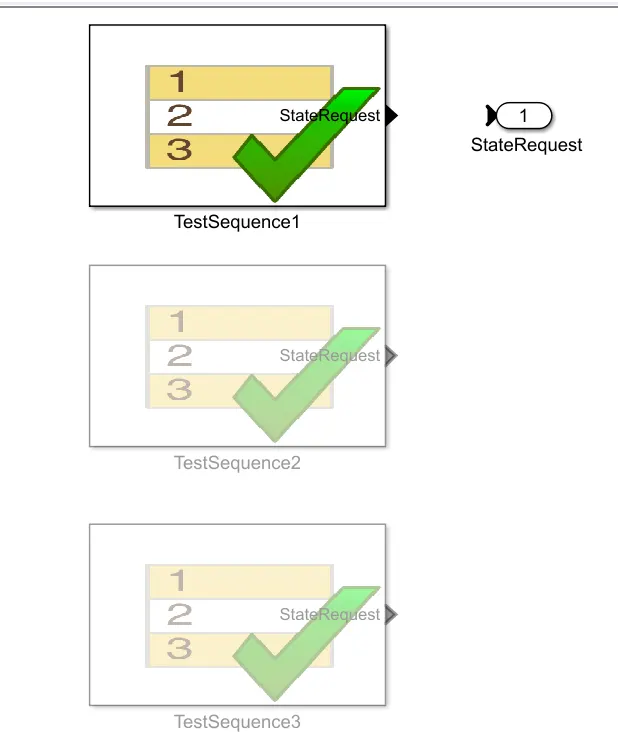
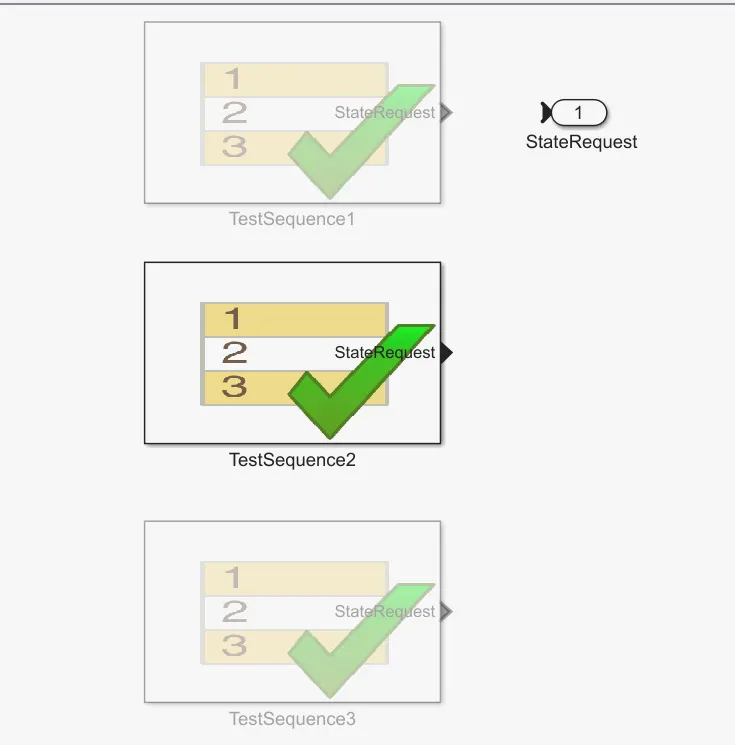
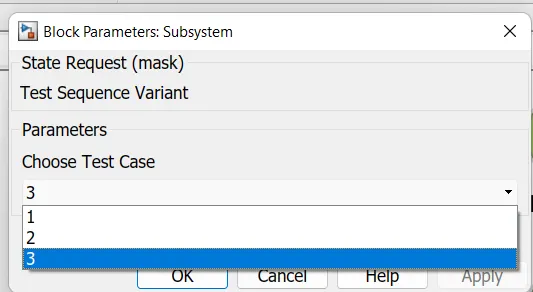
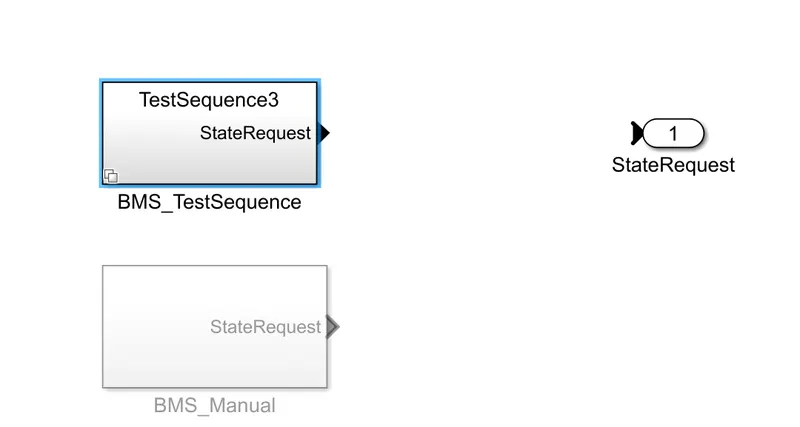
- The test sequence can be selected by using the subsytem of the test sequence varient.
- The active test sequence is mentioned in given below.
- test1 is vehicle in idle,driving and recharging state.
- other 2 tests are only driving condition and only charging condition.
The below figure represents the hardness test dashboard it contains the test sequence in the manual variant which means we selecting maually.
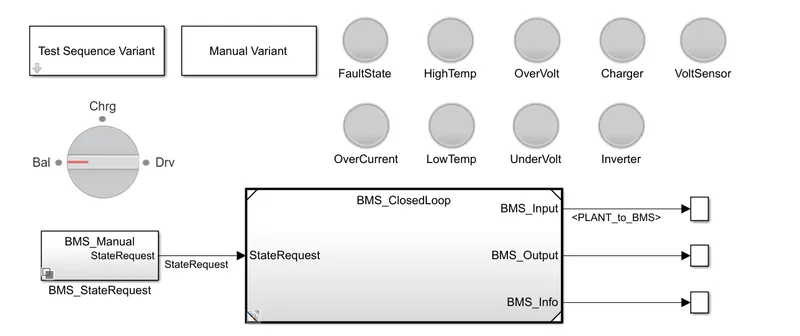
- The rotary switch should be balanced state other states are charging and drive state.
- other subsystems are bams state request and bms cloosed loop system.
- after selecting the testing sequence running the simulation by using the run option.
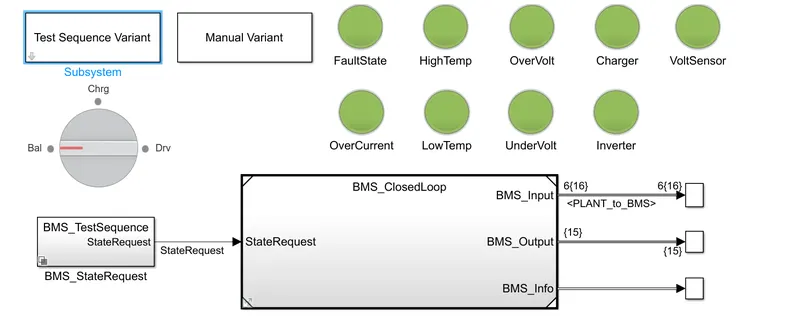
- There is no faults in the system all the lamp are in green after the simulation.
- The below figure represents the no fault state.
Plots:
The below plot repsents the cell-voltages of the BMS,cell temperatures,State of charge,pack current,BMS state,ballance command.
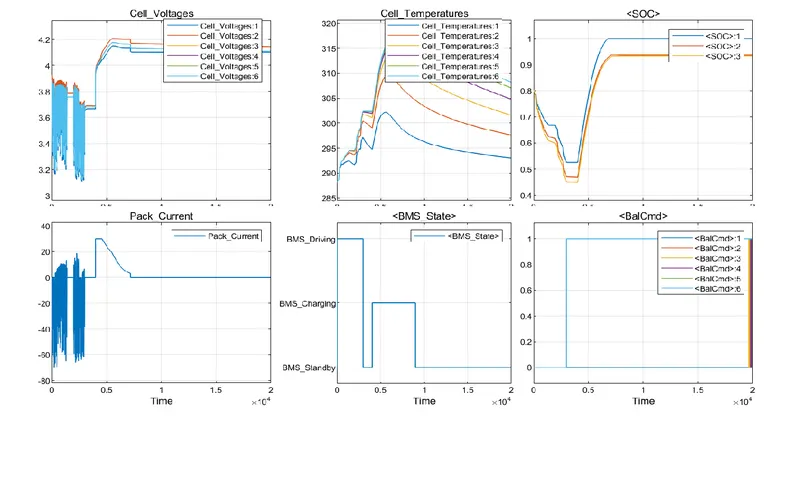
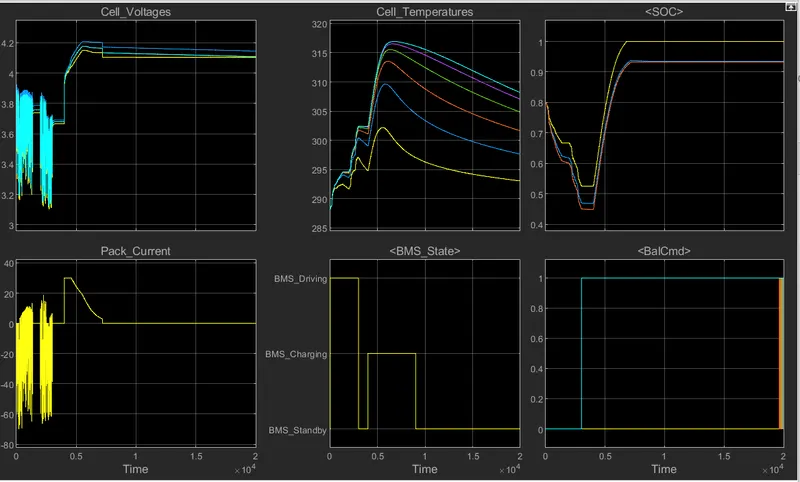
- The cell voltage 1 is blue color that having the high voltage of approximately 3.9 and minimum voltage of 3.2,other cells also having the same voltages with respect to time,but slightly differs with 0.01v,the plot contains 5 cells voltages each cell will be plot will each colors.cell voltage 2 contains the orange,yellow is the voltage3,violet is the cell4,green is cell 5,dark blue is cell6.
- the plot is represents the cell temperatures ,the temperature is minimum of approximately 290k and maximum of 318k.other cells having the same slight difference in the temperature,here the cell 1 will be the lowest temperature of approximately 303k,other cells are cell 2 contains 310k,cell3 contains 313k,cell4 has the maximum of 316k,cell5 is 315k,cells6 of 317k.the temperature increasing will be based on the usage of the cell,cell temperature is reduced by under idle condition or by thermal management system.
- The 3rd plot is represent the state of charge,soc is reduced during travelling and it will be increased by recharging the cells,all the three lines are similar in the plot.here 80% of maximum reduced to 45% after it will get recharge.
- The 4th plot is represent the pack current For EV BMS battery pack current measurements, shunts range anywhere from 25 µΩ to 100 µΩ. Understanding ADC requirements in BMSs One of the most established ways to accomplish highly accurate shunt-based current measurements with a wide dynamic range is to use a high-resolution delta-sigma (ΔΣ) ADC.the pack current should moves -60 to +30.
- 5th plot is the battery management system which is idle condition of vehicle,driving condition,charging conditions are plotted in the above figure.under idle condtion the 0 and the driving condition the battery power s are reduced because of travelling,battery drained recharging the battery.
- the sequence is observed by using the drive cycle with the scope.change the test sequence and observe again.
TEST SEQUENCE:2
The test 2 is now active
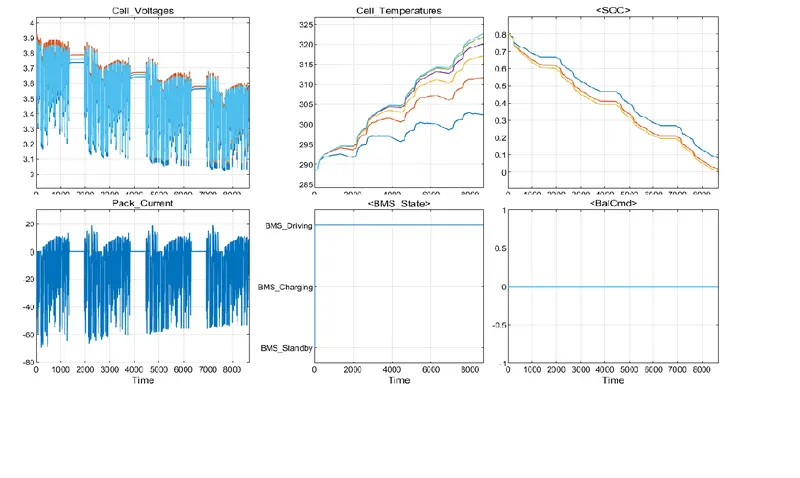
- The below plots represents the test sequence 2.in this condition the vehicle is driving condition ,so the soc will be reduced 80% to 0%,cell voltage will be dropped and regenerated again dropped are observed in the plot1,temperature is continously increasing under the driving condition.
- the driving state is observed in the plot5 which is the bms state cell.
- voltages are balanced it canbe observed by plot 6 which is constant with respect to time. pack cuurent will be observed in plot 4.
- The voltage and current vary based on the driving condition.
Test sequence 3:test sequence 3 is the charging condition.which should be observed by using the scope.
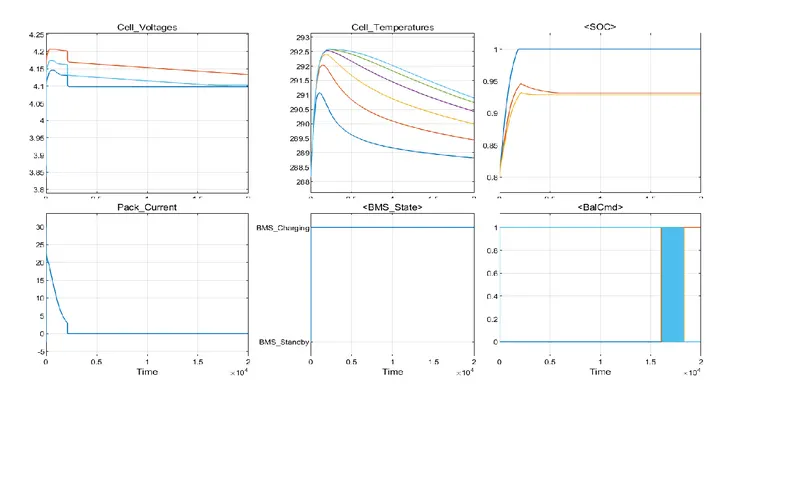
- The below plots represents the test sequence 3,which is the voltage and current should constant in the charging condition.
- if the voltage and current chould be high the battery gets degrated and life of the battery gets reduced.
- so we are using the constant voltage and constant current in the charging.
- the temperature is reduced slowly during charging and the state of charge gets rise rapidly to fully charged state .
- all the bms state are also constant every process should be constant in the battery.
What is coulomb counting? Refer to the above model and explain how BMS implements coulomb counting for SOC estimation ?
- Coulomb counting is a technique used to track the State of Charge of a battery pack. It works by integrating the active flowing current (measured in amps) over time to derive the total sum of energy entering or leaving the battery pack. This produces a capacity that is typically measured in Amp-hours.
-
Mathematically integrated over the time formula to calculate estimated SOC by coulomb Counting is as below:
SoCt=SoCt-1+Ic(t)Qnt
Ic(t) ⇛Discharging Current at Time t
SoCt ⇛Estimated SoC at Time t
SoCt-1 ⇛Previously Estimated SoC at t-1 or SoC value Given by Manufacturer
Qn ⇛full battery capacity charges
△t ⇛Difference in timeIt is one of the most used methods, However many other factors like temperature, application of battery, life Cycle of battery, fluctuation of battery voltage, etc, need to be considered along with the coulomb counting method to make a more accurate SoC calculation.
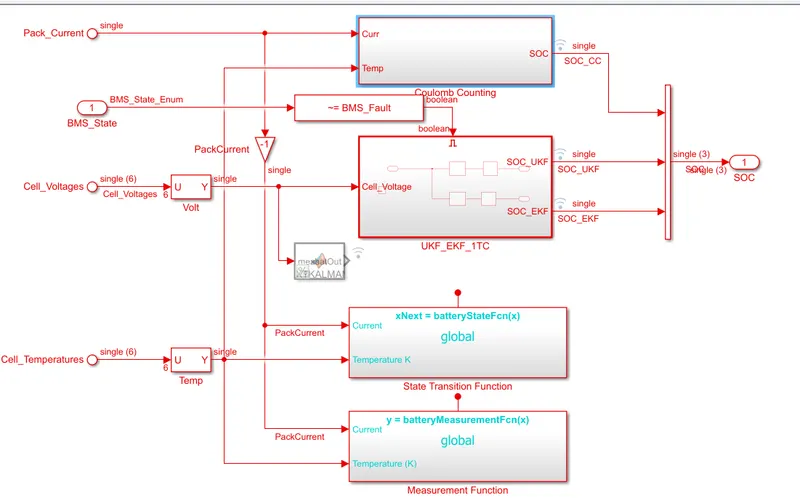
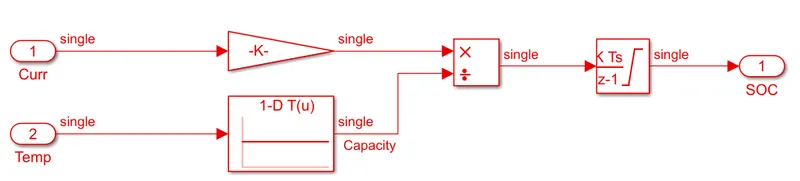
- The input of the coulomb counting should be taken from the pack current and temperature at kelvin.
- The formula of coulomb counting is SoCt=SoCt-1+Ic(t)Qnt,The blocks are created by using the simulink.
- The discharge current from the battery given to the gain block having the value of 1/3600 to convert A to Ah.
- The saturation limits are given which are 1 to 0.so that we get the soc value from 0 to 1 multiplied with 100 to get the percentage of soc.
- The temperatures are connected with the lookup table.Import Lookup Table Data from MATLAB You can import table and breakpoint data from variables in the MATLAB workspace by referencing them in the Table and Breakpoints tab of the dialog box.
- That current is divided by the capacity due to temperature change and then integrated with the gain value of -1 with the sample of -1 as discrete type integrator is used.
- The current and temperature are multiplied and integrated with the discrete time integrator which means the accumulation of the input signal.
- the output is given to the soc system.
CONCLUSION:
The simulation of three test sequence are done and explained successfully by using the simulink.