Week 7: Shock tube simulation project
Objective
To set up a transient simulation in a shock tube using Converge CFD, where one side is filled with high pressure nitrogen and the other side with low pressure oxygen separated by a diaphragm, and to view the flow results.
Theory
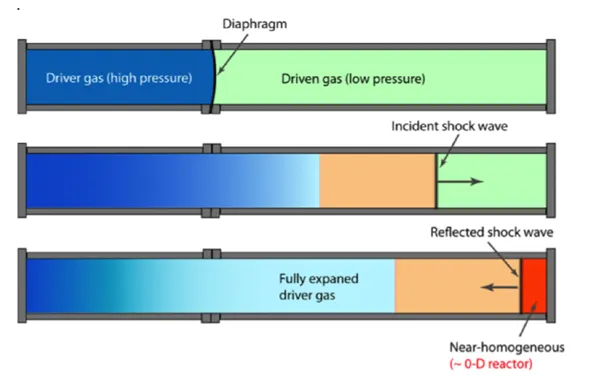
A shock tube is a device used for studying shock waves. Initially, a diaphragm inside the tube blocks any flow. The pressure on one side can be increased, and the flow can be started by rupturing the diaphragm. The gas expands down the other half of the tube.
Solution
Geometry creation
The given shock tube stl file is imported into Converge and the geometry is corrected to remove the triangles in the middle of the geometry.
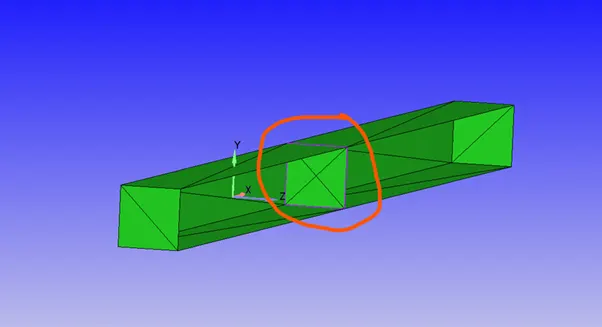
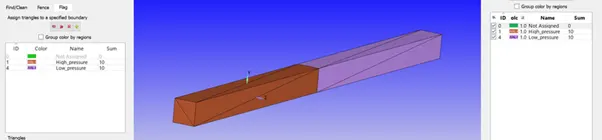
The boundaries are flagged with the appropriate high pressure and low pressure faces.
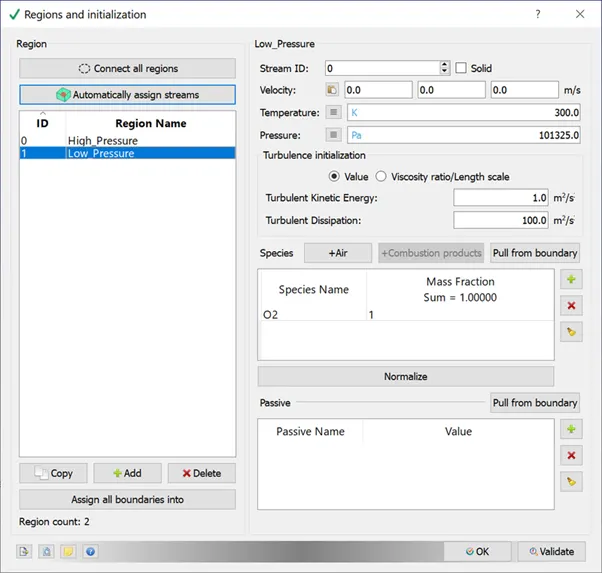
Two regions are created, one each for high pressure and low pressure, and the boundaries are assigned to the corresponding regions.
The pressure in the high pressure region is 6 bar and the gas species is Nitrogen N2.
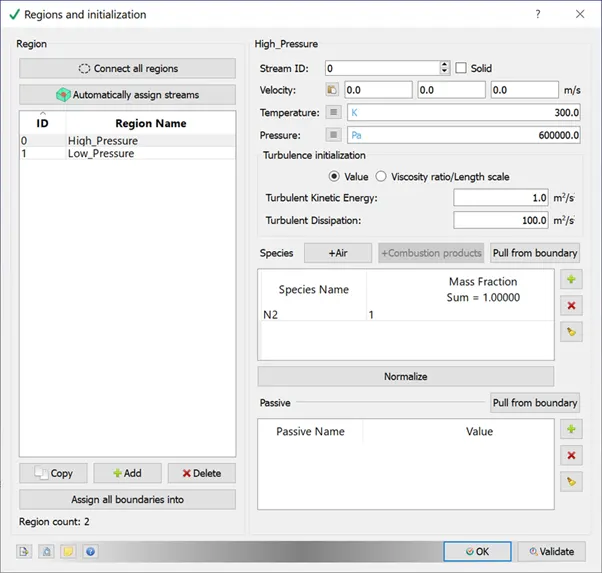
The pressure in the low pressure region is atmospheric pressure (1 bar) and the gas species is Oxygen (O2)
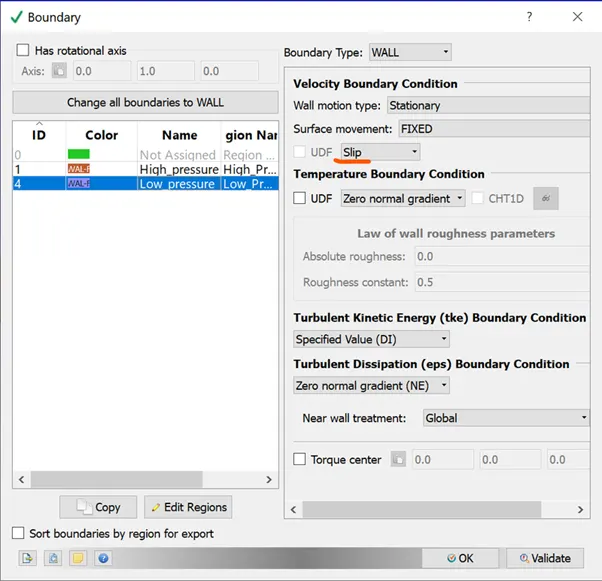
The boundaries are assigned to the regions with slip boundary condition for all the walls
Materials
A Gas simulation with default values for global transport parameters and reaction mechanism are selected.
Simulation parameters
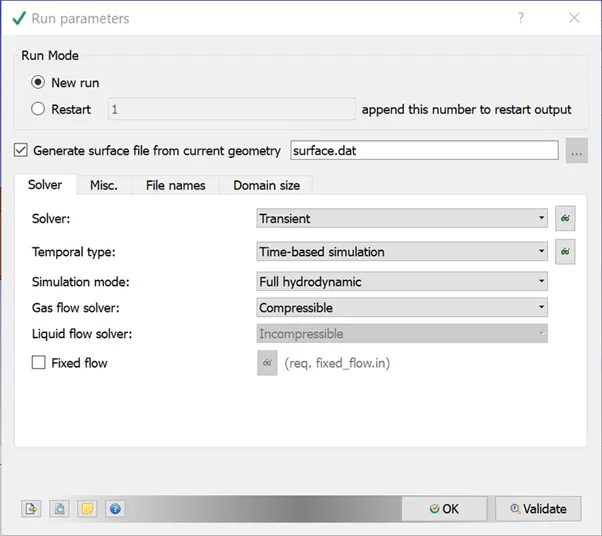
A transient solver is used with default parameters.
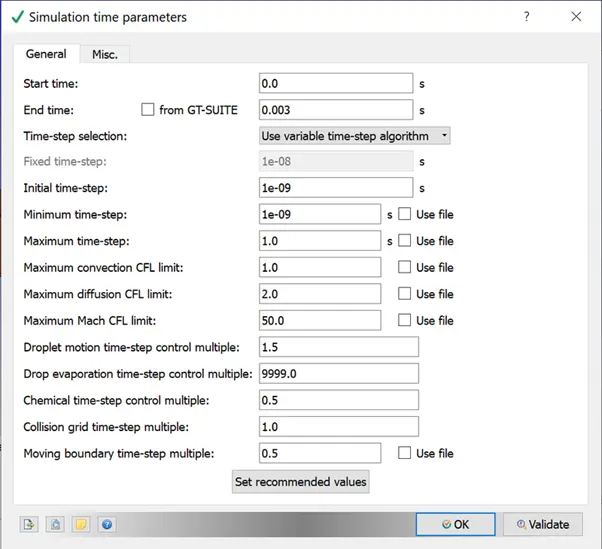
The following values are used for the simulation time parameters
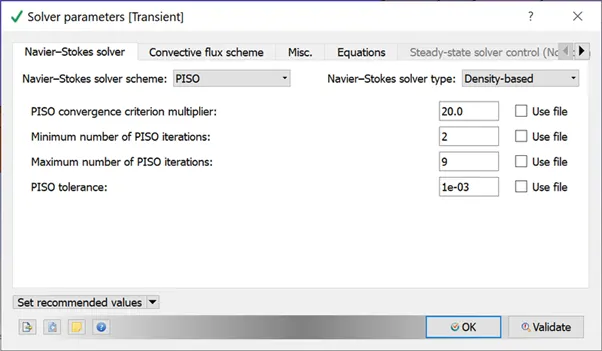
A density based PISO solver is selected
Events
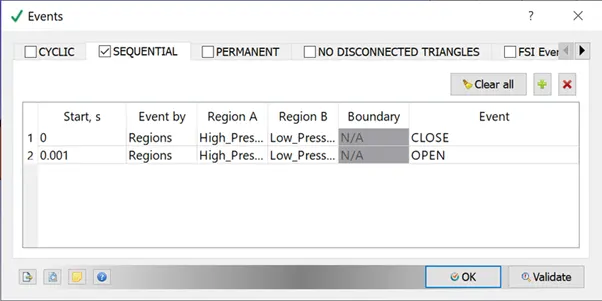
When two regions are in contact with each other with no boundary between them, it is necessary to use events. This creates triangles in the interface between the two regions called disconnected triangles.
The events flag can be turned on at the appropriate time in the case setup, as shown below.
Physical models
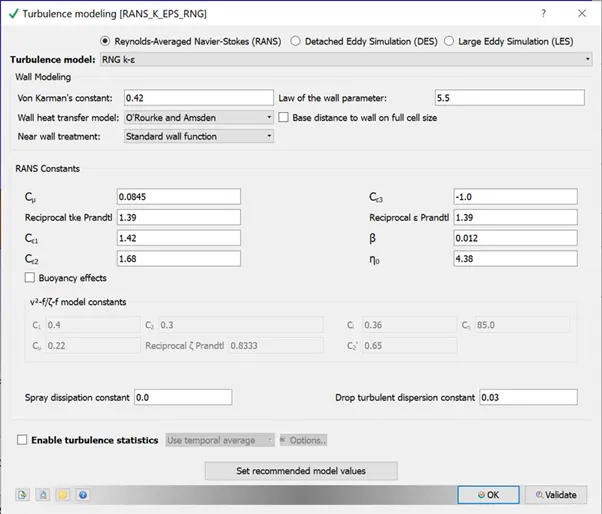
The RANS K_EPSILON model is selected with default parameters.
Grid control
The base mesh size is
dx - 0.004m
dy - 0.004m
dz - 0.004m
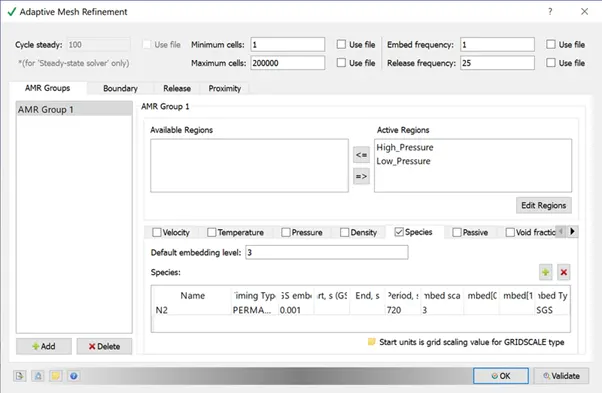
An adaptive mesh refinement based on species was added for N2, for both regions, as shown below.
Post processing
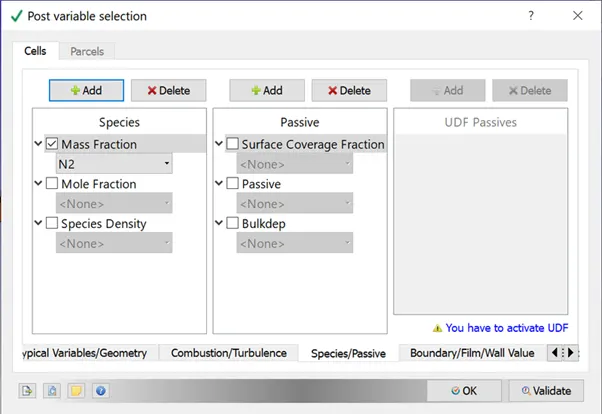
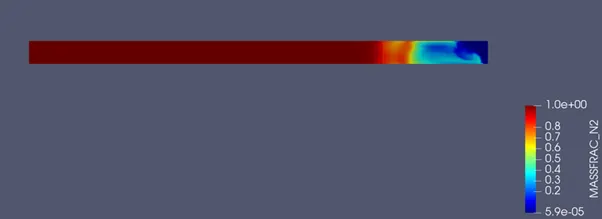
Under species, the mass fraction of N2 is selected.
The time parameters for writing output files are shown below.
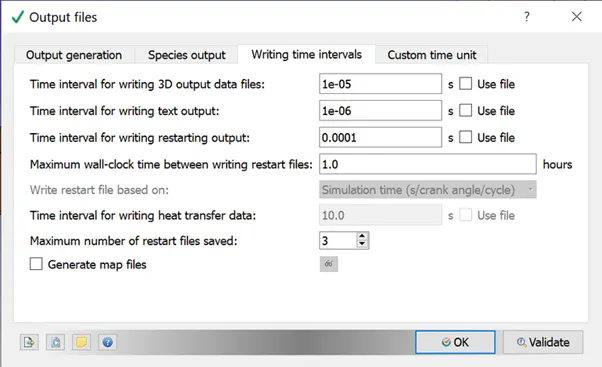
The input files are exported and the case is run in CYGWIN.
The results of the simulation can be post processed in PARAVIEW.
Paraview
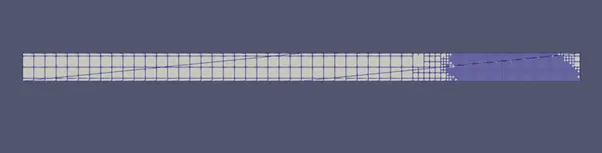
Mesh
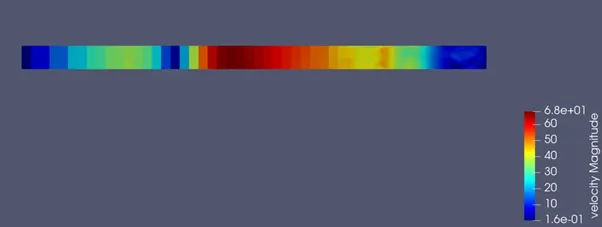
Velocity contour
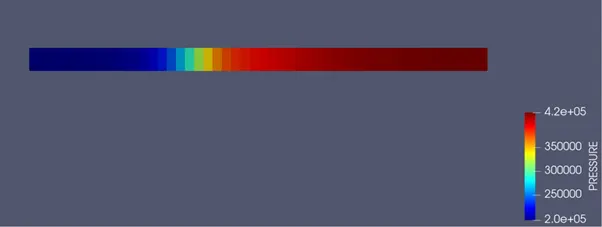
Pressure contour
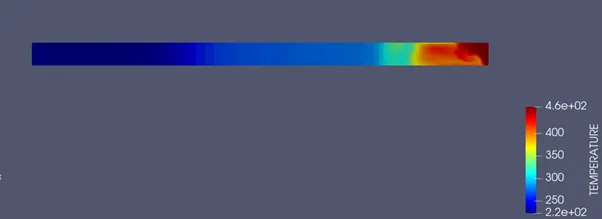
Temperature contour
Mass fraction N2
Animations
Velocity
Pressure
Temperature
Mass fraction N2
Results
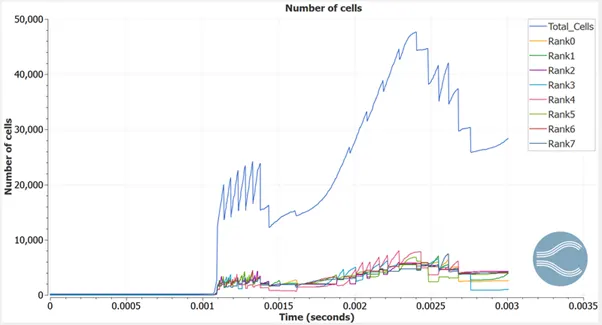
Number of cells
The total number of cells for the grid size of 0.004m, and the split up of the cell count for the different refinements are shown below.
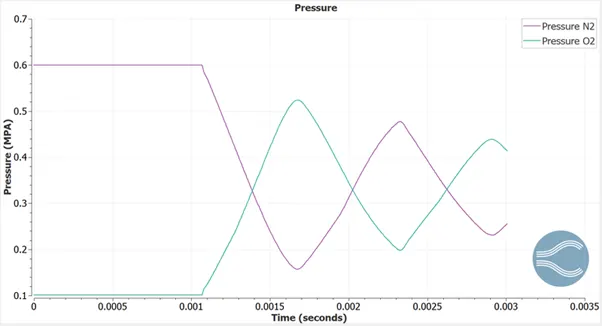
Pressure
The pressure difference between the two species is illustrated below. When the flow occurs and the gases mix, the pressure fluctuates until it settles down.
Temperature
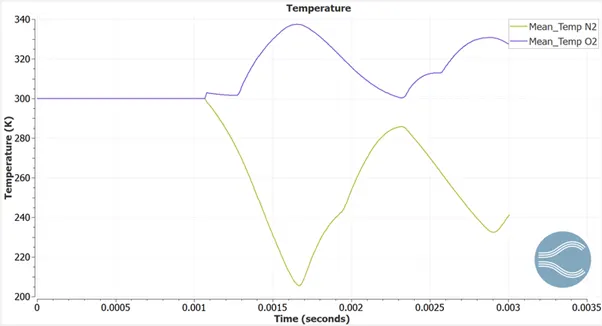
The temperature distribution is illustrated below. N2 and O2 are at 300 K initially. When the flow starts, the N2 which is at higher pressure flows into the oxygen side. Its pressure reduces, and the temperature also reduces thereby. There is a corresponding increase in the temperature of O2, as its pressure increases.
Conclusion
Thus the transient simulation of flow through a shock tube has been performed and the results have been illustrated.