Week 6: Conjugate Heat Transfer Simulation
Aim: Conjugate Heat Transfer Simulation
Objective:
Grid dependence test
- Start with an initial base grid
- Run grid dependence test on 3 grids and show that the outlet temperature converges to a particular value
Effect of supercycle stage interval
- Set supercycle stage interval to 0.01,0.02 and 0.03
- For these three values, how does the total simulation time compare against the baseline configuration?
Introduction: Conjugate heat transfer analysis is based on a mathematically structured problem, which describes the heat transfer between a body and a fluid flowing over or inside it as a result of interaction between two objects. At the matching interface, the details are provided for temperature distribution and heat flux along the interface eliminating the need of calculating the heat transfer coefficient. Moreover, the heat transfer coefficient can be calculated later.
One of the simplest ways to realize conjugation is through numerical methods. The boundary condition for the fluid and solid interface is set and solved through iteration methods. There are no right guesses for the values of the initial boundary condition for the convergence except through the hit and trial method.
Application: The conjugate heat transfer methods have become a more powerful tool for modeling and investigating nature phenomena and engineering systems in different areas ranging from aerospace and nuclear reactors to thermal goods treatment and food processing from the complex medicines' complex procedures ocean thermal interaction in metrology.
CHT in recent years has significantly improved the cooling performance of electronic equipment such as the design of heat sinks and the design of heat exchangers for the waste treatment plant. One such application of CHT is the exhaust port system.
Case setup
The Create option is selected under the Geometry Dock, the Shape tab is selected. Under the Shape tab, the Cylinder is selected with centers 0,0,0 and 0,0,0.2 and radius 0.015 m, and another cylinder is created with the same centers but with a radius of 0.02m. The diagnosis dock is opened and it was observed that there are Intersection (108) errors found, there was a requirement to delete the intersecting triangles to get rid of these errors. The Repair option is clicked in the same Geometry dock, the Delete tab is selected, and the Angle method is chosen. The front and the back portion of the cylinder are selected for deletion and the geometry will be looking like a hollow type with both sides opened.
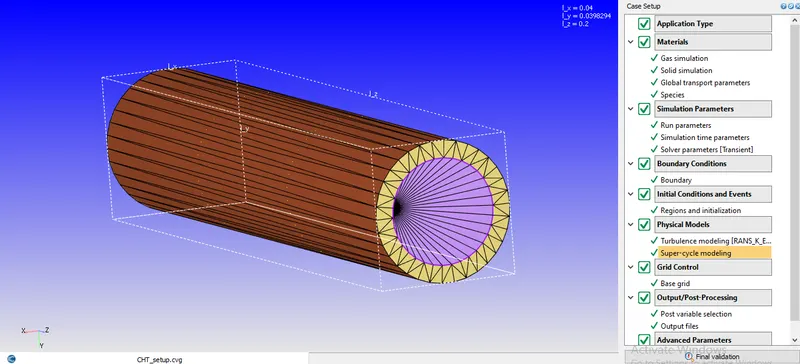
Solid-thickness-Boundary-flagging
The Boundary flagging is done which represents the thickness of the solid and the inlet. The triangles are created between the spaces available in between the inlet and the outer wall and the same is done for the outlet side also. This is done by using Create option then clicking on Triangles and then hitting Loft Edges, and the Open Edges is selected. The first set of edges are selected and then the second set of edges are selected and then hit Apply. It will be observed that the triangles are created in between the spaces of the inlet and outer wall and the same is done for the other side too. The newly created triangles are called Solid thickness.
Inlet-Outlet-Boundary-flagging
The Repair option is selected from the Geometry dock, and then the Patch option is selected. The List of Edges option is checked and the Arc Method is selected to figure out the Inlet and the Outlet. It is preferred to flag Inlet where the coordinate system is placed.
Interface-Boundary-flagging
The Diagnosis is again Run to check whether everything is correct or not and it is found that there are 200 Non-Manifold Problems. In CHT simulation it is common to encounter a Non-manifold error because the edge of the circle is shared by the three triangles. The Non-manifold errors are because of the interface that exists between the solid and fluid regions. Thus the region is selected and the Boundary flagging is done for the interface. The Normal toggle is selected to observe the normal vector for the interface. As observed the normal vectors will be pointing towards the fluid region which is the forward direction and the solid region will be in the reverse direction.
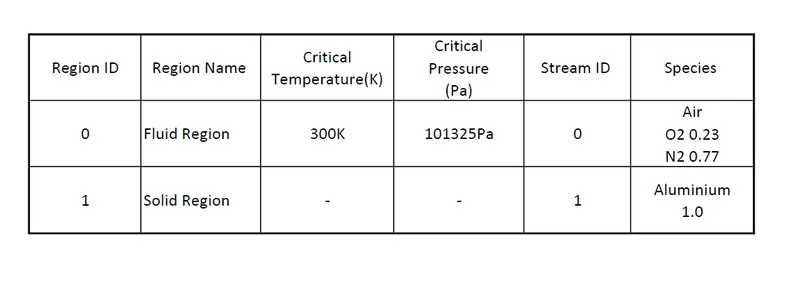
Region and Initialization
For the solid region Stream ID is set to 1 and solid is checked.
Wall function and Y+
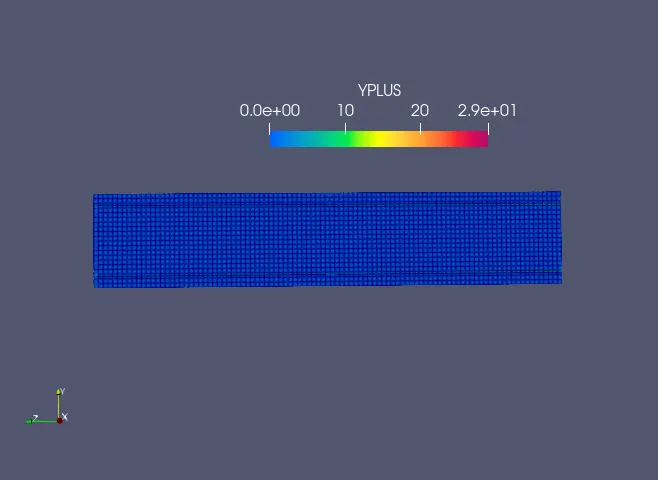
It is necessary to resolve the mesh near the wall to know the values which are associated with it. Wall functions are the empirical functions that tell us that how the physical parameters such as drag, lift, heat transfer coefficient behave near the wall, and many more. The boundary layer develops near the wall, the viscous force is predominant near the wall reducing the velocity to be zero causing the no-slip condition. The scenario is completely different when the flow is turbulent because the turbulent flow has a smaller laminar region in the beginning but later on, in the buffer layer and turbulent layer the viscous force is negligible and the no-slip condition no longer remains valid. This is where Y+ plays a major role in determining the grid refinement near the wall.
If we don't have the grid refined near the wall, the values of drag, lift, and heat transfer coefficient will normally deviate from the experimental values. It is recommended to keep the Y+ value in the viscous sublayer (1 to 5), the buffer region does not provide any fruitful result so far, and still, the research has been going on to develop a suitable wall function that will satisfy all the three layers (viscous sublayer, buffer layer, logarithmic layer).
The Y+ is not based on the first cell but the first node, this would be the cell centroid since for the finite volume method the cell center is the node.
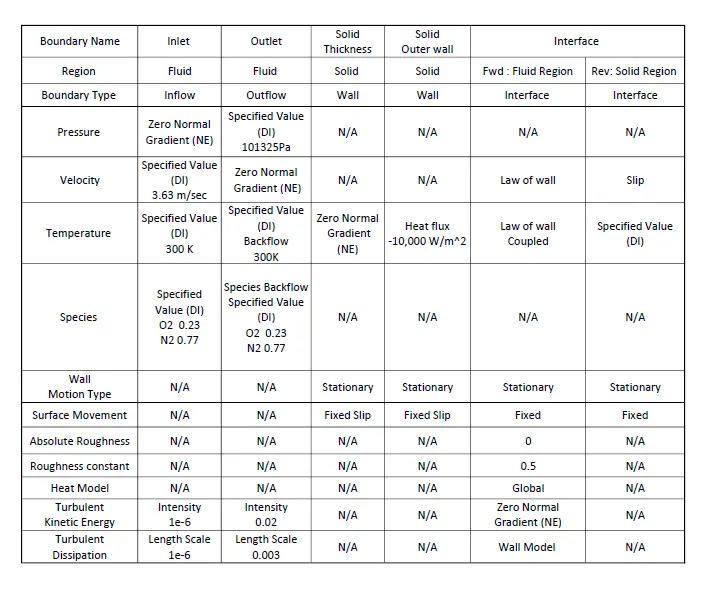
Boundary Selection
The boundary selections are tabulated as under
Setting up of Turbulence model
The Realisable `k-epsilon` model is selected from the case-setup tree for the above-said simulation. Since the size of the eddies is restricted near the wall and the maximum size of the eddies is formed away from the wall. It is well suitable for resolving flows in the logarithmic flow region where y+ ranges from 30 to 300 and flows involving a high Reynolds number.
Supercycle modeling
Super cycling is a method used by the Converge-CFD software involving Conjugate Heat Transfer Simulation which involves both the fluid and the solid regions.
As the heat transfer in the liquid region is faster than the solid regions, the problem arises during the solution stage where the liquid side has reached the convergence state and the solid side has not. Super cycling plays an important role in pausing the liquid side region until the solid region converges. This pausing is done in intervals and can be set by the user.
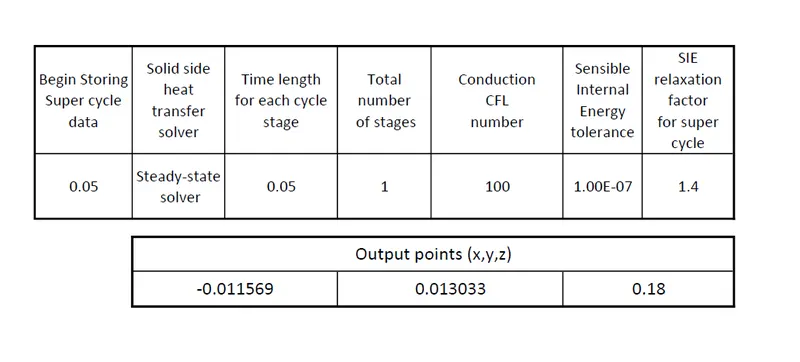
It involves
- Begin storing super-cycle data: The time is set either 0 or a value less than or equal to total simulation time.
- Solid side heat transfer solver can be either steady or transient.
- The time length of each solver determines the pausing of the liquid region and solving the solid region.
- The CFL number, SIE tolerance, and relaxation factors are the solved parameters that are used for improving the accuracy of the solution.
- The monitor points must be defined in the solid region to know the temperature. The location tool is selected and the average of vertex option is selected at the outlet to know the location of monitor points.
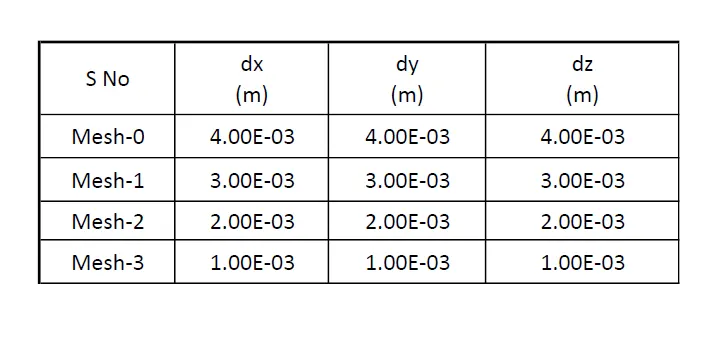
Base-grid
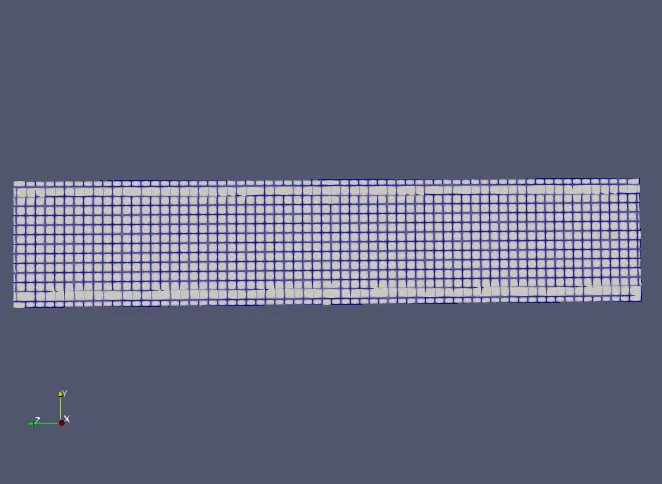
The following base-grid were used for the simulation
Calculation of inlet velocity
The Reynolds number for the flow inside the pipe is given by, `R_e=frac{rho**v}{mu**D}`
where,
`rho=1.184frac{kg}{m^3}`
`mu=1.846**10^-5frac{kg}{m-sec}`
`D=0.03`
`R_e=7000`
Therefore the inlet velocity is given by `v=3.63frac{m}{sec}`
Results
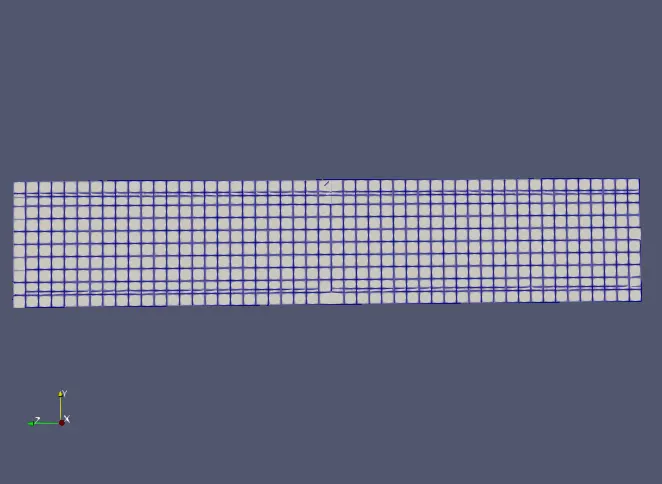
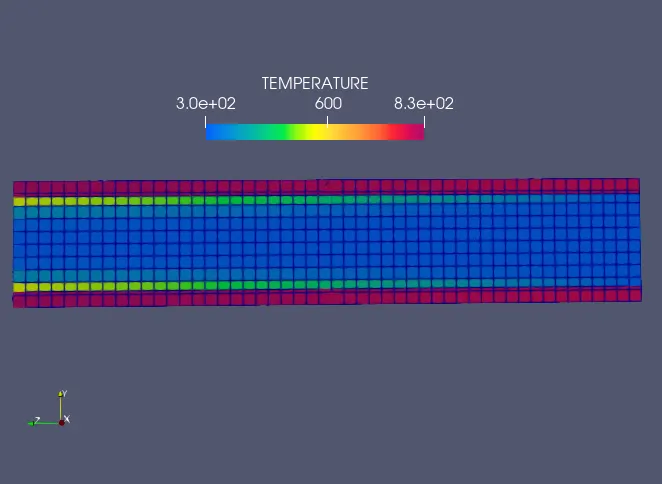
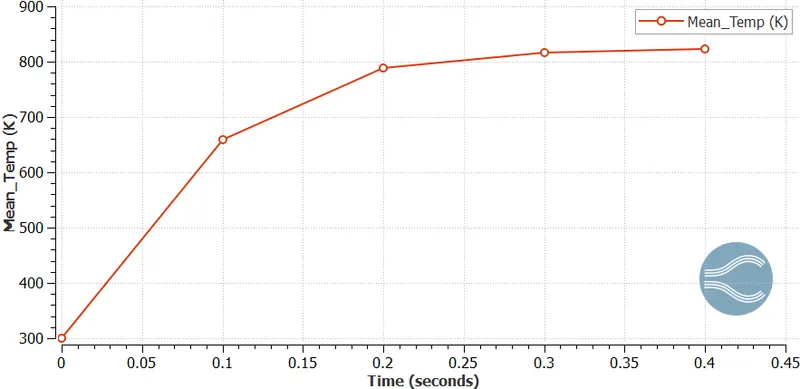
Mesh-0
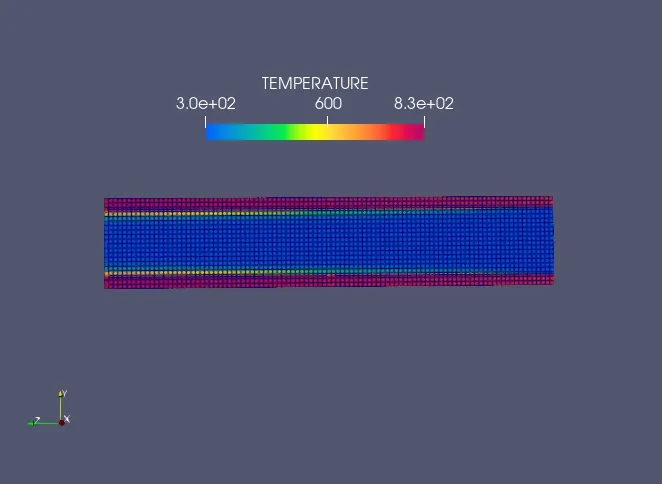
Temperature contour
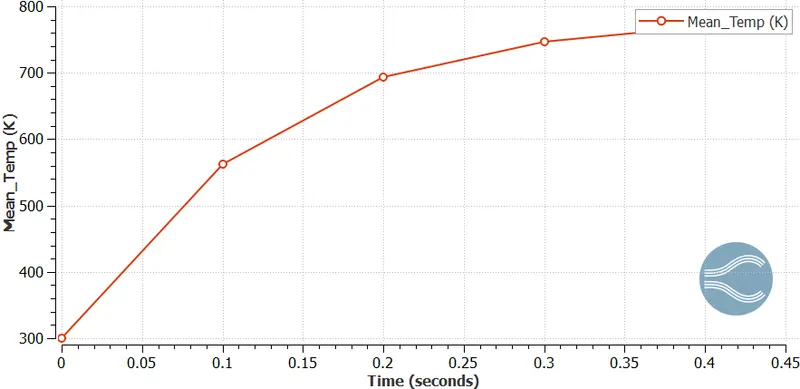
Mean temperature
Animation file
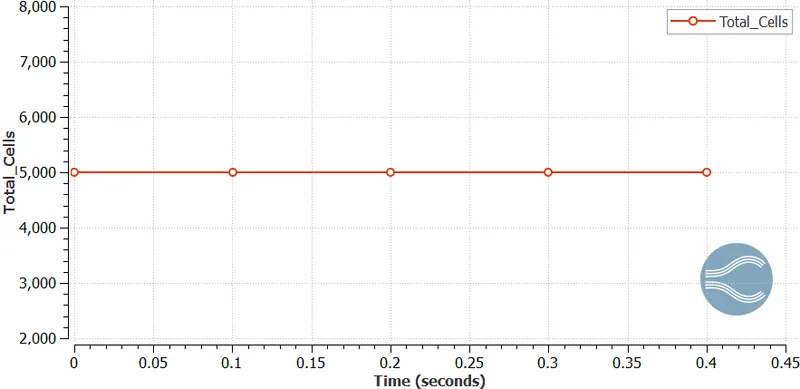
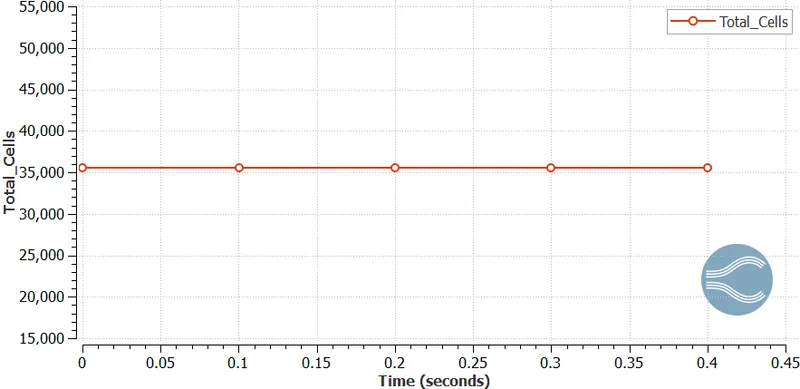
Total cell count
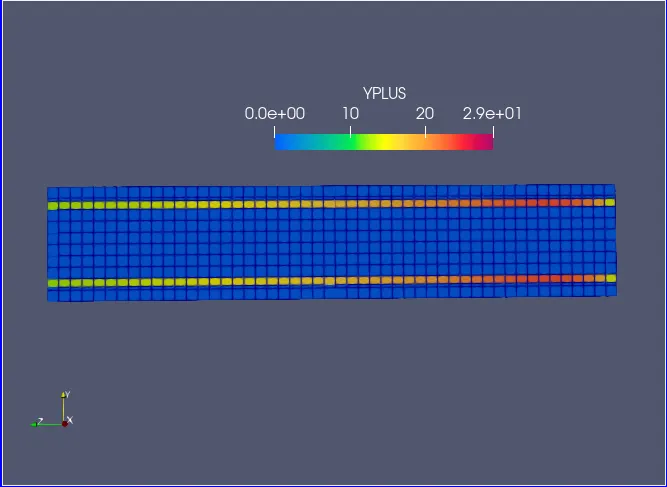
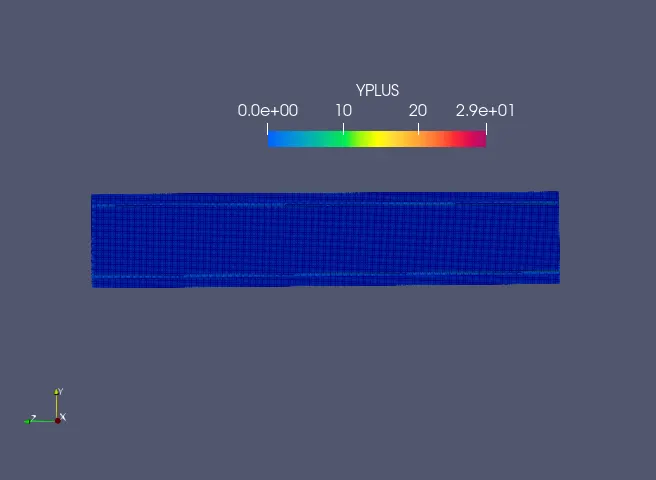
Y+ contour
Mesh-1
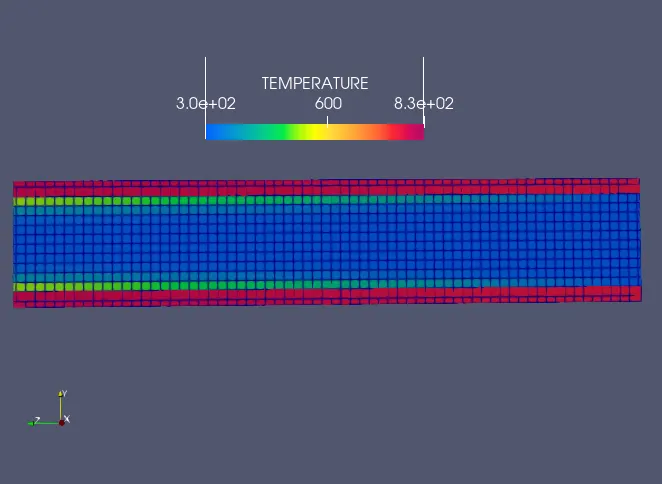
Temperature contour
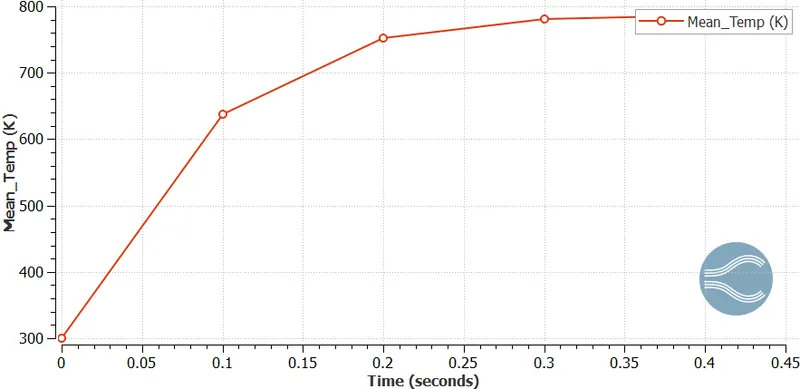
Mean temperature
Animation file
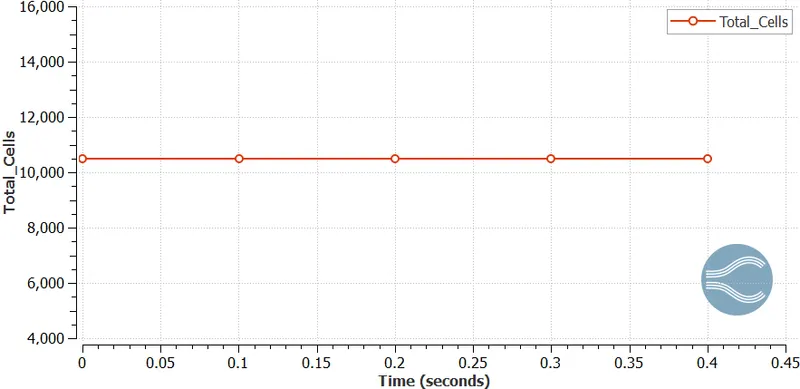
Total cell count
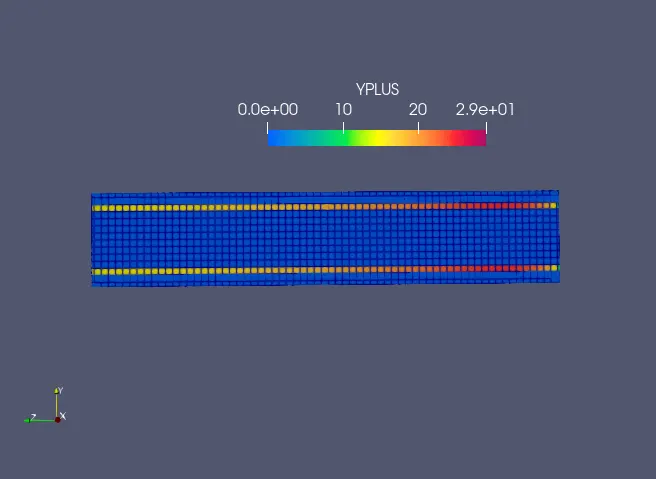
Y+ contour
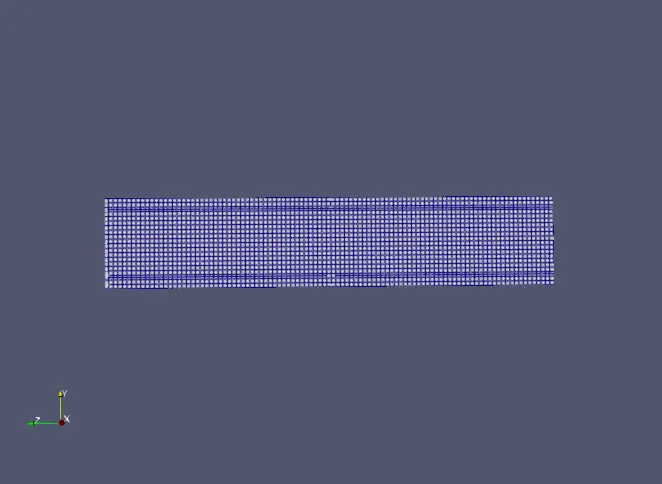
Mesh-2
Temperature contour
Mean temperature
Y+ contour
Animation file
Total cell count
Mesh-3
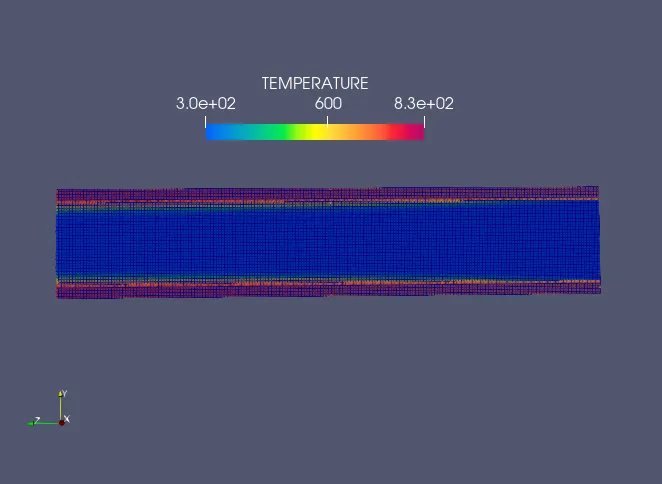
Temperature contour
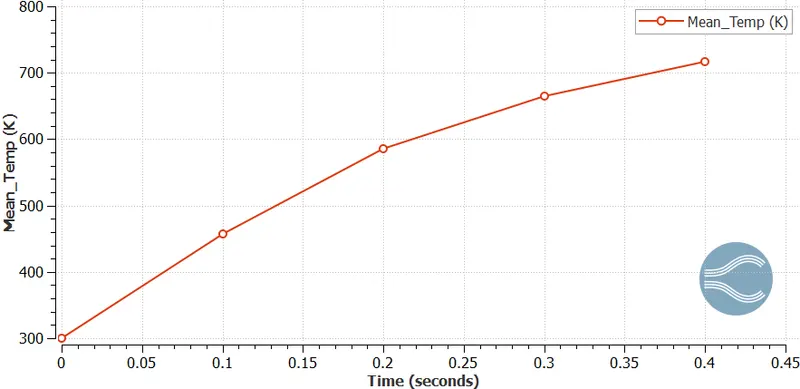
Mean temperature
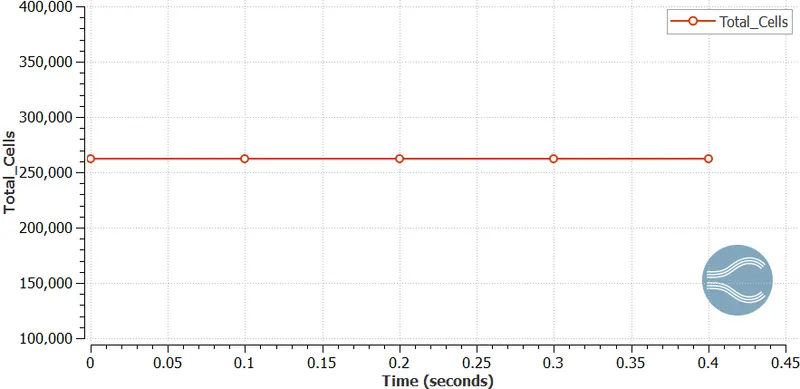
Total cell count
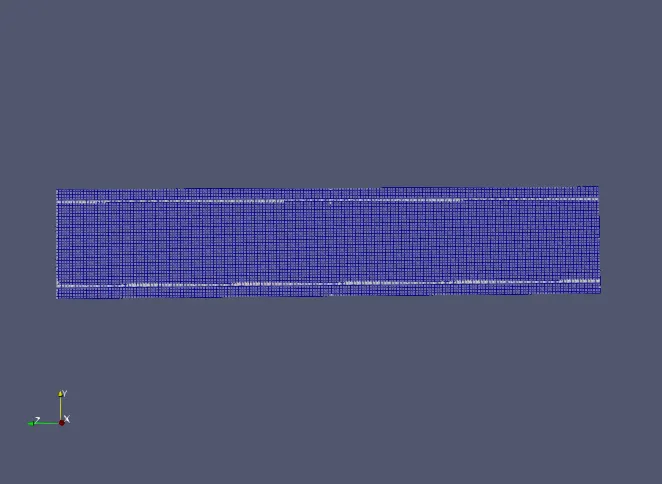
Y+ contour
Animation file
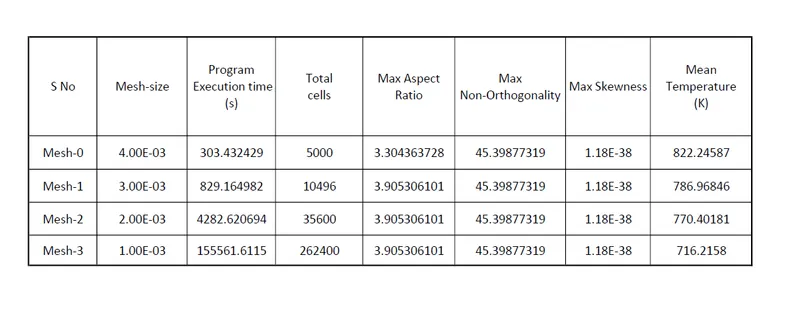
Summarizing the values
Effect of super-cycle stage interval on grid size 0.004m
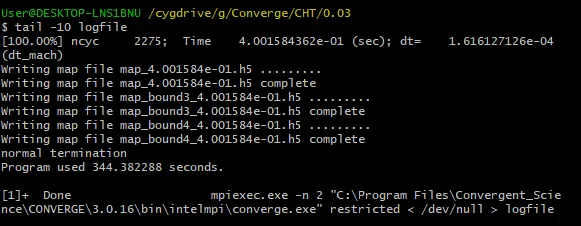
Supercycle stage interval 0.03
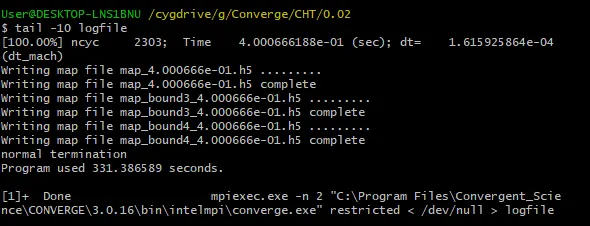
Supercycle stage interval 0.02
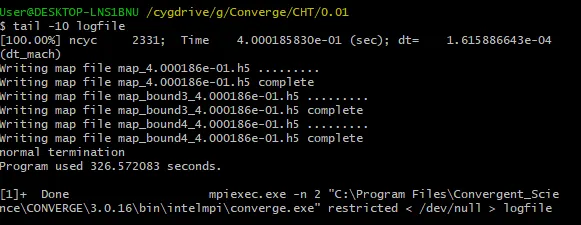
Supercycle stage interval 0.01
Conclusion
- The Conjugate Heat Transfer Simulation was carried successfully using Converge-CFD software and Cygwin command prompt terminal.
- The temperature values have been tabulated for all four mesh sizes and clear differences are observed for all the mesh sizes. The coarse mesh has a higher value of 822.24587K and the refined grids have a value of 716.2158K. The temperature value could have slightly converged to a particular but due to restriction in the usage of cells (restricted to 5,12,000 cells) and lack of high computing power restricted us in the usage of more refined cells.
- The refined mesh has more cells near the wall than the coarse mesh which contributed to the decreasing trend in the temperature value. This can be observed in the Y+ contour images.
- The baseline mesh was also subjected to supercycle stage intervals of 0.03, 0.02, 0.01. It was also observed that the decrease in the supercycle stage interval affects the simulation time. The "0.03" took "344.3822s", "0.02" took "331.386s","0.01" took "326.572s", therefore "0.01" is faster than "0.03".
Source
What is SUPER-CYCLING : [https://skill-lync.com/knowledgebase/what-is-super-cycling]
Wall functions and Y+ : [https://skill-lync.com/knowledgebase/wall-functions-and-y]