Week 4 - Genetic Algorithm
OBJECTIVE
- To write a code in MATLAB to optimize the stalagmite function and find the global maxima of the function.
What is ga in Matlab?
A genetic algorithm is a method for solving both constrained and unconstrained optimization problems based on a natural selection process that mimics the natural process of evolution theory of Charles Darvin. As in the biological process here also the fittest one is going to survive to get the best solution for optimization problems.
How does ga works in Matlab?
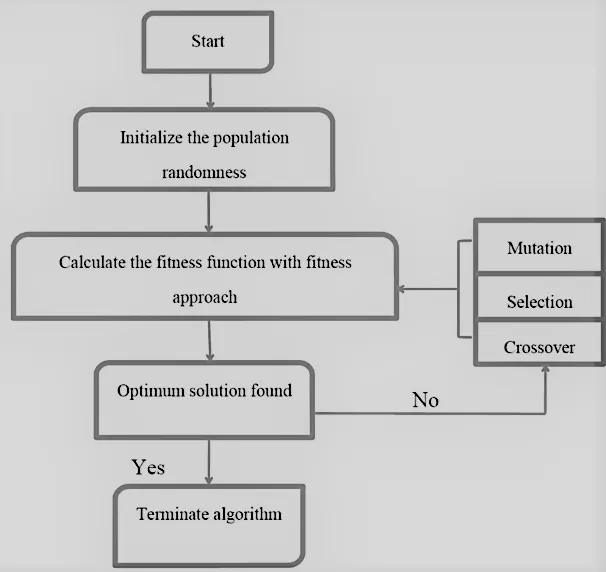
as shown above, first it will initialize the population randomness and then it will evaluate for the fittest function if it gets an optimum solution then it will terminate and stops the iterations, if the solution found is not optimum then it will use the selection, crossover and the mutation methods to get an optimum solution and then it will calculate for the fittest function and then it will terminate after getting an optimum solution.
SYNTAX OF GA
x=ga(fun,nvars,A,b,Aeq,beq,lb,ub)
where,
fun is the Objective function, specified as a function handle or function name.
nvars is the Number of variables, specified as a positive integer. The solver passes row vectors of length nvars to fun.
A & b are the linear inequality constraints.
Aeq & beq are the linear equality constraints.
lb is the lower boundary condition.
ub is the upper boundary condition.
STALAGMITE FUNCTION
The stalagmite function used here is,
`f(x,y)=f1,x f2,x f1,y f2,y`
`f1,x=[sin(5.1pix+0.5)]^6`
`f2,x=exp[-4ln(2)((x-0.0667)^2/0.64)]`
`f1,y=[sin(5.1piy+0.5)]^6`
`f2,y=exp[-4ln(2)((y-0.0667)^2/0.64)]`
PROCEDURE
- Let's start with the clear commands i.e clear all, close all, clc.
- creating the 1-dimensional array as our search space by commenting on them %defining our search space i.e, x=linspace(0,0.6,150) and y=linspace(0,0.6,150). and we are taking the number of cases as 50 this will be going to evaluate for 50 iterations and we have created a function get_stalagmite(x,y) which basically generates the stalagmite functions.
- by using the 1-dimensional array will create a 2-dimensional array i.e, [xx,yy]=meshgrid(x,y);
- for each value of x&y creating an array called input_vector which has 2 columns, it is actually a row vector.
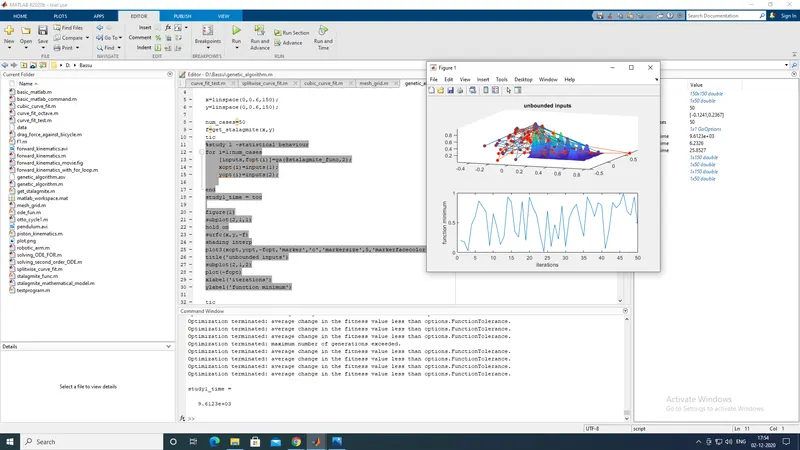
- we are going to run the code in three parts as studies 1, 2, 3. The first study is just calling the ga and passing the number of variables as inputs and storing the x&y values and also the optimum value that the function predicts. i.e, by commenting %study1-statistical behaviors we are creating a for loop here. in the for loop, we are using the syntax for ga.
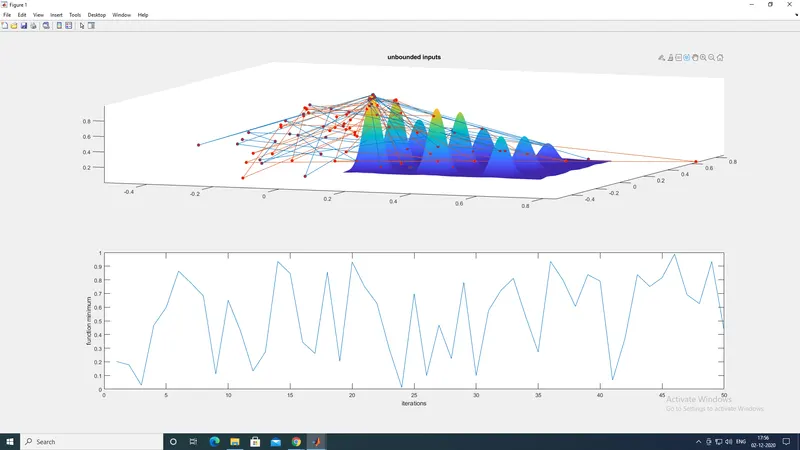
- after that open a new figure window and create a subplot the first plot that created is the stalagmite function using command plot3 in the code written that is to plot the x, y, optimum function value that ga predicts over the 50 studies. This helps us visualize how the algorithm performing. To make this clear we make a second subplot and in this, we directly plot the optimum values predicted of the function which is basically the case number. So this is the first study we are going to run and then to measure the time how long it takes we are just including the time command i.e, tic and toc. before the for loop, we can assign the tic command which will be the starting time of the run, and then after the iterations that are after for loop assigning the ending time command that is by study_time=toc, in study 1 these are having the unbounded conditions for that we will be plotting.
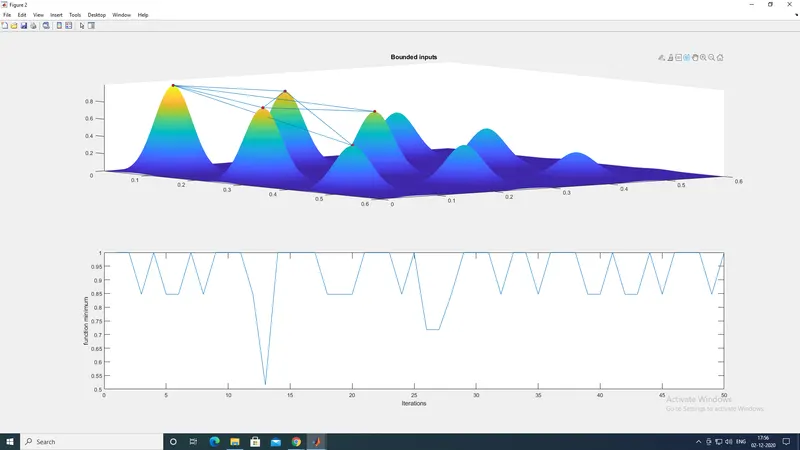
- in study 2 we are setting up the bounds for variables, x&y are going below and above 0.6 we wanted between 0 and 1. We can do this by setting up the boundaries i.e lower bound and upper bound this what we are doing in study 2. Here we are giving the bound conditions So the effect on improvement by using bounds is getting feasible solutions to a problem on the one hand. On the other hand, it is reducing the search space, which helps the solver finding good solutions faster.
- in study 3 we are increasing ga iterations that are we are just increasing the population size to 300 by using the ga syntax in the options by this we are increasing the number of iterations so that we have more chances of getting the accurate solution so to get a most accurate solution we are increasing the population size and then we are going to run the code for study 3 also.
CODE
clear all
close all
clc

x=linspace(0,0.6,150);
y=linspace(0,0.6,150);

num_cases=50
f=get_stalagmite(x,y)
tic
%study 1 -statistical behaviour
for i=1:num_cases
    [inputs,fopt(i)]=ga(@stalagmite_func,2);
    xopt(i)=inputs(1);
    yopt(i)=inputs(2);

end
study1_time = toc

figure(1)
subplot(2,1,1)
hold on
surfc(x,y,-f)
shading interp
plot3(xopt,yopt,-fopt,'marker','o','markersize',5,'markerfacecolor','r')
title('unbounded inputs')
subplot(2,1,2)
plot(-fopt)
xlabel('iterations')
ylabel('function minimum')

tic
% study 2 statistical behaviour with upper and loewr boundries
  for i=1:num_cases

     [inputs,fopt(i)]=ga(@stalagmite_func,2,[],[],[],[],[0;0],[1;1]);

     xopt(i)=inputs(1);
     yopt(i)=inputs(2);


  end
  study2_time=toc


   figure(2)
   subplot(2,1,1)
   hold on
   surfc(x,y,-f)
   shading interp
   plot3(xopt,yopt,-fopt,'marker','o','markersize',5,'markerfacecolor','r')
   title('Bounded inputs')

   subplot(2,1,2)
   plot(-fopt)
   xlabel('Iterations')
   ylabel('function minimum')

%    study 3 increasing GA iterations
options=optimoptions('ga');
options=optimoptions(options,'populationsize',300);
     tic
     for i=1:num_cases
         [inputs,fopt(i)]=ga(@stalagmite,2,[],[],[],[],[0;0],[1;1],[],[],options);

         xopt(i)=inputs(1);
         yopt(i)=inputs(2);

     end
     study3_time=toc


     figure(3)
     subplot(2,1,1)
     hold on
     surfc(x,y,-f)
     shading interp
     plot3(xopt,yopt,-fopt,'marker','o','markersize',5,'markerfacecolor','r')
     title('Bounded inputs')
     subplot(2,1,2)
     plot(-fopt)
     xlabel('iterations')
     ylabel('function minimum')
function  [S]=stalagmite_func(input_vector)

         x=input_vector(1);
         y=input_vector(2);

         f1_x=(sin(5.1*pi*x+0.5))^6;

         f1_y=(sin(5.1*pi*y+0.5))^6;

         f2_x=exp((-4*log(2))*((x-0.0667)^2/0.64));

         f2_y=exp((-4*log(2))*((y-0.0667)^2/0.64));
         [S]=-(f1_x.*f1_y.*f2_x.*f2_y);
end
function [s] = get_stalagmite(x,y)


 [xx yy] = meshgrid(x,y);


  x1 = (sin(5.1*pi*xx+0.5)).^6;

  y1 = exp((-4*log(2)*(((xx-0.0667).^2)./0.64)));

  x2 = (sin(5.1*pi*yy+0.5)).^6;

  y2 = exp((-4*log(2)*(((yy-0.0667).^2)./0.64)));

  s =-( x1.*x2.*y1.*y2);


end
OUTPUT
For study 1 -statistical behaviors with unbounded conditions
here we can observe that the condition is unbound so we can able to see the randomness of the values here in the below case.
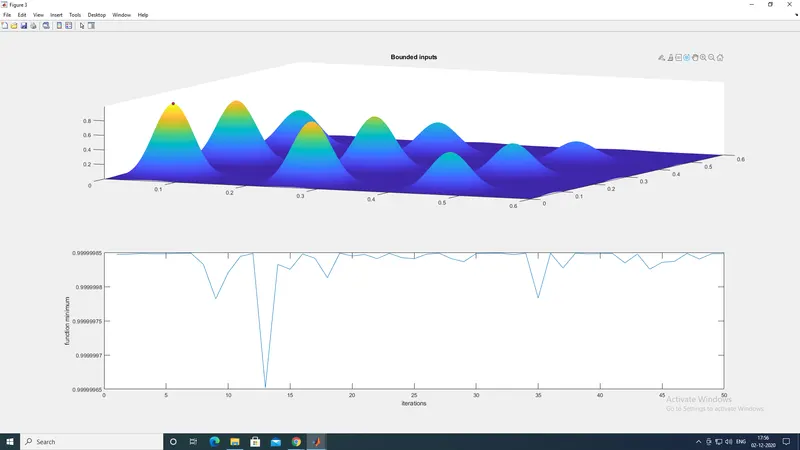
For study2- statistical behaviors with lower bounds and upper bounds.
Here we are giving the bound conditions So the effect on improvement by using bounds is getting feasible solutions to a problem on the one hand. On the other hand, it is reducing the search space, which helps the solver finding good solutions faster.
For study3-increasing the ga iterations that is the population size.
Here we are giving the bound conditions along with that we are increasing the population size to 300 so that it will increase the number of iterations and we can obtain a more accurate or feasible solution and we can able see that in this case of study as we obtain the solution in the below.
ERRORS
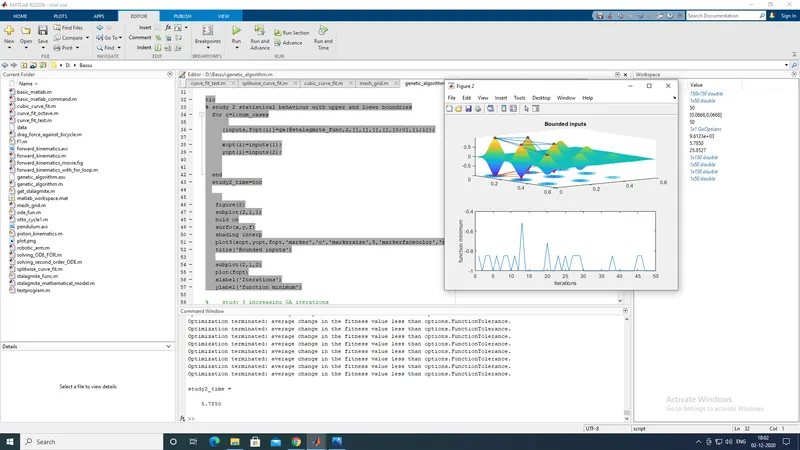
The code was running and the values showing was incorrect because actually, it was due to not using the negative sign before the function value which we were plotting that is optf and f and this was corrected.
CONCLUSION
The code in MATLAB to optimize the stalagmite function and the global maxima of the function have done and the graph for the maximum function values vs no of iterations also been plotted.