Conjugate Heat Transfer (CHT) Analysis on a Exhaust port using Ansys Fluent solver
I. Aim: Numerical analysis of conjugate heat transfer in an automobile exhaust port.
II. Introduction:
Conjugate heat transfer (CHT) is the heat transfer mechanism occurring at a solid-fluid interface. This type of heat transfer includes both convection (fluid side) and conductive (solid side) heat transfer. The fluid side convection may be natural convection or due to forced convection.
The common examples of CHT are heat transfer between different fluids through heat exchangers, cooling of automobile engines with fins, heat sink applications in electronic equipment, electric motor cooling, and battery thermal management in Electric vehicles, etc. Forced convection on the fluid side plays an important role in achieving high heat transfer rates between the solid surface and the fluids.
Designing the optimum heat transfer interface between the solid surface and the heat transfer fluid plays an important role in keeping the electronic equipment, automobile engines, Electric vehicles, Industrial machinery at their operating temperatures, and better heat transfer in heat exchangers to maximize the performance efficiencies.
CHT analysis comes into the picture in designing the optimum heat transfer model for the above applications. Particularly, numerical CHT analysis using CFD plays an important role to design better heat transfer mechanisms. Using CHT analysis the optimum material and geometry for the solids as well as the flow rates and fluid properties can be realized for each application. The CHT analysis in CFD solves the convection physics on the fluid side and conduction physics on the solid side.
Fluid/Solid Interface heat interaction:
The temperature field and the heat flux are continuous at the fluid/solid interface. However, the temperature field can rapidly vary in a fluid in motion: close to the solid, the fluid temperature is close to the solid temperature, and far from the interface, the fluid temperature is close to the inlet or ambient fluid temperature. The distance where the fluid temperature varies from the solid temperature to the fluid bulk temperature is called the thermal boundary layer. The thermal boundary layer size and the momentum boundary layer relative size is reflected by the Prandtl number `Pr = (muC_p)/k`: for the Prandtl number to equal 1, thermal and momentum boundary layer thicknesses need to be the same. A thicker momentum layer would result in a Prandtl number larger than 1. Conversely, a Prandtl number smaller than 1 would indicate that the momentum boundary layer is thinner than the thermal boundary layer.
CHT Exhaust port Analysis:
In this project, numerical CHT analysis of a typical automobile exhaust port manifold with four inlets and one outlet is carried in Ansys fluent software to study the conjugate heat transfer between the fluid (fuel gases) and the temperature distribution in the solid manifold with a fluid inlet velocity of 5 m/s and temperature 700 K.
III Objectives:
1. Give a brief description of why and where a CHT analysis is used.
2. Maintain the y+ value according to the turbulence model and justify the results.
3. Calculate the wall/surface heat transfer coefficient on the internal solid surface & show the velocity & temperature contours in appropriate areas.
4. Verify if the HTC predictions from the simulations are right? On what factors does the accuracy of the prediction depend on?
IV: Solving & Modelling approach:
3D CFD analysis is carried out in Ansys workbench using Fluent solver to simulate the flow and conjugate heat transfer in the exhaust port. Air is used as the flue gas flowing through the port.
V: Pre-processing and solver setting:
The first step in a CFD analysis is preprocessing. This includes preparing the geometry/ computational domain, discretization of the domain (meshing), assigning material properties, boundary conditions, solver setup.
1. Geometry/Domain:
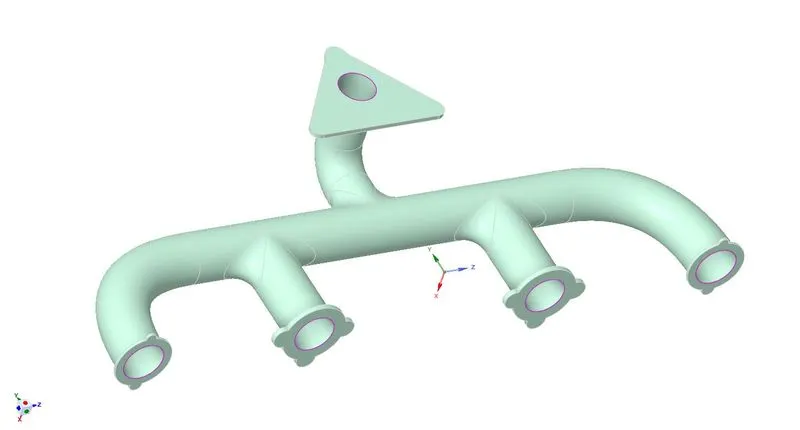
A 3D solid geometry of the exhaust port casing is first modelled in Solidworks and then imported into Spaceclaim. The inner radius of the exhaust port considered is of 83.055 mm. It consits of 3 inlets and one outlet. The geometry is cleaned by removing duplicate edges, free edges and surfaces. Then using the volume extraction option in the SpaceClaim, a fluid domain is created. Further , share topology is enabled between the casing and the fluid domain to have conformal mesh. The following figures show the exhaust port casing, extracted fluid domain.
 |
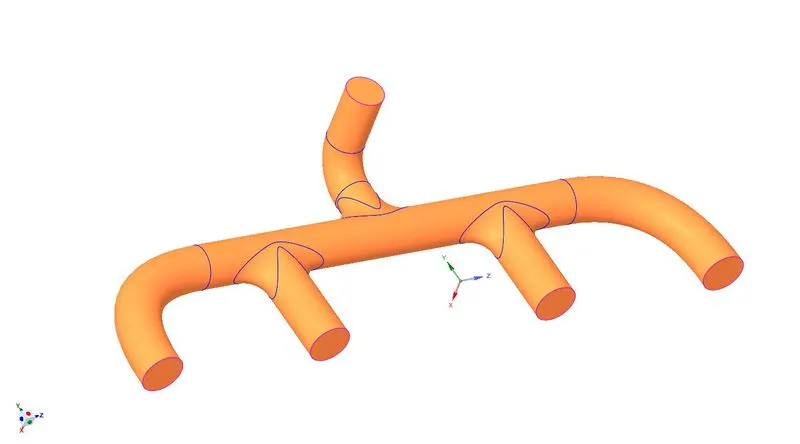 |
| Exhaust port | Fluid doamin |
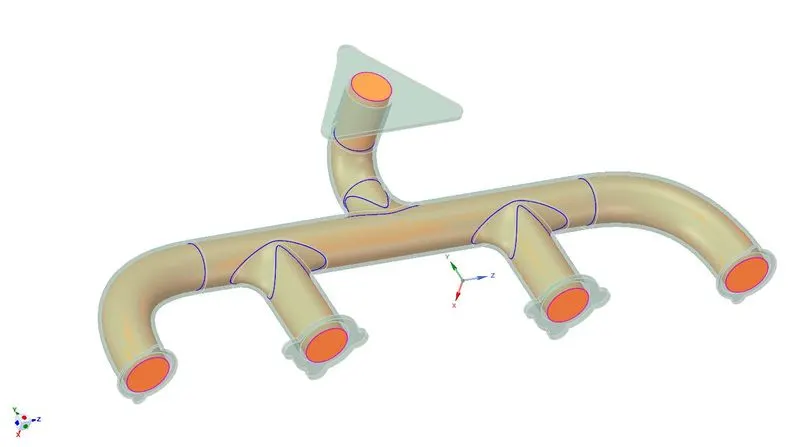 |
| Casing and fluid domain |
2. Domain discretization /Meshing:
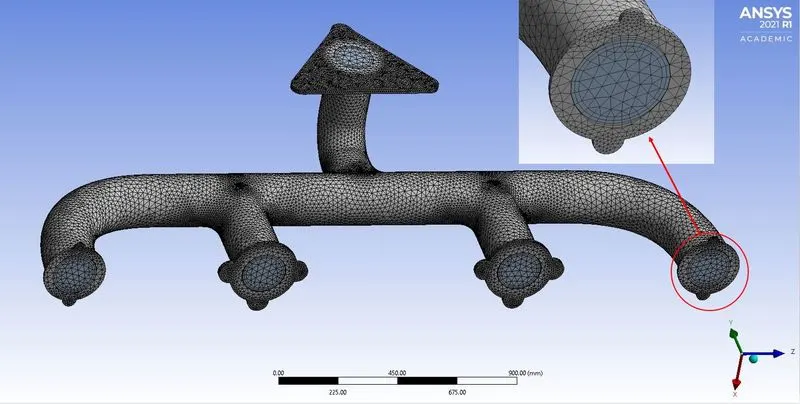
The 3d fluid domain and the solid casing are discretized into a finite number of control volumes using the Ansys meshing component. A 3D tetrahedral mesh is created for the outer casing and fluid domain to accurately capture the geometry. A body sizing of 8 mm is applied to the casing, keeping all other settings to Ansys meshing defaults. The cells at the solid-fluid interface are inflated using the global inflation option to create boundary layer cells. A 2 layer, boundary layer cells are created with a first-layer thickness option on both solid and fluid sides, depending on a y+ value and a growth rate of 1.2.
The generated 3D mesh with a Y plus value of 50 considered, a cell count of 401756 with average element quality of 0.64 and minimum Orthogonal Quality = 1.23489e-02, is shown below:
y+ value:
In order to capture the wall-bounded turbulence effect (heat and fluid flow), the cells near the wall should be inflated and the nondimensional first cell height y+ value determines how effectively the physics is captured. In this analysis, the flow Reynolds number (Re ) is around 56868 (> 2300 for internal flow). Hence the flow is turbulent in nature. The realizable `k-epsilon` model with a scalable wall function option is used in this analysis. For this model to be used the value of y+ should be in the range of 30 to 300. Hence a Y-plus value of 50 is chosen. The first cell height calculated from the following relations :
`y+ = (y*rho.U_tau)/nu`
where y = height of first cell centroid in the mesh
`U_tau = sqrt(tau_w/rho)` is the friction velocity at wall
The shear stress `tau_w`is calculated using the empirical formula
`tau_w = 1/2 C_f*rhoV^2`
`C_f = 0.079Re^-0.25` , for internal flows.
From the above relations and choosing a suitable value of y+, the y value can be determined. The height of the first cell is 2 times of y.
The fluid considered for the analysis is air at atmospheric conditions. The flow conditions are given in the below table:
| Flow conditions | |||||
| Fluid | Density (kg/m^3) | Dynamic viscosity (Pa.s) | Flow velocity (m/s) | Inner Radius of the casing (m) | Reynolds number (Re) |
| Air at atmospheric conditions | 1.225 | 1.789E-5 | 5 m/sec | 83.055 mm | 56868 |
Considering the above flow conditions, the following y+ value is used for the analysis, and the corresponding first cell height is given below:
| y+ value | y (m) | First cell height (m) |
| 50 | 2.88E-03 | 5.77E-3 `approx`6E-03 |
The boundaries of the domain are also defined in the Ansys mesher using the named selection option. The boundaries are defined as follows:
| Boundary/Zone | Boundary/Zone name |
| Inlets | inlets |
| Outlet | outlet |
| Solid-fluid interface | inflation layer |
| Casing outer wall | Outer_wall_convection |
3. Solver setup:
The 3D analysis is performed on the discretized domain(meshed model) in Ansys Fluent CFD software. A double-precision parallel solver with 4 cores is used. The double-precision solver uses 64-bit precision, which reduces the round-off error in the results. The solver setup details are given below:
| Solver type | Steady-state pressure-based solver |
| Energy Equation | Set to solve |
| Turbulence model | Realizable `k-epsilon` model with a scalable wall function |
| Fluid domain | Air (default Ansys fluent properties) |
| Solid domain | Aluminium (default Ansys fluent properties) |
| Pressure - Velocity Coupling | Coupled |
| Spatial discretization | Ansys defaults for the Coupled solution method |
| Residual Monitors Criteria | 1E-06 for all the governing equations |
The exhaust port is a complex geometry, where making the first grid point away from the wall at y+>11.225 becomes quite difficult. To avoid deterioration of the solution by standard wall functions in situations where it’s unavoidable for the first grid point to be located at y+>11, scalable wall functions produce consistent results by forcing the usage of the log law in conjunction with the standard wall functions approach. Hence, the scalable wall function is used for the `k-epsilon` model. This allows having a y+ value above 30.
The boundary conditions are given below:
| Boundary zone | Boundary Condition | Momentum | Pressure | Thermal condition | Turbulence |
| Inlets | Velocity inlet | 5 m/s (normal to the boundary) | NA | Temperature-700 K | Ansys fluent default |
| Outlet | Pressure Outlet | NA | Zero gauze pressure | Temperature-300 K | Ansys fluent default |
| Inflation layer | Wall | No-Slip | NA | Coupled | NA |
| Outer wall convection | Wall | No-slip | NA | Convection- HTC = 20 W/m^2K | NA |
Solution setup:
| Solver type | Steady-state pressure-based solver |
| Energy Equation | Set to solve |
| Turbulence model | Realizable `k-epsilon` model with a scalable wall function |
| Fluid domain | Air (default Ansys fluent properties) |
| Solid domain | Aluminium (default Ansys fluent properties) |
| Pressure - Velocity Coupling | Coupled |
| Spatial discretization | Ansys defaults for the Coupled solution method |
| Residual Monitors Criteria | 1E-06 for all the governing equations |
| Initialization | Hybrid initialization |
| Iterations | 1500 |
VI. Results:
The solution is run for around 1500 iterations, and the convergence plot of the residual monitors is shown below:
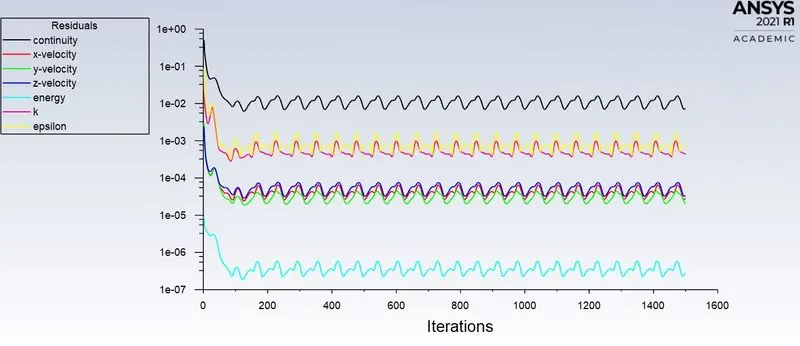
It can be seen from the plot that, the residuals have a repetitive pattern from around 200 iterations. Hence the solution converges after 200 iterations.
1. Y plus:
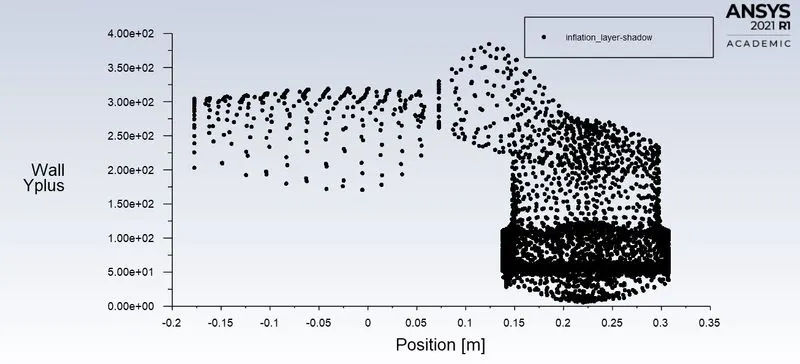
The below x-y plot and contour plot on the inflation layer boundary zone (solid casing-fluid interface) represent the y-plus value maintained during the solution.
 |
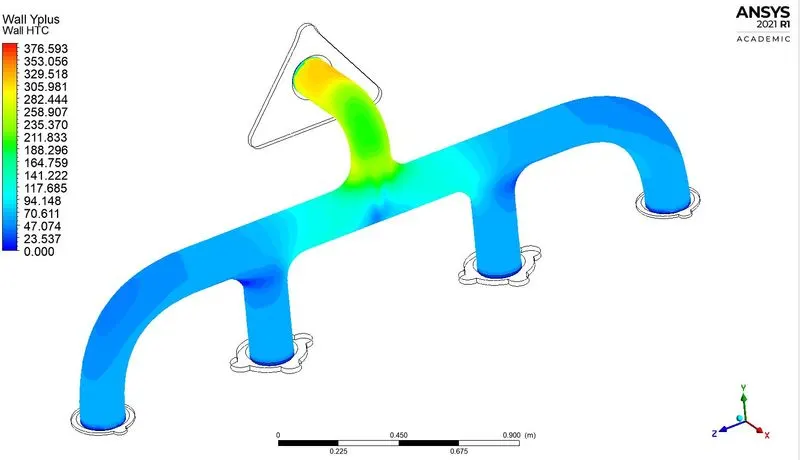 |
It can be seen that the Y-plus value is between the 30-300 range in almost 80% of the domain. This validates that the first cell height is in the log-law region and the use of the Realizable `k-epsilon` model with a scalable wall function with an initial y+ value of 50 is reasonable. Also, since the exhaust port is having a complex geometry and due to cell count limitation in Ansys fluent student version, the Y-plus cannot be achieved in the desired range at all cells.
2. Wall/ Surface Heat transfer coefficient:
The wall/surface heat transfer coefficient (HTC) distribution at the solid casing-fluid interface (inflation layer) along the domain is shown in the below contour plot:
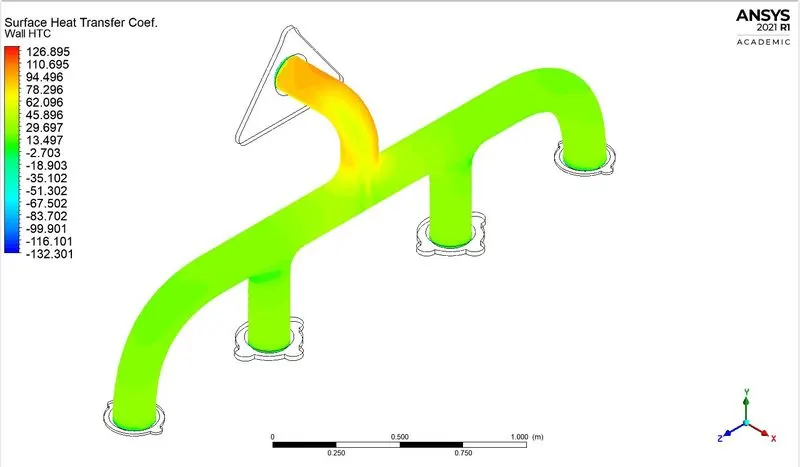
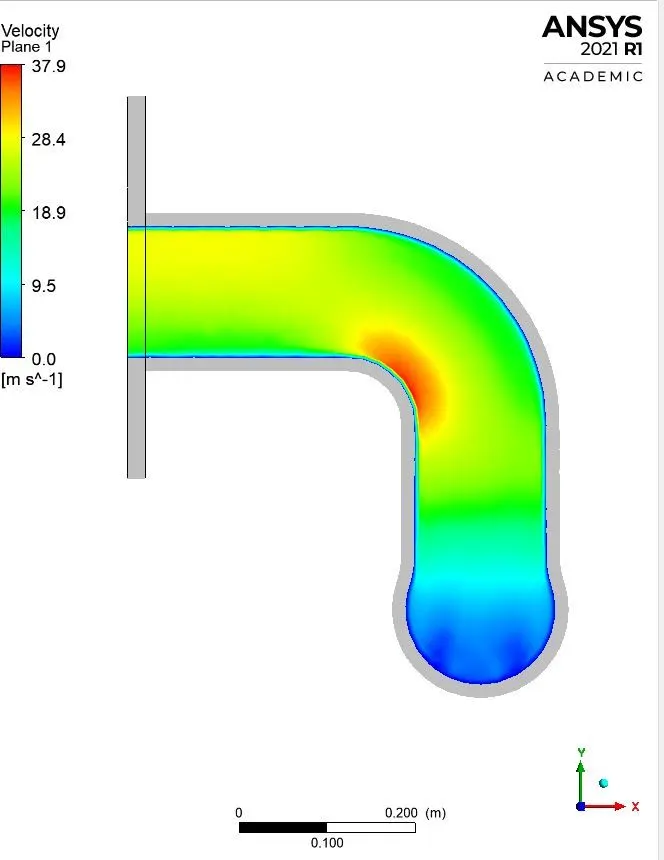
It can be seen that the HTC is around 45 W/m^2-K in most of the domain and increases at the junction near the outlet, where the flow from all the inlets meet. The maximum HTC is found to be 126.895 W/m^2-K near the outlet. The HTC is higher near the outlet because the flow rate increasing in this area due to the combining of all the flow from the four inlets due to mass conservation. The velocity and temperature contours below justify the increase of flow rate and HTC near the outlet area of the exhaust port.
 |
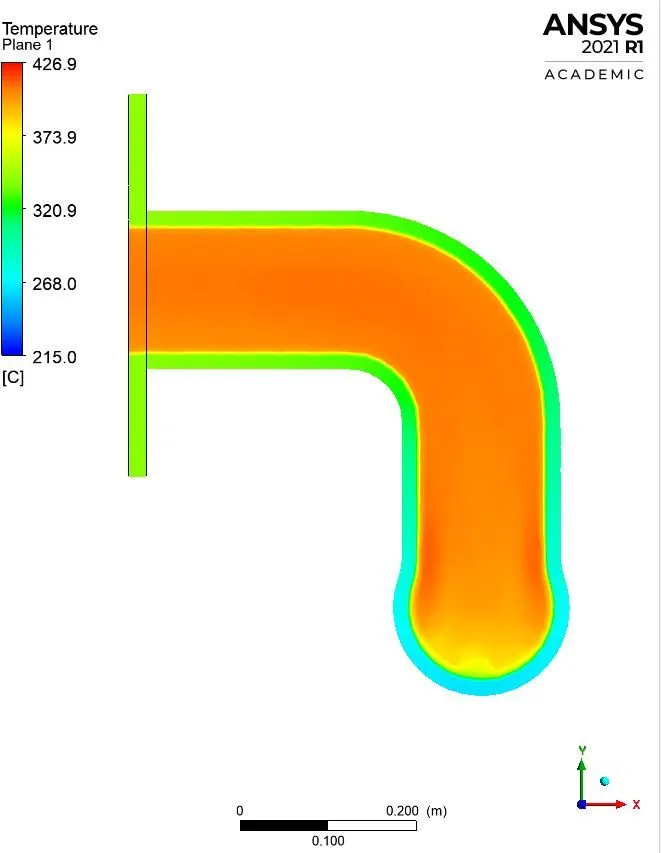 |
| Velocity profile at the midplane near the outlet | Temperature profile at the midplane near the outlet |
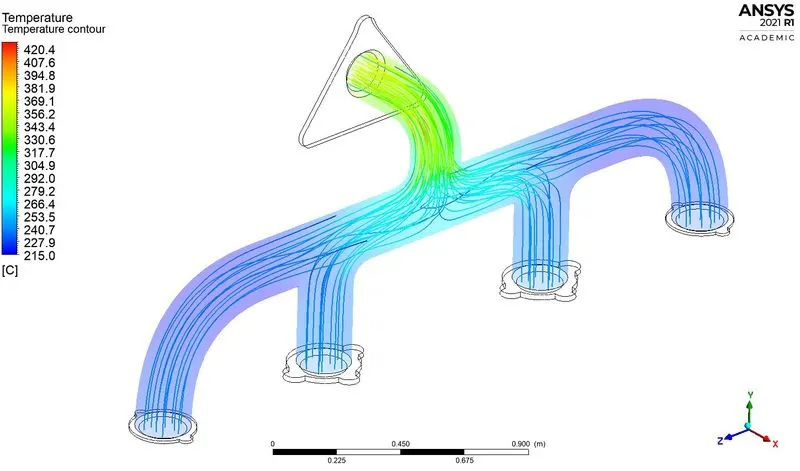 |
| Temperature distribution on the outer surface of the casing and the velocity streamlines |
The HTC values near the wall are verified by comparing the Nusselt number values from the simulations with the available analytical equations in the literature. But the analytical equations are applicable for simple geometries like a flat plate, pipes/ducts etc. But for complex geometry like the exhaust port, it is not good to compare with the results of the analytical equations. Hence experimental work can verify the HTC calculations for complex geometries and analytical verification for simple geometries.
Conclusion:
Conjugate heat transfer (CHT) analysis of a typical automobile exhaust port is carried out in this project with air as the fuel. The main objective is to study the CHT and the affecting parameters on the heat transfer at a solid-fluid interface. The CHT analysis helps in studying the heat transfer on both the solid (conduction) and fluid sides (convection). The desired Y plus is maintained near the wall-fluid interface to accurately capture the near-wall physics. The flow distribution and the heat transfer from the fluid to the Casing are evaluated in terms of flow rate and heat transfer coefficient (HTC) near the wall-fluid interface. It is observed that the wall HTC increases as the flow rate increases. This concludes that forced convection helps in achieving higher heat transfer with increased HTC values at the solid-fluid interface. Also, the thermal properties of the solid influence the solid side heat transfer.
References: