Week-4 Challenge WOT Condition Part-2
Question 1:
Aim 1: Difference between mapped and dynamic model of engine, motor, and generator
Power train block set is an advanced Simulink models of the various architectures of vehicles in which we can select the one of the architectures and simulate them in various conditions and drive cycles. But the power train block consists of two types of blocks for engine, motor, and generator
They are
- Mapped models
- Dynamic models
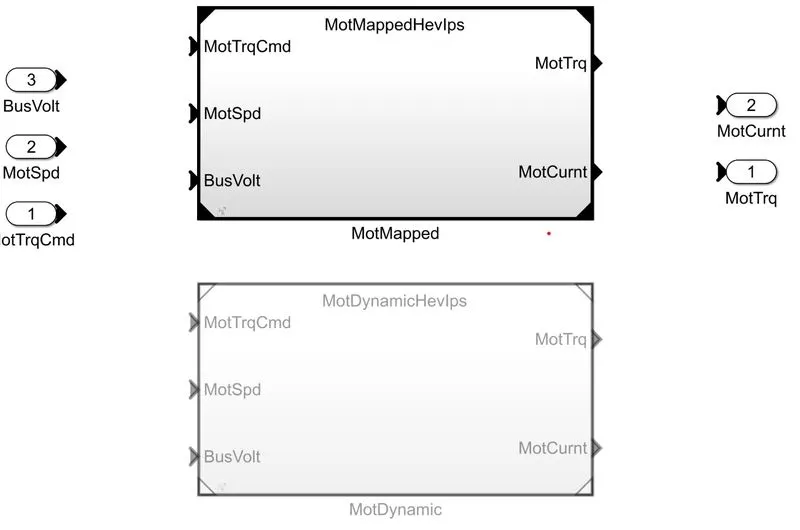
Mapped models
The set of lookup tables with predefined values of a compact size of an engine, motor, and generator.
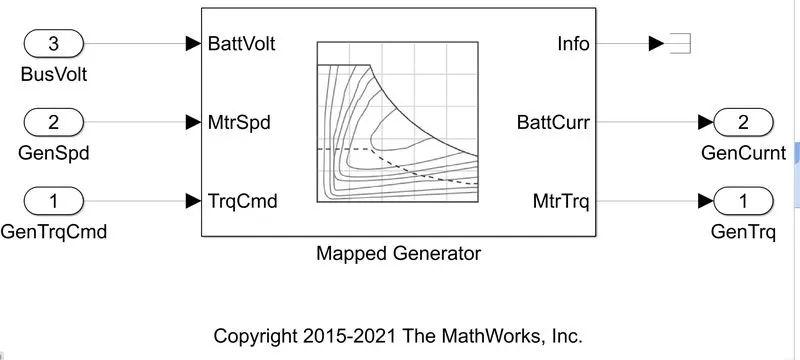
This is a very simple in which we must enter the Range as it is pre-determined. As this is also a fast process and needs very less time for simulation.
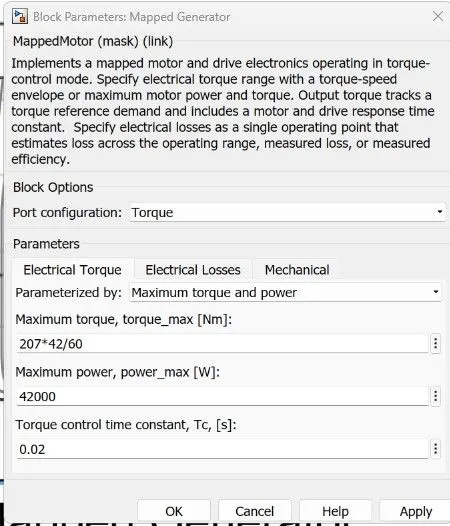
Dynamic models
Dynamic models represent the real-life models in which it does not have look up tables and predefined values. We must enter each parameter according to our need. Also, this is a dynamic model so, the time for simulation takes long depending on our system hardware speed.
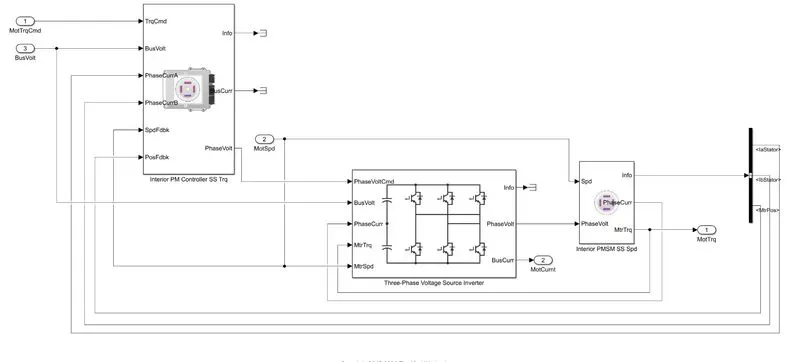
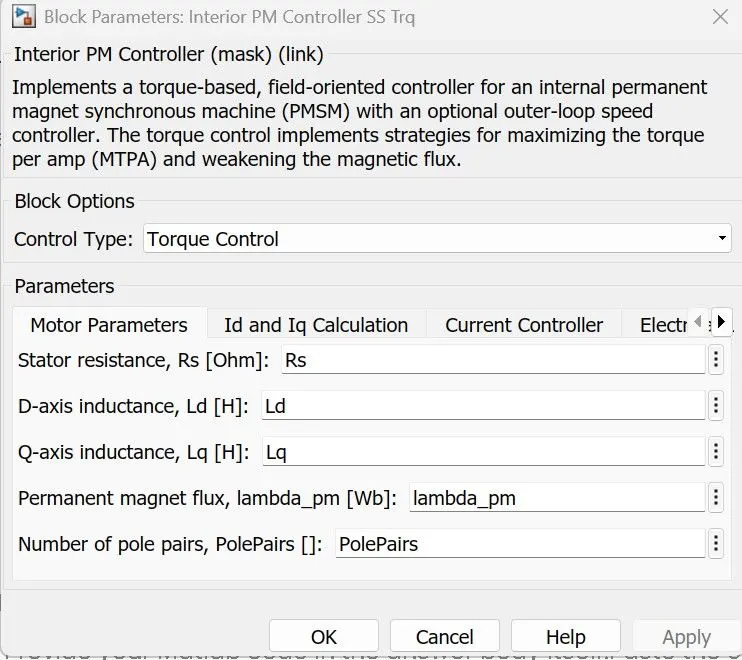
Ex: - Dynamic model of a MOTOR, if we are choosing the control type to be Torque Control, we must enter the values of stator resistance, D-axis inductance, Q-axis inductance, Permanent magnetic flux, Number of pole pairs .
Aim 2: How to change the Model Type?
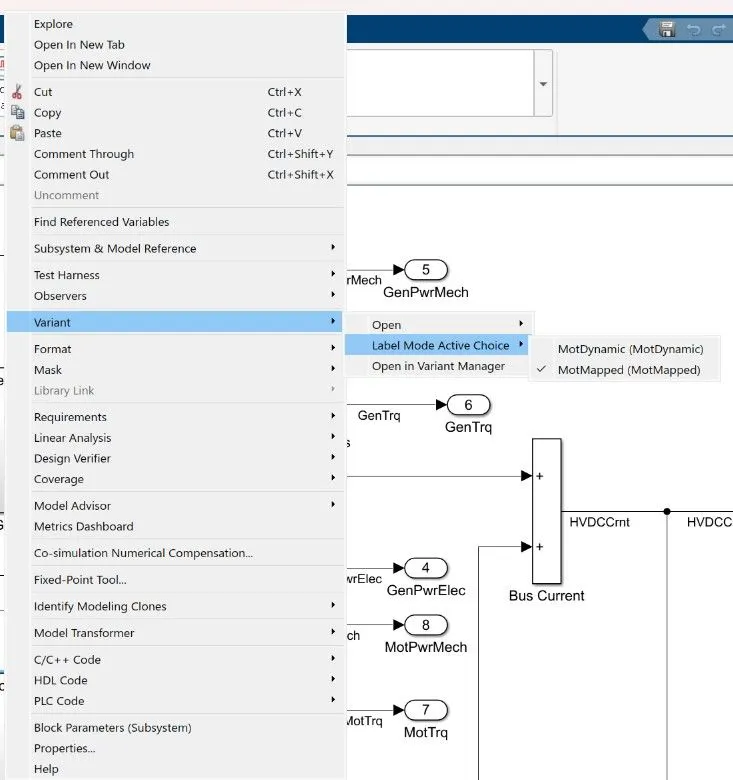
MATLAB updates its block sets frequently to the user defined. Initially the architecture comes with the Mapped model as default. We can switch the label of the system from Mapped model to Dynamic Model easily. Earlier we must load the Variant subsystem but contracts to MATLAB for its user defined updates. T switch we just have to right click on the system (Engine, Motor, and Generator) select ‘variant’ then ‘label mode active choice’ then we select the model type.
Question 2:
Aim 1: To Calculate miles per gallon in the model.
Miles per gallon is an US metric system that used to indicate the mileage of the vehicle. This calculation is done by the ‘performance calculation’ subsystem in the ‘visualization’ subsystem of the reference application. The inputs for this performance calculation block are
- Vehicle speed
- Fuel flow
- Battery Power
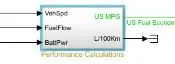
For calculation of mile per gallon vehicle speed and fuel flow is taken consideration. Battery SOC is calculated by taking Battery Power as consideration.
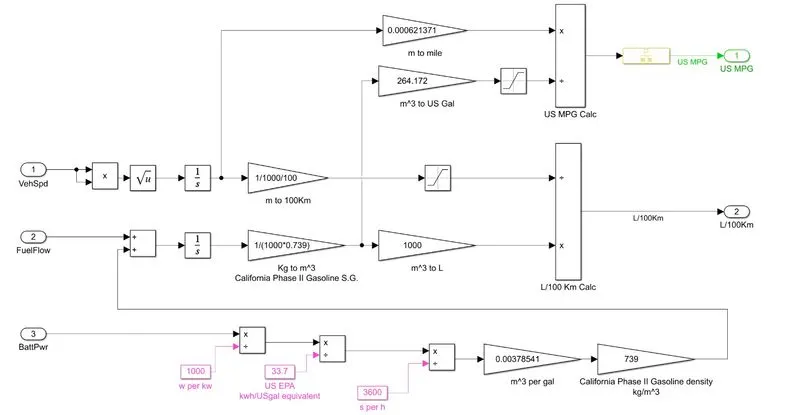
The modeling of the performance calculation is done by following formula.
`MipG = "total miles driven"/["total energy of all fuels consumed"/"energy of one gallon of gasoline"]=(("total miles driven")xx("energy of one gallon of gasoline"))/"total energy of all fuels consumed"`
Miles per gallon is calculated for number of miles a vehicle can go using the same energy as a gallon of gas (US metric system). we can also calculate L/100km in which conversions are used in the same subsystem of performance calculation.
Battery SOC is calculated as follows
`"Battery Power to Gallon equivalant" = (((("batpwr"/1000 "w per kw")/33.7 "kwh")/3600 "s per h")xx0.00378541 m^3)xx739 "kg"/m^3`
thus the every energy source is converted to gallon euivalant parameter and the miles per gallon or litter per 100km is calculated
Factors cosidered to model the Fuel flow
the Fuel flow is expressed as the amount of fuel at each moment in Kg/Sec. Now integrating this will result in the mass of the fuel and by using this 1/(1000*0.739) we convert it to the volume and multiply by 1000 to get it in Litres.
Question 3:
Aim1: To run the HEV Reference Application with WOT Drive cycle
The Power Train block set provides various model reference systems in which we choose the HEV Power split Reference Application.
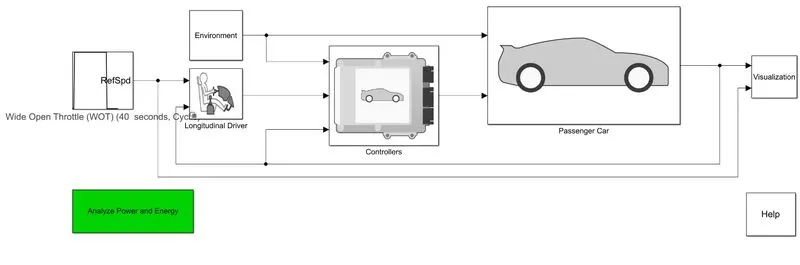
The drive cycle block is double clicked to change the type of drive cycle. By default, it is set with the FTP 75 Drive cycle. Let us change it to WOT (Wide Open Throttle) Drive cycle keeping all the defaults as same.
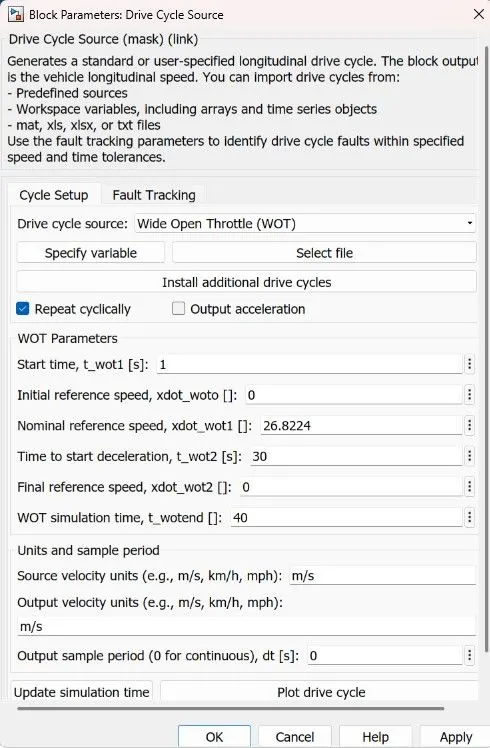
Let us run the program
The simulation takes time as the hybrid has more energy sources to calculate
the simulation results are
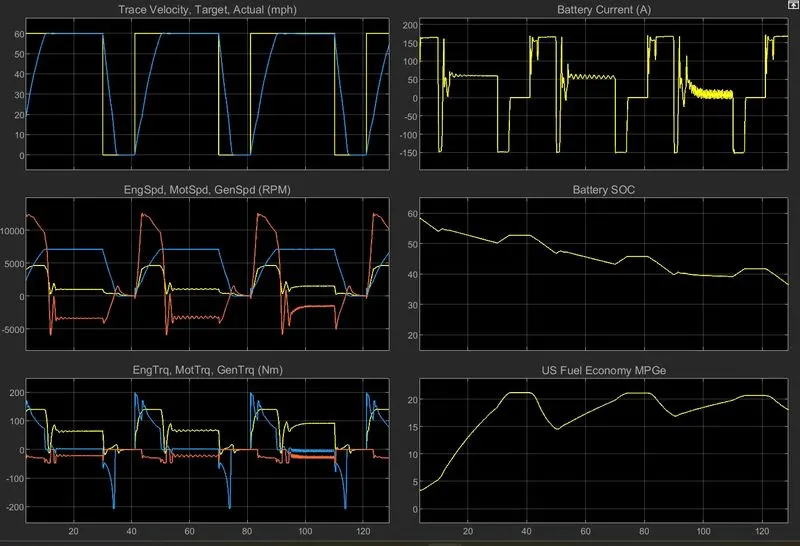
we can observe the wide open throtle response in which acceleration time is suddenly increased as it has to be.
Aim 2: change the grade and wind velocity in the environment block
Let us change the values of grade and wind velocity
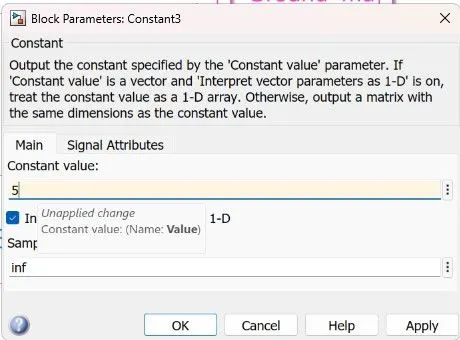
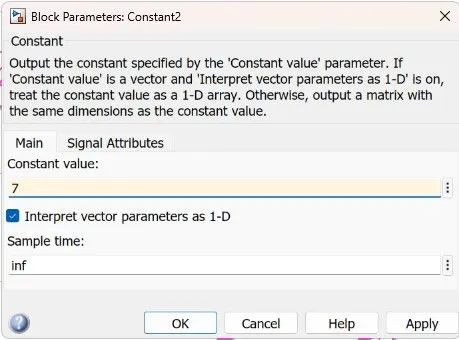
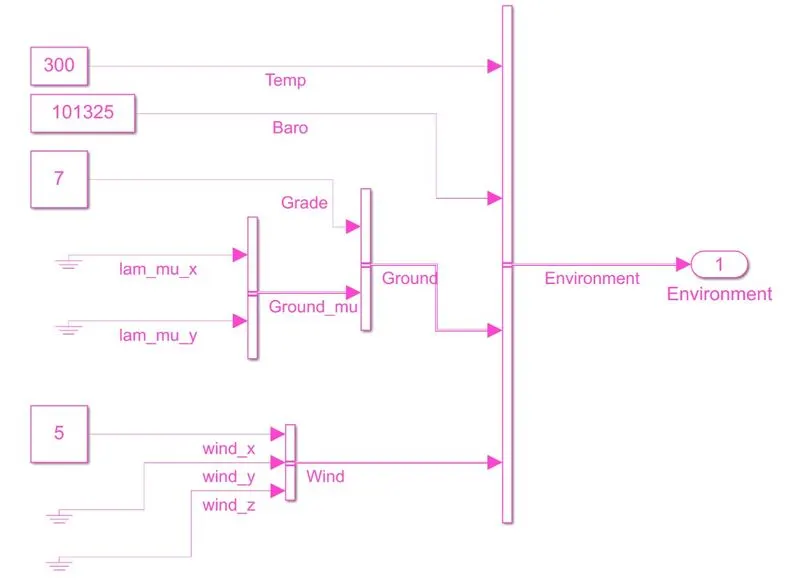
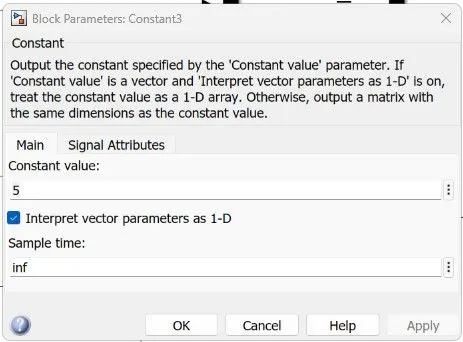
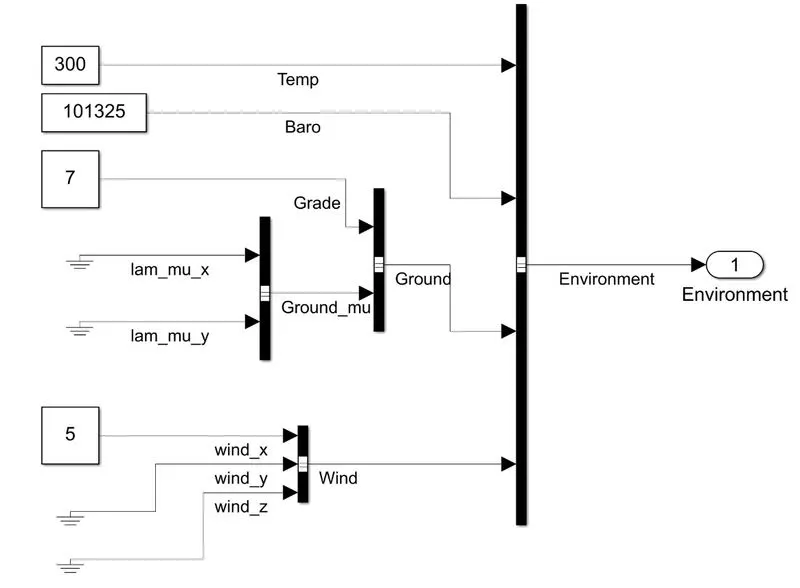
The environment block is double clicked to see the inside parameters where as the wind and grade constant blocks are there, initially they set to 0 for both of them.
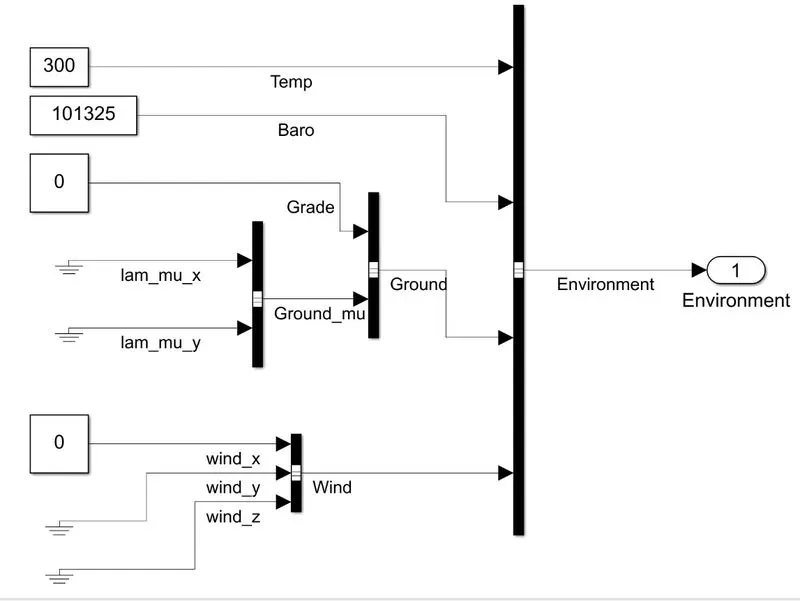
Let, G=7, w=5
Now let us run the program to see the results
for vieing the results we have to open visualization block in which it has to scopes one is performance and FE scope
which indicates the overall performance and fuel eficiency related plots
the another one is TP emissions scope which have emissions related plots
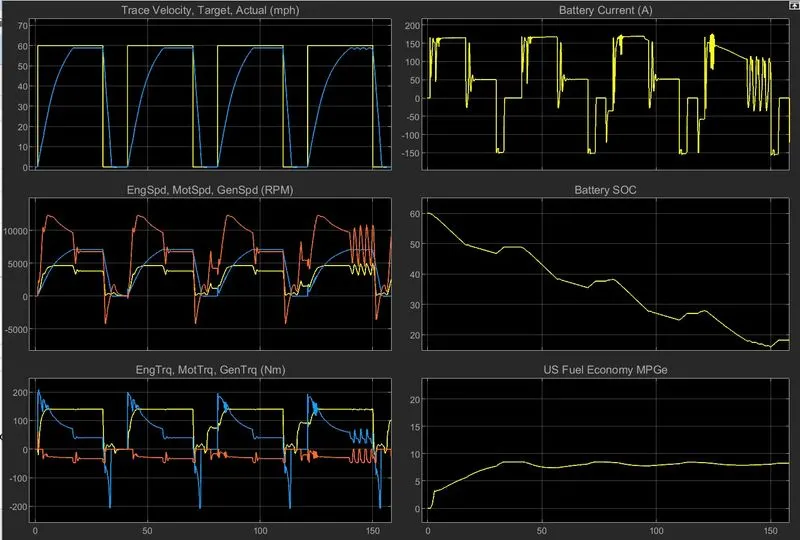
let us focus on performance and FE scope
the resuls are
Comment:
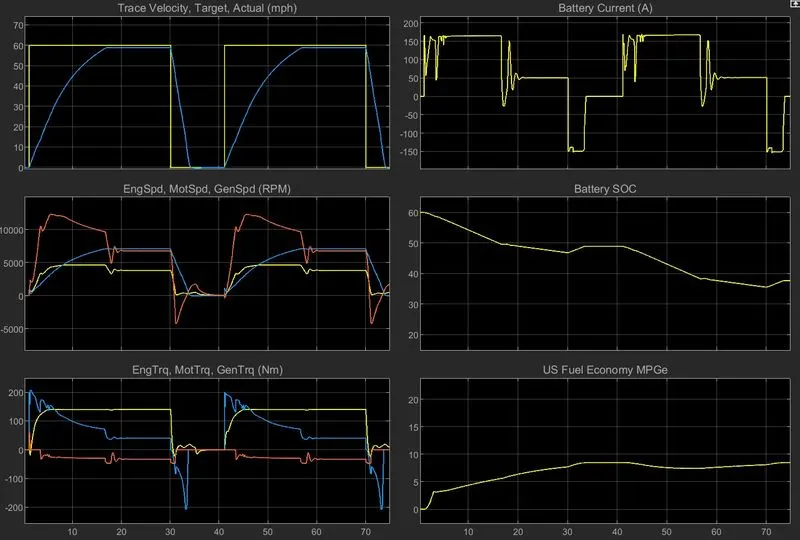
By observing the two results with WOT drive cycle, one is default one and another one is grade and wind velocity change one
by comparing both the results
the velocity curve has increase in slope as the default one have an edge cuve
there is a slight lag in speed segment(ENGSPD, MOTSPD, GENSPD) and also the torque segment has increase in spikes
we can observe the gradual decrease in BAttery current, Battery SOC, and US Fuel Economy are much faster when compared to the default one
the change in grade and wind velocity effect various parametrs.
Question 3:
Aim: Keeping All the other Parameters same compare the simulated results of HEV and EV reference applications
Keeping all the Parameters same the above reference application is considered
The above reference application is HEV Power split Reference Application with WOT(Wide Open Throttle) Drive Cycle and also modified environment block parameters like grade 7 and wind velocity 5
the result is
Now Considering the above equation and comparing it with EV reference application for that
EV reference Application is opened, matching all the parameters same with the above mentioned HEV Power split Reference Application
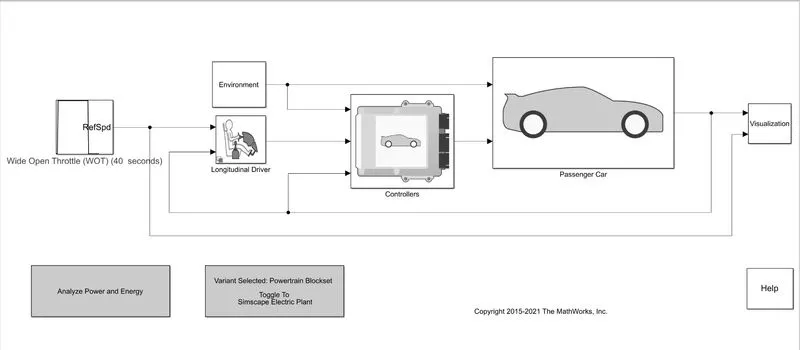
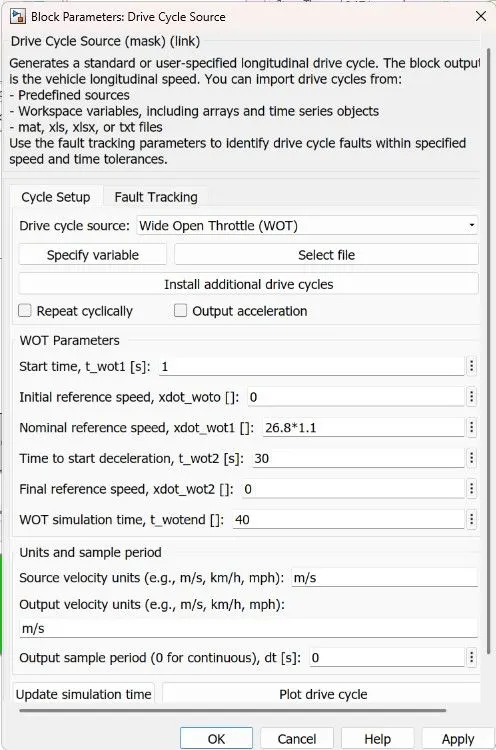
Drive cycle changed to WOT(Wide Open Throttle) Drive cycle
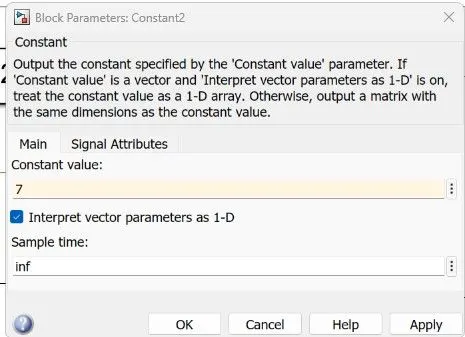
Environment block parameters
Grade G = 7
Wind velocity = 5
Now lets run the simulation it wont take that much time when compared to HEV as it has single energy source.
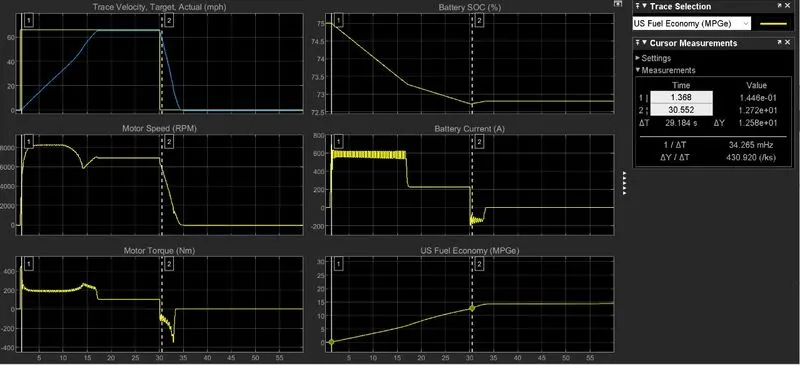
the results are shown in visualization block now it has only one scope which is performance and FE scope and it has no Emmision scope as it doesnt apply for an EV
the reasults are
Comparision:
If we compare both HEV and EV plots
- when comparing the velocity plots EV reference takes more time compared to HEV reference
- when comparing Battery SOC EV reference has more decrement line compared to HEV
- EV consumes more current than HEV
- as EV has the only energy source which is battery
- miles per gallon for EV is more when compared to HEV
- Motor Torque seems to be same may be a slightest defference which is not considerable.
Conclusion:
- The difference between Mapped and DYnamic models are explained.
- How to change the model is explained.
- The miless per Gallon calculation is explained.
- The major factors include in fuel flow model is explained.
- HEV Reference Application with WOT Drive cycle is simulated.
- The Environ ment block Parameters like Grade and wind velocity is changed and simulated results are compared.
- EV Reference Apllication is simulated and the results are compared with the above HEV Reference APllication Keeping all the parameters same.
- I conclude that Power Train block set provides an variety of features to test a vehicle under various parameters and conditions
- A good tool for Automobile modelers, EV engineers, etc.,