Final Project: Electric Rickshaw modelling
Aim: To create a detailed model of an electric rikshaw(three wheel passenger vehicle)
Objectives: By Calculating the Forces acting on a vehicle by using Excel spread sheet and calculate power required by the motor so that we can desighn the motor and H bridge as well as the pwm generator. The longitudanal Driver which acts as an controller to generate acceleration and deceleration commands, A lithium ion battery of 200Ah rating battery is fed to the Motor. three drive cycles used as velocity reference to calculate the distance traveled, temparatures of the converter and Motor, State of charge percentage of the Battery for three different drive cycles and finally estimate the three parameters for 100km with 45kmph constant speed for the three drive cycles.
Theory: Electric rickshaws (also known as electric tuk-tuks or e-rickshaws or toto or e-tricycles) are small 3-wheeled vehicles powered by an electric motor and battery ranging from 650 to 1400 Watts. They save on fuel costs compared to auto rickshaws while offering greater ease-of-use than pulled rickshaws. This has led to their popularity and widened-acceptance in some cities since 2008.If introduced in a systematic manner, electric rickshaws could be a low-emitter complementary transport for low-income people who suffer most from a lack of transport facility. They are mostly manufactured in India and China.These rickshaws have a mild steel tubular chassis, consisting of three wheels with a differential mechanism at the rear wheels. The motor is a brushless DC motor. The electrical system used in Indian versions is 48V and in Bangladesh is 60V. The body design from the most popular Chinese version is of very thin iron or aluminum sheets. Bodies made of fiberglass are also popular because of their strength and durability, resulting in low maintenance. Body design is varied from load carriers, passenger vehicles with no roof, to full body with windshields for drivers' comfort.It consists of a controller unit.They are sold on the basis of voltage supplied and current output, also the number of mosfet (metal oxide field effect transistors) used. The vehicle's batteries are typically lead acid with a lifespan of 6–12 months. Deep cycle batteries designed for electric vehicles are rarely used. Weight of the electric car has also been a recurring design difficulty in them.
Block diagram of an electric rikshaw:
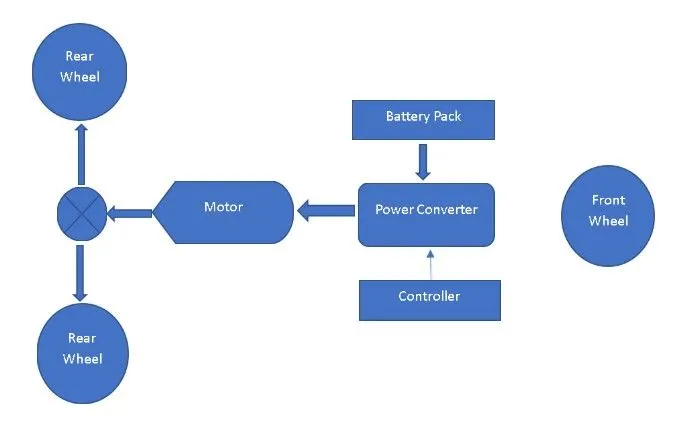
we can observe the conceptual block diagram of an electric rikshaw
the actual erikshaw made by mahindra named treo
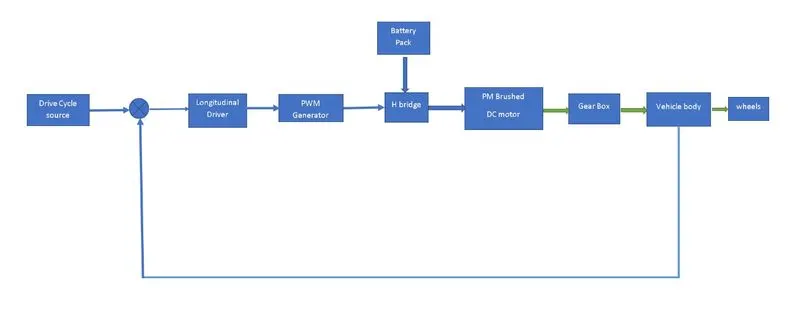
Drive Train of an Electric rikshaw
Forces Acting on a Vehicle:
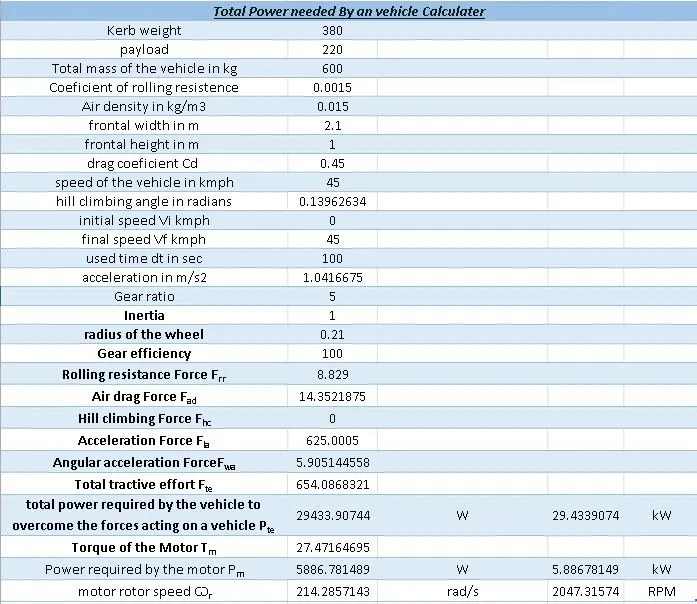
The Various forces acting on a vehicle are calculated and power of the motor is estimated
Model Parameters:
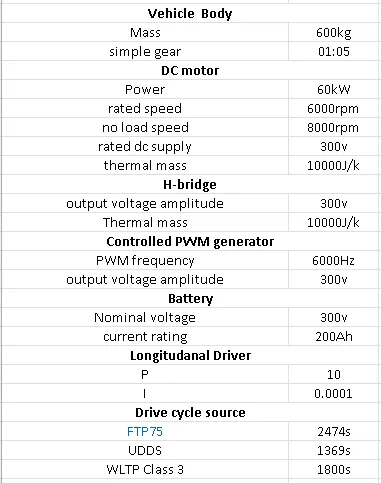
System level Configaration:
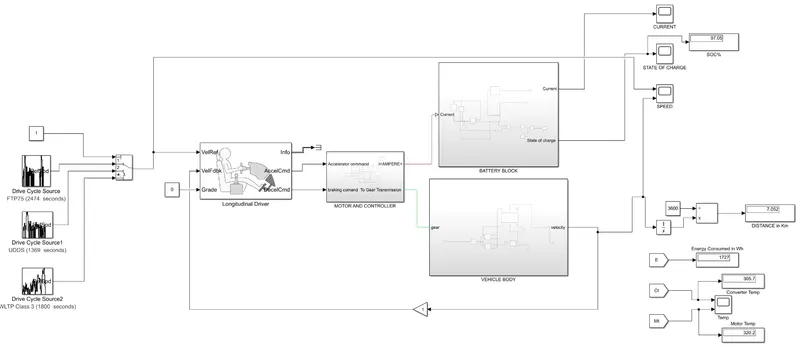
In the simulation model we can observe that the modeling is done according to the Drive train
let us see the motor and converter subsystem
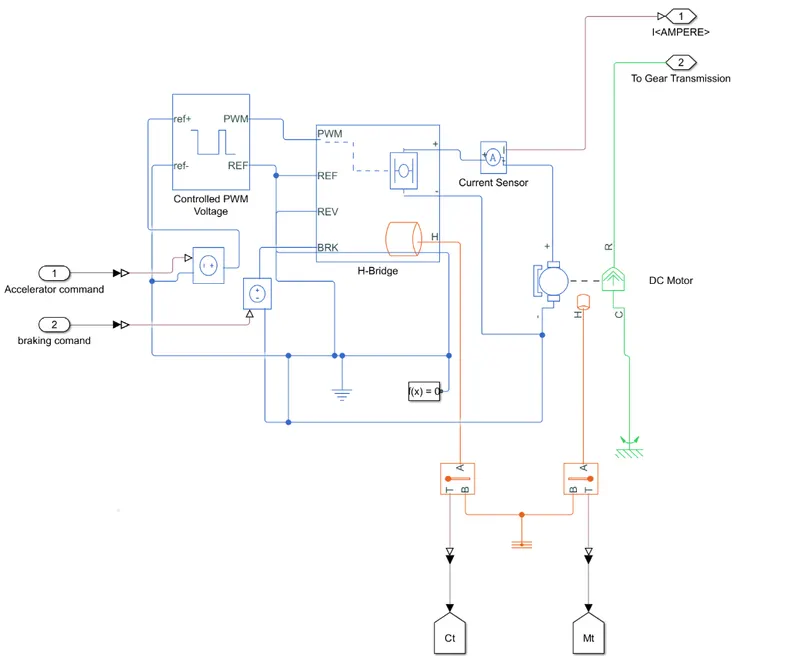
the longitudanal driver block acts as an controller that can generate the acceleration and deceleration commands for controlled pwm generator which is fed to the H bridge for the proper firing angle to the igbts and the h bridge feeds the permanant magnet DC motor
the two temparature measurements block attached to the motor and the converter in which the initial temparature is 300kelvin
the subsytem of battery is
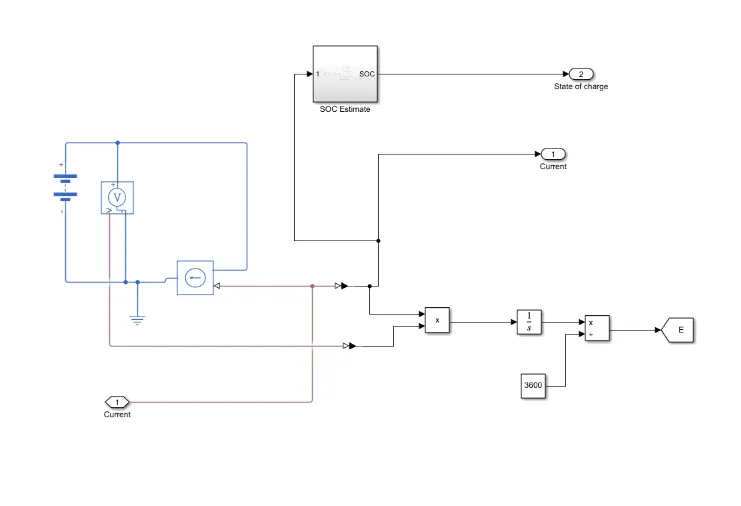
we can see the battery is fed from controlled current source in which the refernce current is taken from H-bridge to measure the current being utilised and the soc%
to measure the soc% i used following formula
`"soc"%=(intI/(Ahxx3600))xx100`
to measure the energy consumed
`E_c=intP/3600`
where P is the power of the battery
let us see the vehicle body
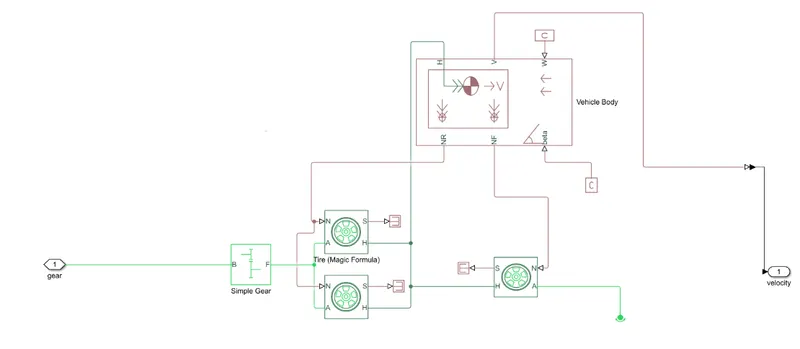
the vehicle body with total mass of the vehicle 600kg
with three wheels
the rear wheels are connected with the motor with the simple gear
the front wheel is connected to rotational free end to move freely
Results:
let us see the results with the FTTP75 drive cycle as velocity reference
velocity reference and vehicle velocity
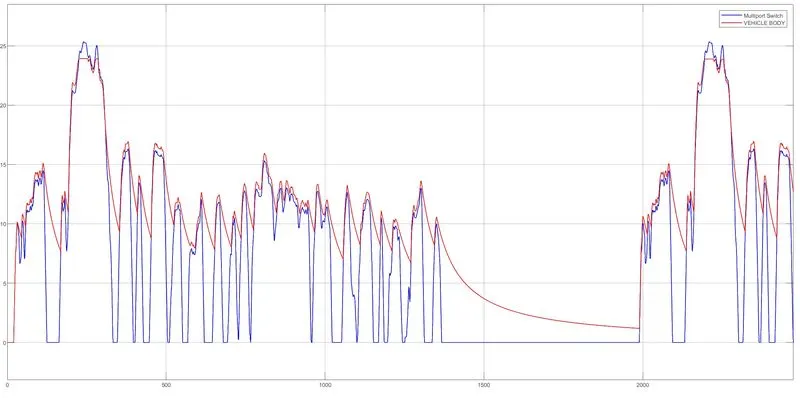
we can observe the above figure with velocity reference in blue colour abd vehicle velocity in red colour almost synced but we are applying only electrical breaking if we apply mechanical breaking at the same time we can achieve the 100% sync with the drive cycle source velocity reference
Battery current and the soc%
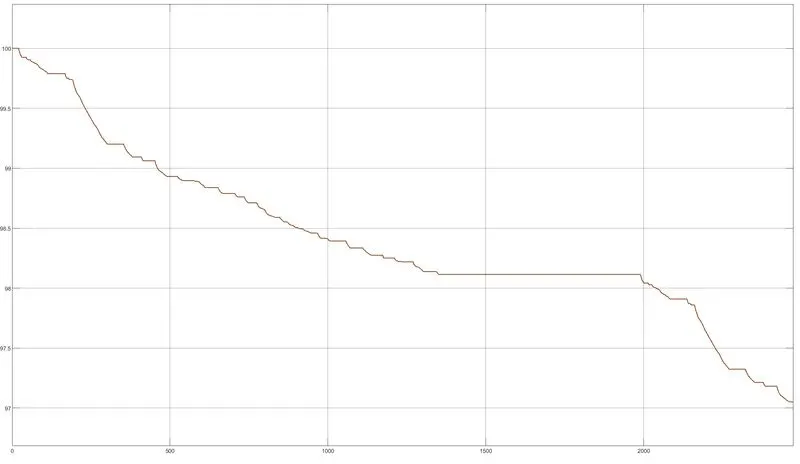
we can observe the gradual drope of soc% from 100% to 97%
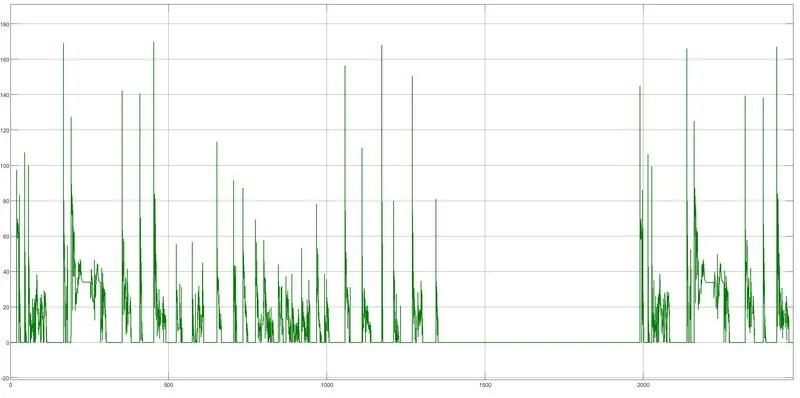
we can observe the spikes in the current during the acceleration and drop at deceleration
let us see the gradual increase in temparature of the converter and motor
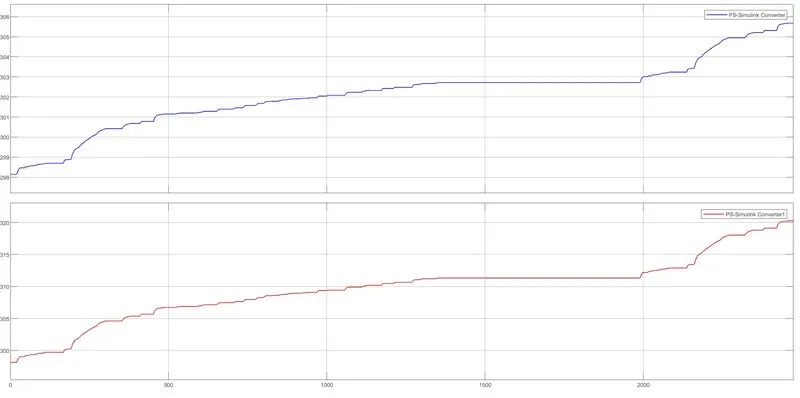
the initial temparature is 298.7 so we can see the increase in raise of the temparature
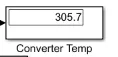
we can observe the converter temparature
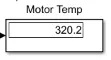
we can observe the motor temparature
let us see the simulated results of UDDS cycle
the velocity reference and vehicle velocity
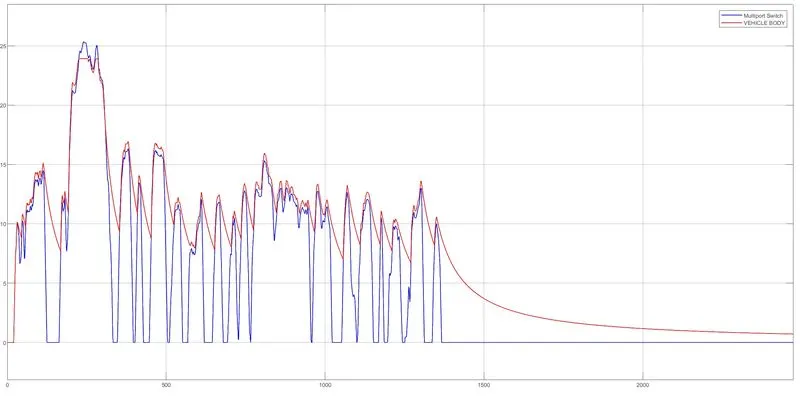
as well the blue line indicates the velocity reference and red line indicates vehicle velocity
let us see the battery current
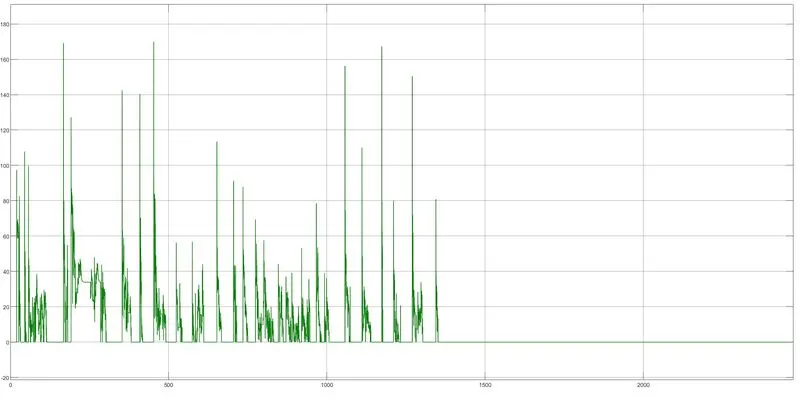
let us see the soc%
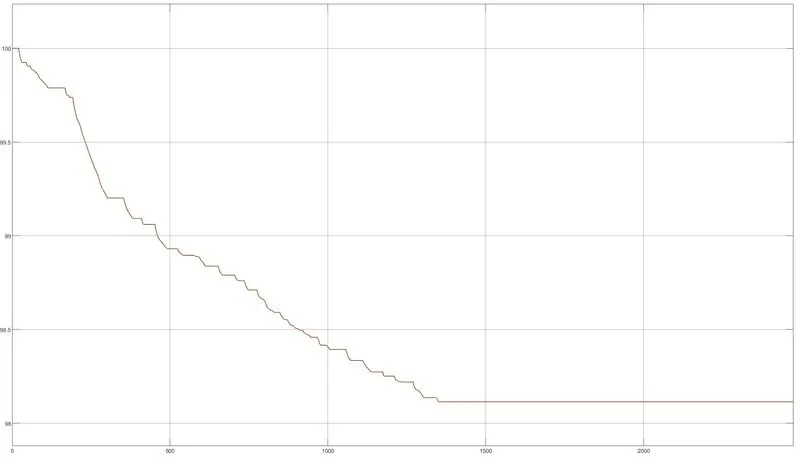
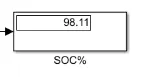
we can observe the gradual decrease in soc% in scope as well as exact soc% in display
let us see the temparatures of motor and converter
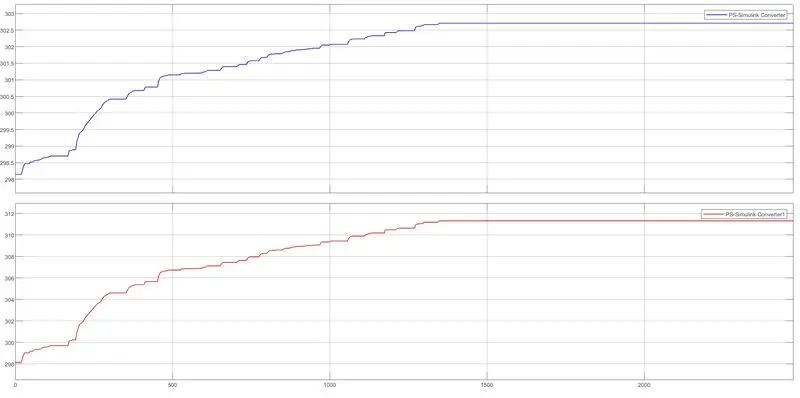
we can observe the gradual increase in temparature
let us see the displays
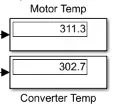
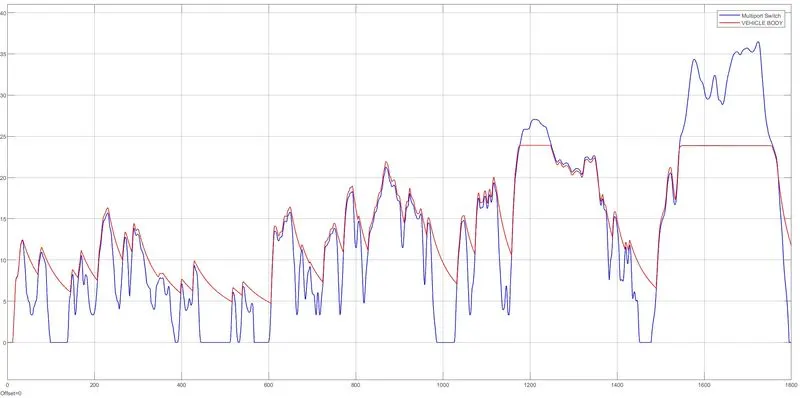
let us see the simulated results of WLTP Class 3 drive cycle
velocity reference and vehicle velocity
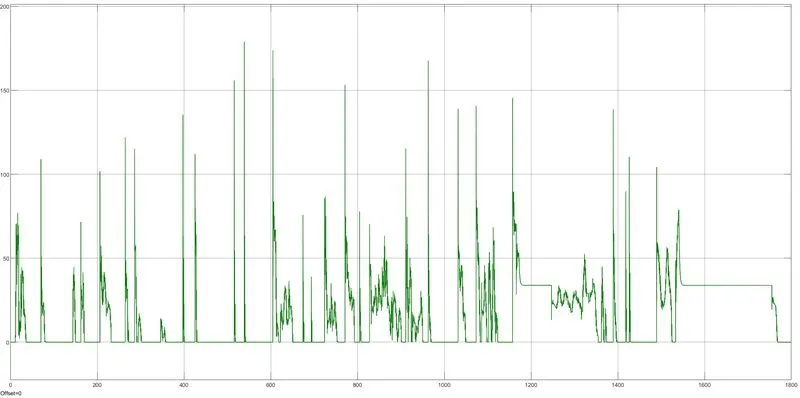
let us see the current
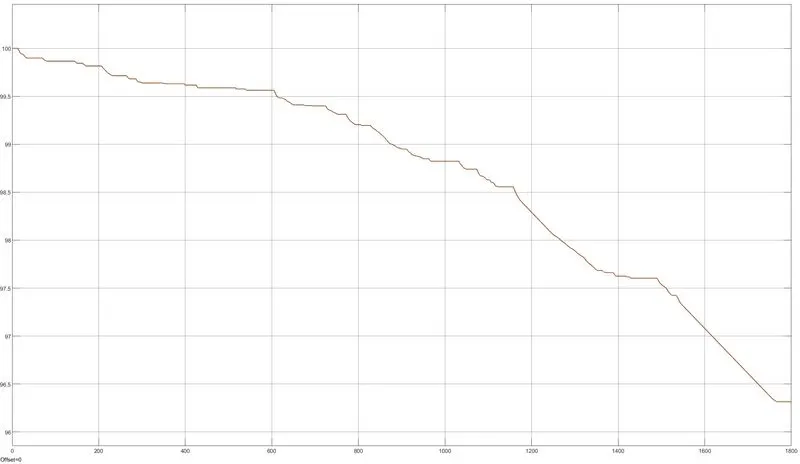
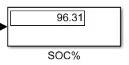
let us see the soc%
let us see the temparatures of motor and converter
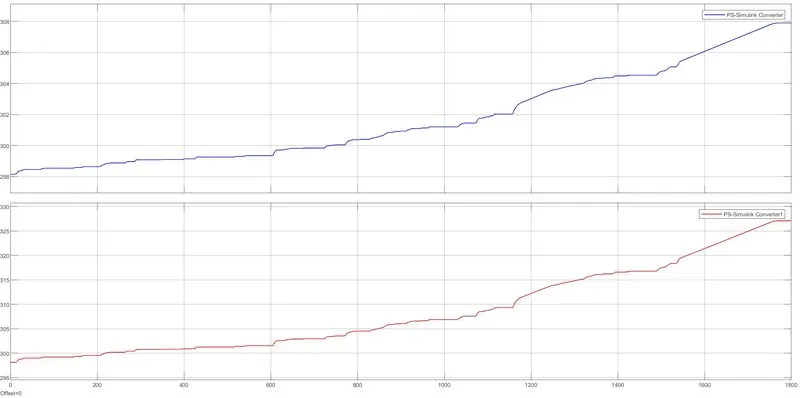
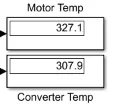
although the WLTP Class 3 cycle is 1800s which is smaller than FTP75 but it consumed more current and soc% is also low when compared to FTP75 this iss because it has more acceleration points than FTP75
now let us create a tabular format in excel spreadsheet to calculate energy consumed by the vehicle in three driving cycles
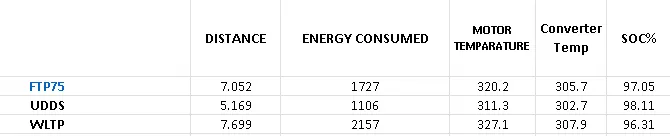
the above table shows the distance covered by the vehicle during the drive cycle, energy consumed , motor temparature and converter temparature, state of charge percentage of the battery in three drive cycle sources
let us calculate all the parameters for 100km by assuming 45kmph constant speed
without variation in the speed i assumed and concluded with the following formulas to estimate the parameters for 100km by the above table
energy consumed for 100km
`(100km)/("distance covered in drive cycle")xx("energy consumed in the drive cycle")`
Motor temparature for 100km
`"initial temparature of the motor"+(100km)/("Distance covered during drive cycle")xx("Motor temparature during the drive cycle"-"initial temparature of the motor")`
Converter temparature for 100km
`"initial temparature of the Converter"+(100km)/("Distance covered during drive cycle")xx("Converter temparature during the drive cycle"-"initial temparature of the Converter")`
SOC% for 100km
`"initial soc%"-(100km)/("Distance covered by the vehicle during drive cycle")xx("initial soc%"-"SOC% during the drive cycle")`
let us use the above formulas in excel spread sheet and calculate the four parameters for three drive cycles for 100km

we can observe the energy consumed in Wh
Motor and Converter temparature in kelvin
press on the link for excel spred sheet
Conclusion:
An Electric Rikshaw (three wheeled passenger vehicle) is designed using a Permanant megnet DC brushed Motor and a lithium ion battery with three different drive cycles namely FTP75, UDDS, WLTP Class 3. and also calculated energy consumed by the motor , motor temparature. converter temparature, state of charge percentage of the battery for each drive cycle. Later on by depending on the parameters we got we assumed formulae for energy consumed , motor and converter temparature, state of charge percentage for 100km by assuming 45kmph as constant speed and tabulated each and every parameters used, assumed and calculated in Excel spreadsheet and attached.
Simulink model files link:
https://drive.google.com/file/d/10jD9FvoTBNkv5CudMrG-6xBRE2OFW2lh/view?usp=drivesdk