Week-4 Challenge WOT Condition Part-2
EV BATCH 17
aim:To study and describe the follwing along with the given condition.
objective:1 What is the difference between mapped and dynamic model of engine, motor and generator? How can you change model type?
Mapped:
Model uses a set of steady-state lookup tables to characterize engine performance.
The tables provide overall engine characteristics, including actual torque, fuel flow rate, BSFC, and engine-out exhaust emissions.
-
If you have engine data from a dynamometer or a design tool like GT-POWER.
-
For quasi steady-state engine simulations.
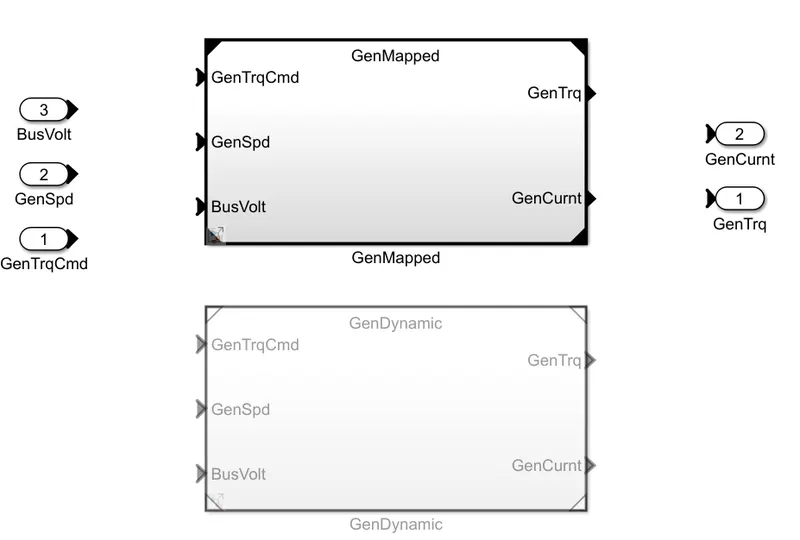
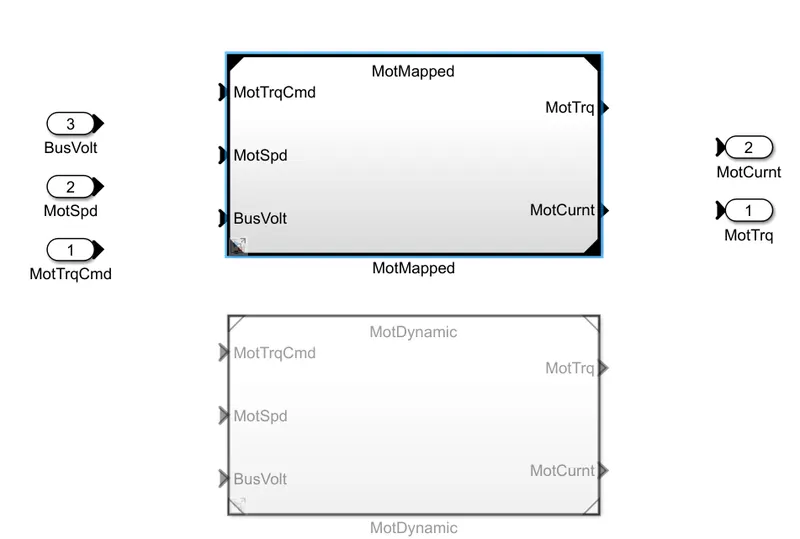
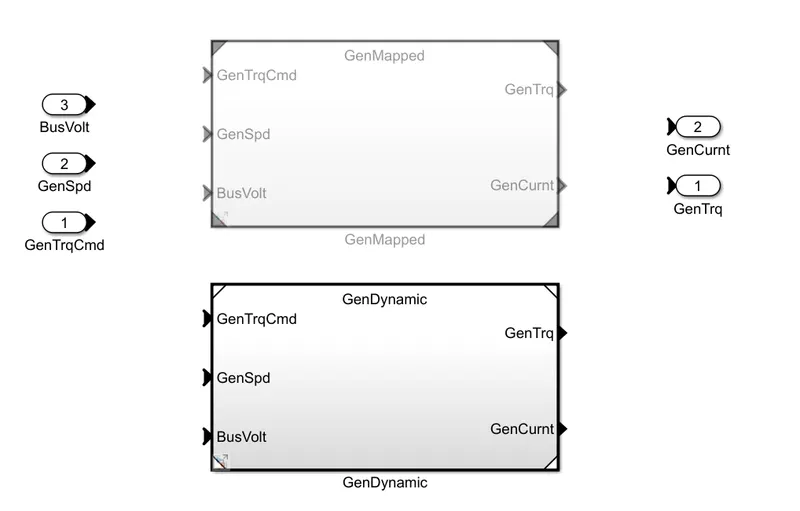
Figure(1)
- Figure (1) shows the mapped model of motor and generator.
mapped model:
- In mapped model data points are pre-assigned in lookup table which would be configured with the operational parts and the analysis would be formed.
- model uses a set of steady-state lookup tables to characterize the engine performance.
- output values are started for the given corresponding input values of the motor,generator and engine.
- The accuracy is low for this system.
- Run time simulation takes less time,because it doesnot run with real time simulation.
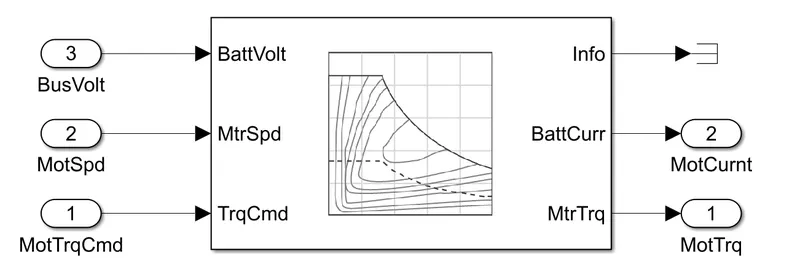
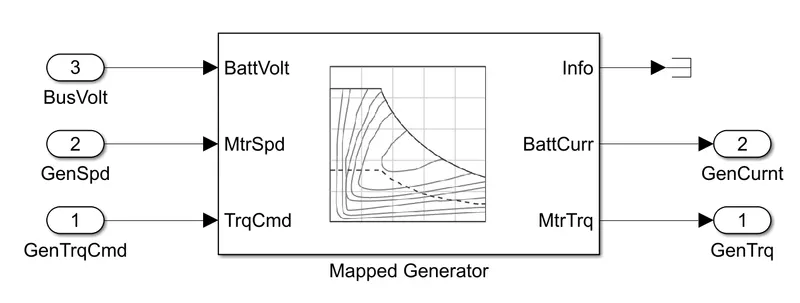
Figure(2)
- Figure 2 shows the mapped model.
Dynamic:
Model decomposes the engine behavior into engine characteristics that are separated into lower-level components. By combining components in this way, the models capture the dynamic effects.
-
If you need a more detailed dynamic model and have component-level data.
-
To analyze the impact of individual engine components on the overall performance.
dynamic model:
- dynamic model shows the runs by real time simulator.
- dynamic model uses the combination of output from various subsystems to generate the output.
- The accuracy of dynamic model is very high.
- run time simulation takes more time.
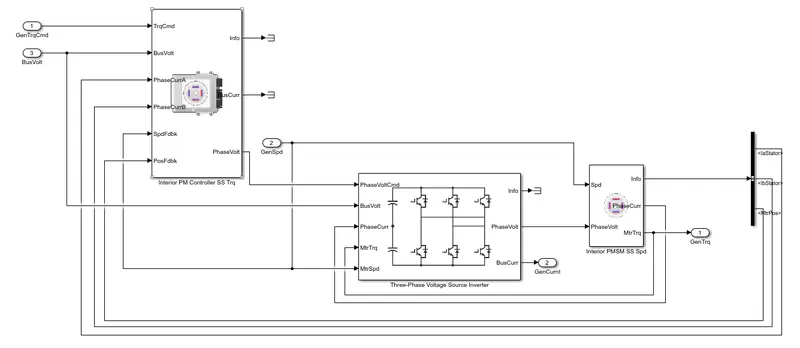
Figure(3)
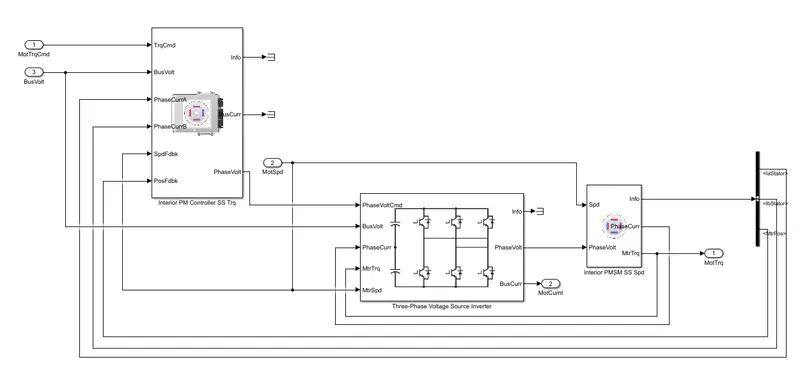
Figure(4)
Figure (3) and (4) shows the dynamic model.
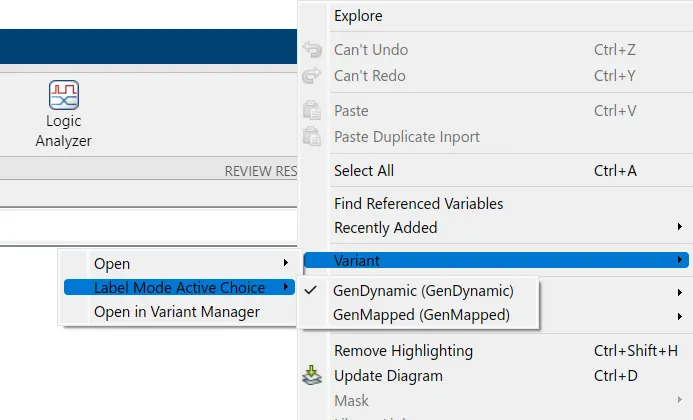
Steps to change the model:
1) select the vehicle type in power train blockset model.
2)Go to the paasenger block in the simulink model of Electrical vehicle motor/generator.
3)Right click on block and goto variance label mode active choice motorGenEV mapped or dynamic.
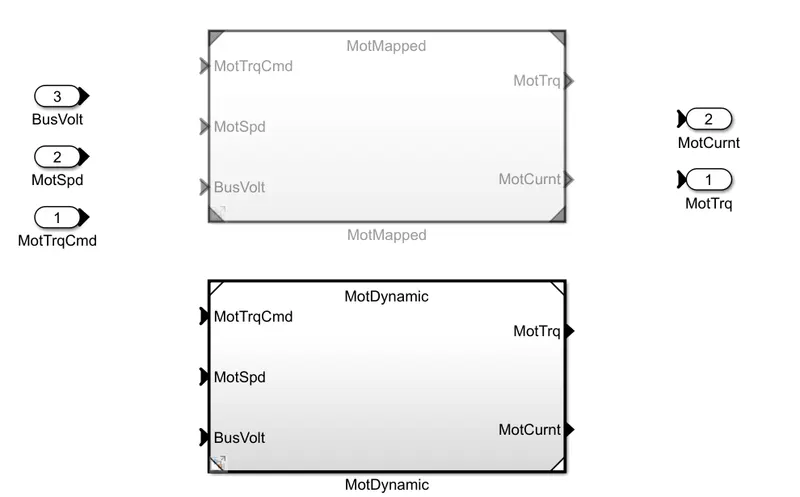
objective:2 How does the model calculate miles per gallon? Which factors are considered to model fuel flow?
- In vehicle miles per gallon tells that energy which is equalent that of a engine powered to propel a car through a distance.
- miles per gallon=miles Travelled/Gallons took to refill the tank.
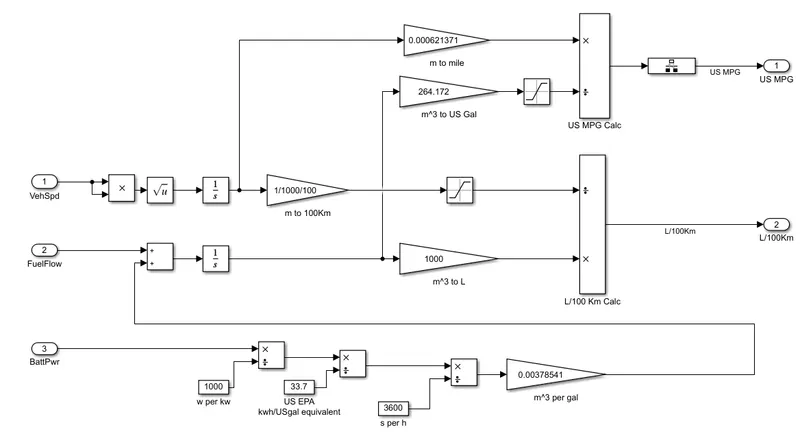
- for calculating the miles per gallon to the model is based on the velocity of the vehicle
- the distance is measured.
- The measured distance is converted to miles by considering the gain factor.
- To calculate the amount of fuel consumed,both the power consumed by the engine and motor are consider.
- From Engine,the rate of fuel consumption is assumed
- on the battery side the power is converted into kw.
- the power produced by US equivalent galon.
- the output is converted into hour so divide by 3600 the volume is calculated.
- both the fuel consumed volume and equivanlent fuel of battery power consumed is added to obtain the volume of fuel consumed.
- By dividing total miles with total volume of fuel to get the miles per gallon.
- Figure (5) is represent the block arrangement for miles per gallon calculation.
Figure(5)
factor considered to model fuel flow:
1.Battery Power.
2.Fuel flow rate from the engine.
objective:3 Run the HEV ReferenceApplication with WOT drive cycle. Change the grade and wind velocity in the environment block. Comment on the results.
- hybrid electric vehicle which is running in the combination of two power sources here we used a battery and engine.
- The below figure represents the hynrid electric vehicle.
- In the hybrid electric vehicle powertrain blockset has been used.
- Wide open Throttle (WOT)drive cycle used.
- The below simulink model is the WOT deive cycle of hybrid electric vehicles.
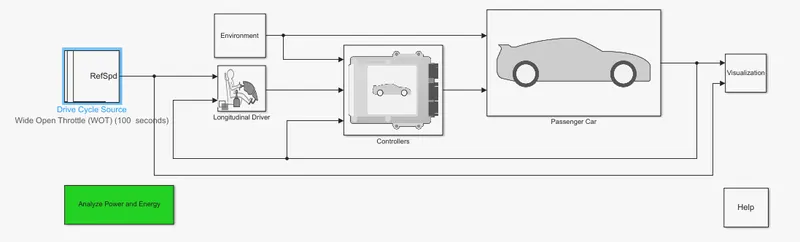
- after choosen the drive cycle source update the simulation time and running the simulation.
- observe the scope given below.
case:1
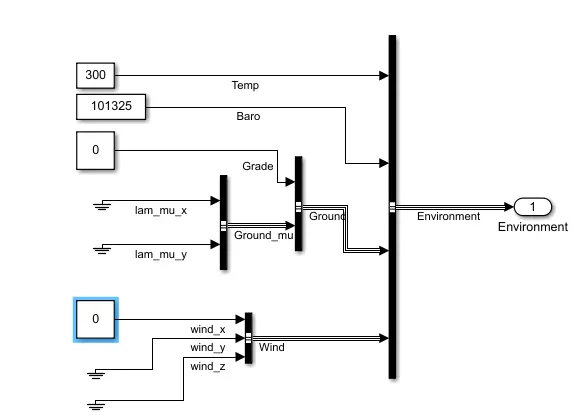
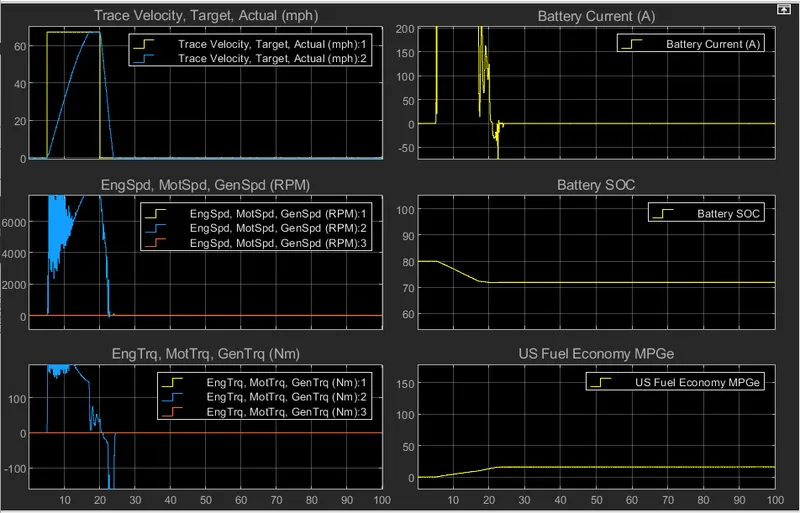
The below figure shows the grade is 0 as well as the wind velocity is 0 with the cycle time of 100s.
plots:
observations:
plot1:Trace velocity,target,actual(mph)
- around 19.8s to reach the maximum speed of 67.1mph.
- 3.9s aprroximately reaches the speed to 0mph.
plot:2(battery current)
- it shows the current values of battery varies from 500 to 0amps as well as varies from 0 to -200 amps in regenerative braking.
plot3:(eng speed)
- maximum speed of the motor is approximately around 9500rpm.
plot:4(battery SOC)
- it shows the battery SOC.
- SOC decreased from 80 to 62% increased during the normal condition and approximately 75% during the regenrative braking.
plot5:(Eng trq)
- The maximum torque of 300 Nm
plot6:(fuel economy)
- it shows the fuel economy.
- maximum fuel economy is 20mpg.
- minimum fuel economy is 7.2mpg.
case:2
grade angle of 5 with the wind velocity 5.
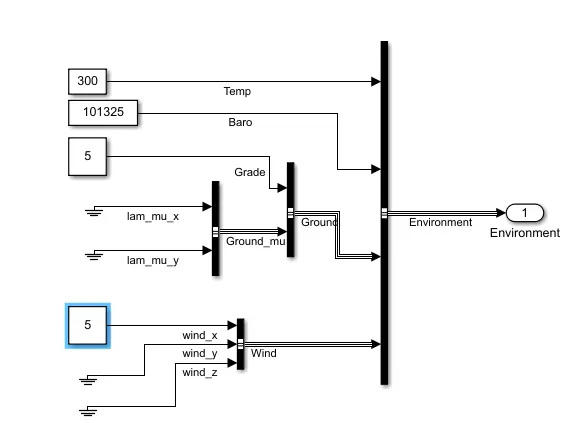
The below scope is represent the output parameters.
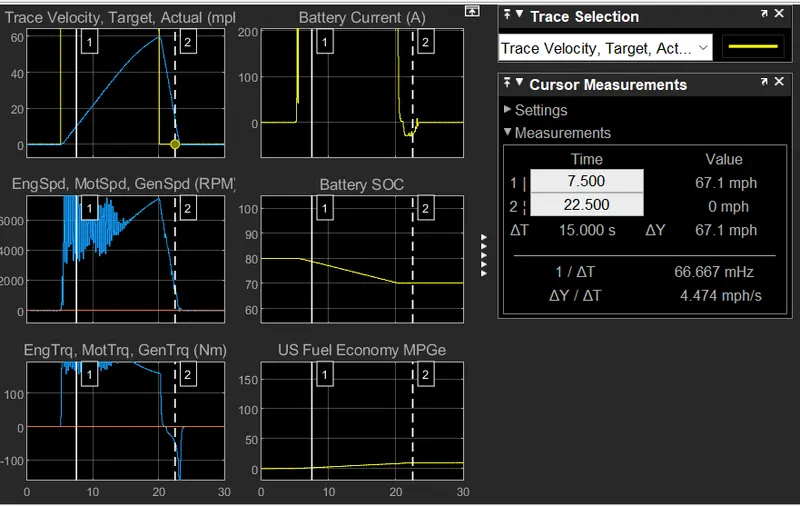
plot1:Trace velocity,target,actual(mph)
- approximately around 20s to reach the maximum speed of 67.1mph.
- 5.25s aprroximately reaches the speed to 0mph.
plot:2(battery cuurent)
- it shows the current values of battery varies from 200 to 0amps braking.
plot3:(eng speed)
- maximum speed of the motor is approximately around 8200rpm.
plot:4(battery SOC)
- it shows the battery SOC.
- SOC decreased from 80 to 70% increased during the normal condition.
plot5:(Eng trq)
- The maximum torque of 290 Nm.
plot6:(fuel economy)
- it shows the fuel economy.
- maximum fuel economy is 20mpg.
objective:4 Keeping all other parameters same, compare the simulated results of hybrid and pure electric powertrains.
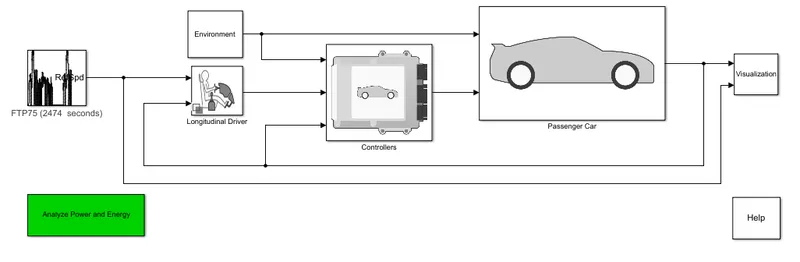
The total model of the vehicle is same for the pure electric vehicle and hybrid electric vehicle.
In hybrid electric vehicle there are two energy sources which is engine and battery.
Pure electric vehicle,there is only one energy source which is battery only.
figure (2)and figure(3) represents the power train blockset of the ev and hev.
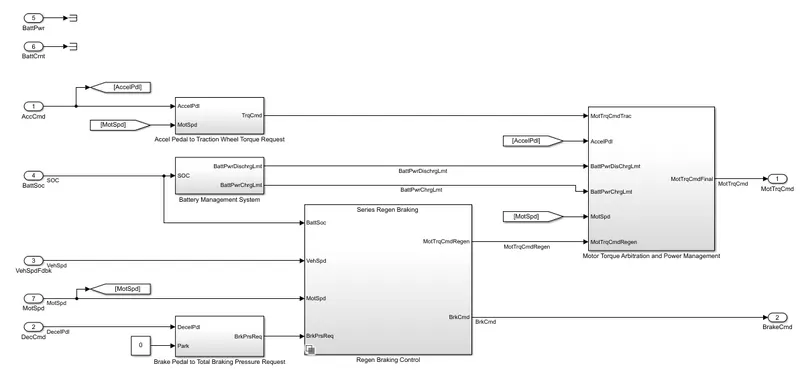
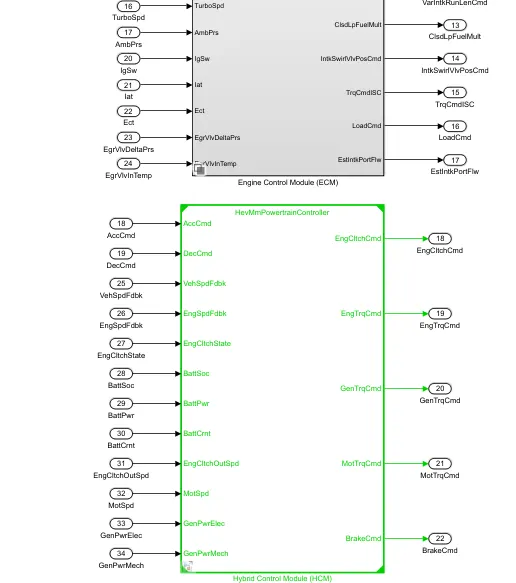
Figure(2) Figure(3)
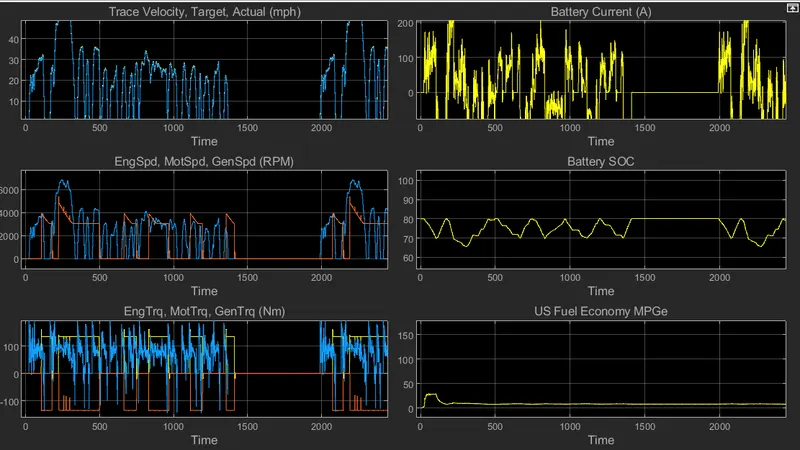
- The above scope is represent the hev engine speed,torque,battery current,state of charge and fuel economy.
- The presence of the electric powertrain is intended to achieve either better fuel economy than a conventional vehicle or better performance.modern HEVs make use of efficiency-improving technologies such as regenerative brakes which convert the vehicle's kinetic energy to electric energy, which is stored in a battery or super capacitor.
- Some varieties of HEV use an internal combustion engine to turn an electrical generator, which either recharges the vehicle's batteries or directly powers its electric drive motors; this combination is known as a motor generator.
- Many HEVs reduce idle resistance.by shutting down the engine at idle and restarting it when needed; this is known as a start-stop system.
- A hybrid-electric produces lower tailpipe emissions than a comparably sized gasoline car since the hybrid's gasoline engine is usually smaller than that of a gasoline-powered vehicle.
- If the engine is not used to drive the car directly, it can be geared to run at maximum efficiency, further improving fuel economy.
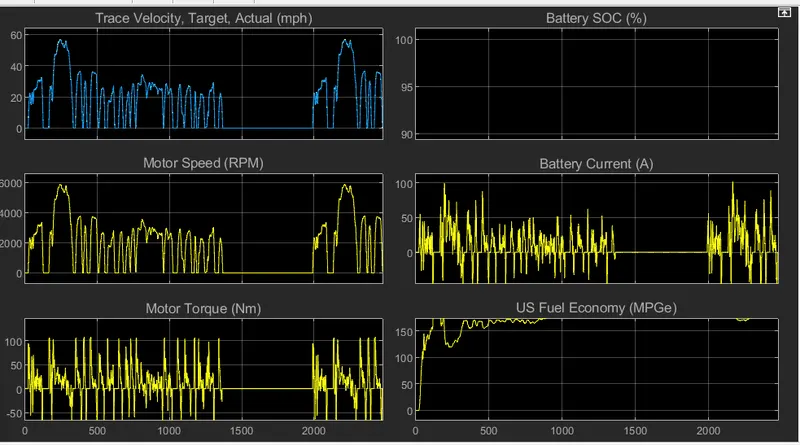
- The above scope is represent the electrical vehicle which have the speed,torque,battery current,state of charge is 0 and fuel economy.here battery is on board charging battery.
- An electric vehicle (EV) is a vehicle that uses one or more electric mototrs for propulsion.
- It can be powered by a collector system, with electricity from extravehicular sources, or it can be powered autonomously by a battery (sometimes charged by solar panels, or by converting fuel to electricity using fuel cells or a generator).
conclusion:
The objectives can be described and created successfully by using the matlab.