Week-4 Challenge WOT Condition Part-2
Aim:- Wide Open Throttle Condition (WOT).
Objectives:-
1] Difference between mapped and dynamic model of engine, motor and generator.
2] How does the model calculate miles per gallon? Which factors are considered to model fuel flow?
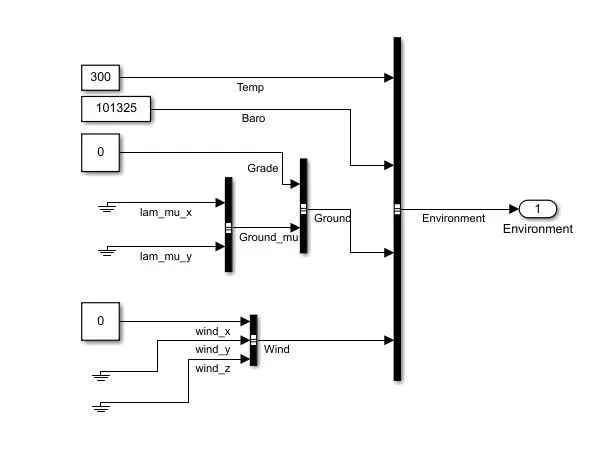
3] Change the grade and wind velocity in the environment block. Comment on the results.
4] compare the simulated results of hybrid and pure electric powertrains.
Question 1] What is the difference between mapped and dynamic model of engine, motor and generator? How can you change model type?
Answer:-
Subsystem of Mapped and Dynamic Based models:-
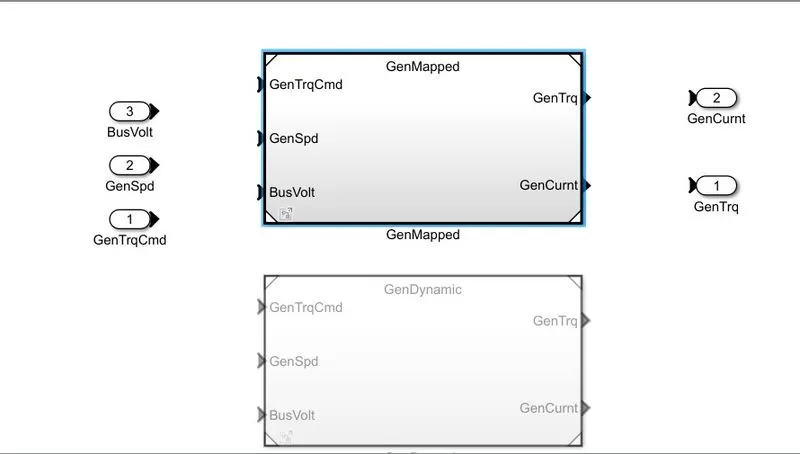
Mapped Based Model:-
The Mapped model is one of type where the data points are Pre-assigned in lookup tables. In this engine or motor torque required is snese and then the motor or engine block generated the required torque output just as a required simply without considering the real time motor or engine parameters. Then the output values are stored in the corresponding given input values of engine, motor and generator.
The accuracy of this type is not that high but the simulation will be done in the much less time as it does not run by real time parameters.
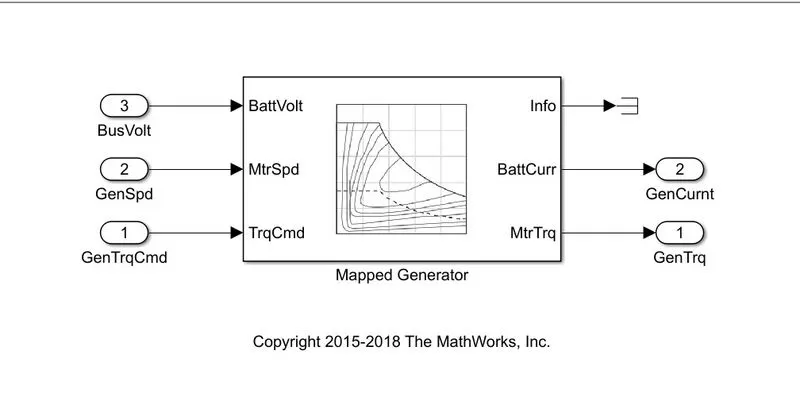
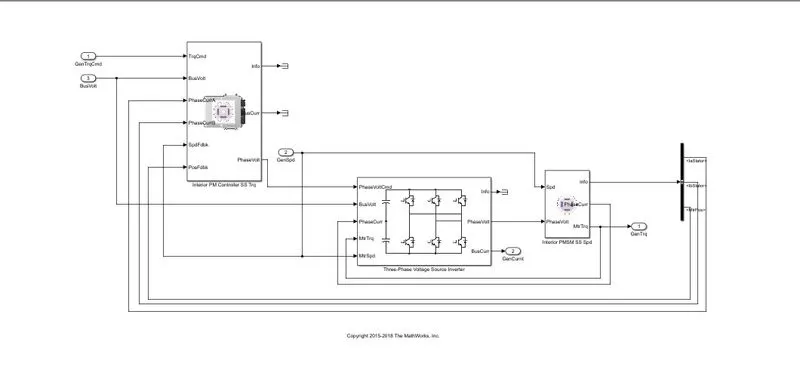
Dynamic Based Model:-
It is the combination of the outputs from the various subsystems to generate the outputs. It runs by real time simulation where the required input from the drive cycle is taken and for that individual real time simulations gets performed and summing all the results of the subsystem gives the output for the simulation. As per the Drive cycle requirements the initial bus voltage current is given along with the vehicle feedback so that it runs that the actiual simulation at that particular moment through the drive cycle.
The accuracy of these model is very high as it considers the real outputs from al the subsystem to generate the output.
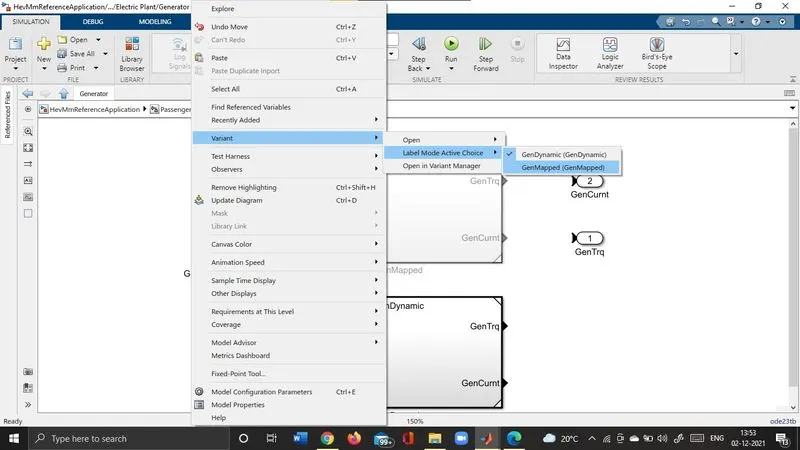
Step by step Changing model type:-
To open the HEV model file copy this code (autoblkHevStart) and paste in command window of matlab. then go to the step by step (Passenger car block) -> (Electric plant block) -> (Generator). then click right button of mouse go to the variant option then label mode active choice then select the model type.
Question 2] How does the model calculate miles per gallon? Which factors are considered to model fuel flow?
Answer :-
The final output/Fuel Efficiency is calculated by keeping in consideration of the Battery Output, Fuel Output and the Vehicle Speed/Kilometres Driven.
Miles per Gallon:-
It is Fuel economy rating determined by how far a car travel on a gallon of petrol or diesel for engine powered car. In case of an electric vehicle it tells us the energy which is the equuivalent that of a engine powered carto propel the car through a distance. The amount of fuel energy required to move a engine powered car through a distance determined and then it is compared to the equivalent amount of electric energy required to move the car throgh the same distance and is expressed as the miles per gallon. The powertrain blockset has a model that calculates the miles per gallon for all kinds of vehicle.
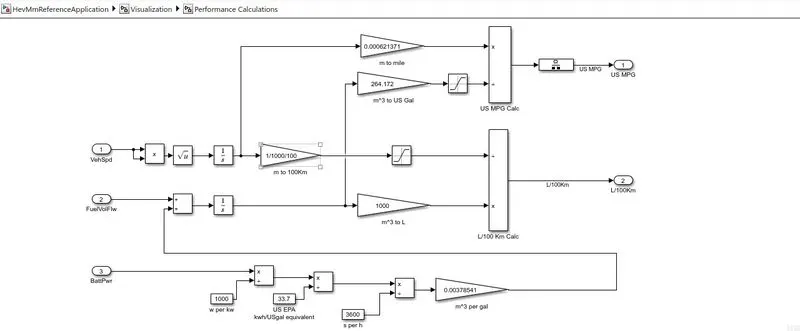
This is the model for calculating miles per gallons.
Factors are considered to model fuel flow:-
1] Vehicle speed
2] Fuel Volume flow
3] Battery power.
Question 3] Run the HEV ReferenceApplication with WOT drive cycle. Change the grade and wind velocity in the environment block. Comment on the results.
Answer:-
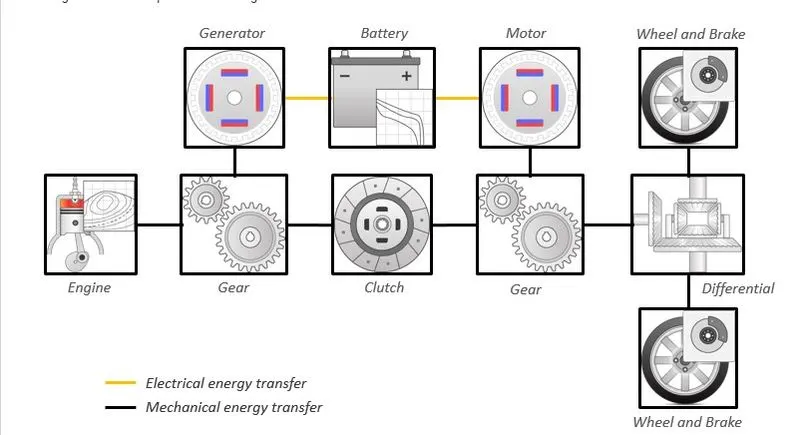
The hybrid electric vehicle reference application represents a full multimode hybrid electric vehicle (HEV) model with an internal combustion engine, transmission, battery, motor, generator, and associated powertrain control algorithms. Use the reference application for powertrain matching analysis and component selection, control and diagnostic algorithm design, and hardware-in-the-loop (HIL) testing. To create and open a working copy of the hybrid electric vehicle reference application project, enter
autoblkHevStart
By default, the HEV multimode reference application is configured with:
-
Mapped motor and generator
-
1.5–L spark-ignition (SI) dynamic engine
This diagram shows the powertrain configuration.
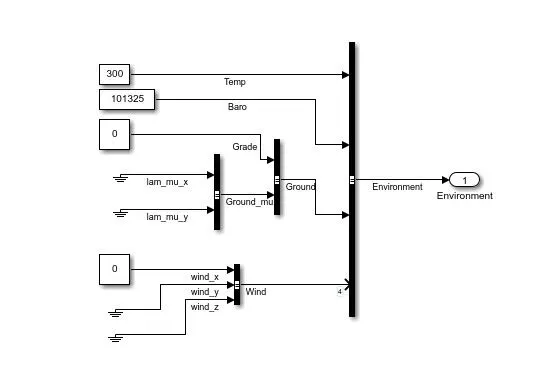
Case 1:-
Model:-
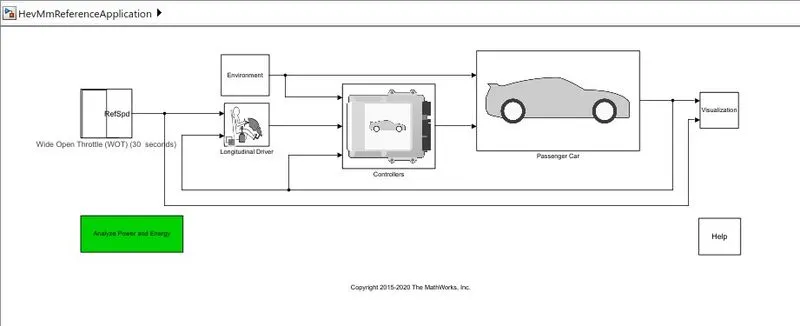
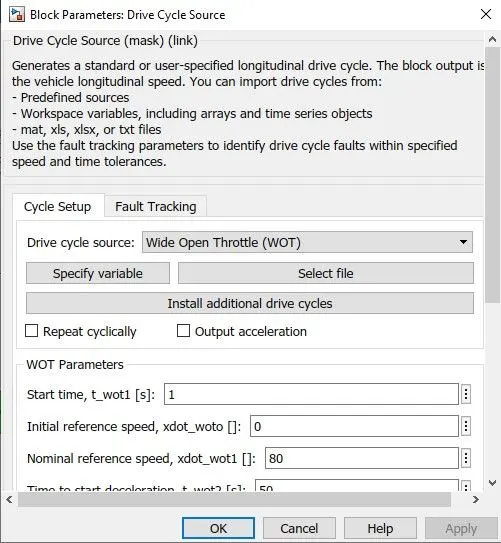
The model of Hybrid electric vehicle simulate using wide open throttle drive cycle (WOT) ,changeing some parameters and 0 gradability.
Speed = 80 Mph
Deceleration = 50 seconds
Gradability = 0 degree
Wind velocity = 0 m/s
Graph:-
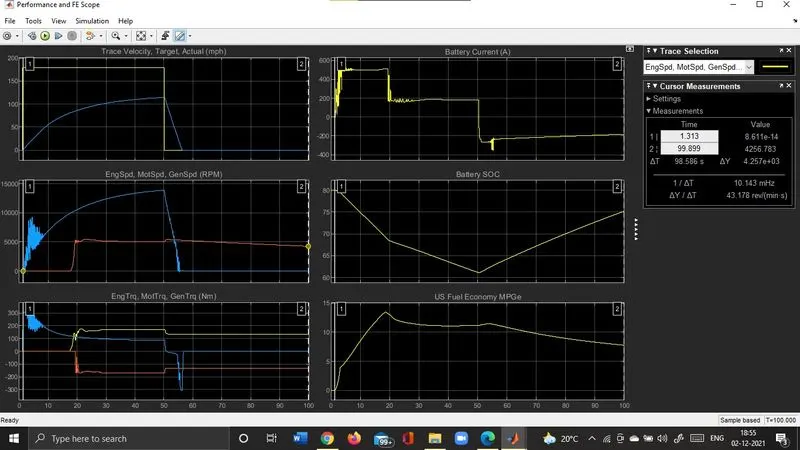
The above figure shows the result of simulation of HEV using WOT drive cycle.
In this Tottally six plots are plotted. each plots are shows particular result like Torque, Speed, SOC, Economy.
In this Graph use cursor measurement for analyse these plots. The Two points are available in this measurement one cursor are move to lower and second move to check peak value.
Result:-
plot 1:-
It shows the velocity of vehicle with respect to drive cycle data with tyhe time scale on X-axis.
Acceleratiuon time to reach 80Mph = 16.36 seconds
Deceleration time to reach 80 Mph with minimun = 6.46 seconds
Plot 2:-
It shows the changes in speed of the engine, motor, and generator in RPM throughout the drive cycle.
peak engine speed = 4670 RPM
peak motor speed = 9974 Rpm
Peak generator speed = 13872
Plot 3:-
It shows the torque characteristics and its changes the engine, motor, and generator in (Nm) throughout the drive cycle.
Peak engine Torque = 175 Nm
Peak motor torque = 305 Nm
peak generator Torque = 42.5 Nm
Plot 4:-
It shows the battery current values (A) and it changes for various acceleration inputs as per the drive cycle.
The peak current discharge from the battery = 165.4 A
The peak current charging from the battery = -143.65 A
Plot 5:-
It shows the State of charge (SOC) % and its change the corresponding to the driving inputs.
The state of charge decreased from 80% to 63% o fcharge in period of 48.73 seconds.
plot 6:-
It shows the fuel economy as mile per gallon fro the corresponding input driving condition.
The maximum miles that the car run per gallon of fuel equivalent = 13.42 miles.
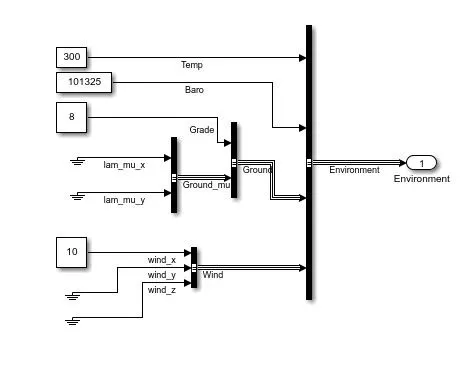
Case 2:-
Speed = 80 Mph
Deceleration = 50 seconds
Gradability = 8 degree
Wind velocity = 10 m/s
Graph:-
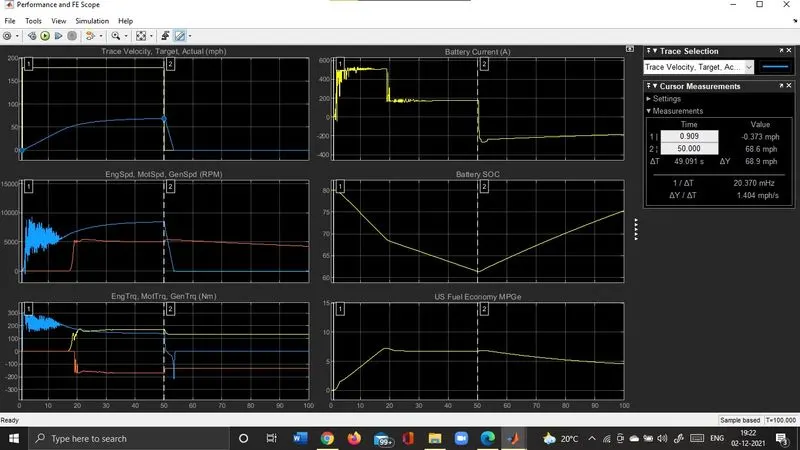
In this we change some parameters like giving hill climbing angle as 8 degree and also wind velocity 10 m/s. and the drive cycle is using same so in this plots changes.
Result:-
plot 1:-
It shows the velocity of vehicle with respect to drive cycle data with tyhe time scale on X-axis.
The top speed 80Mph cannot be achieved vecause some additional forces acting and so the car only run upto 68.9 Mph.
Acceleratiuon time to reach 68.9Mph = 49.65 seconds
Deceleration time to reach 68.9 Mph with minimun = 3.63 seconds
Plot 2:-
It shows the changes in speed of the engine, motor, and generator in RPM throughout the drive cycle.
peak engine speed = 5487 RPM
peak motor speed = 9367 RPM
Peak generator speed = 14854 RPM
Plot 3:-
It shows the torque characteristics and its changes the engine, motor, and generator in (Nm) throughout the drive cycle.
Peak engine Torque = 139.5 Nm
Peak motor torque = 206 Nm
peak generator Torque = 42.5 Nm
Plot 4:-
It shows the battery current values (A) and it changes for various acceleration inputs as per the drive cycle.
The peak current discharge from the battery = 167.4 A
The peak current charging from the battery = -153.65 A
Plot 5:-
It shows the State of charge (SOC) % and its change the corresponding to the driving inputs.
The state of charge decreased from 80% to 61.34% o fcharge in period of 47.90 seconds.
plot 6:-
It shows the fuel economy as mile per gallon fro the corresponding input driving condition.
The maximum miles that the car run per gallon of fuel equivalent = 7.42 miles.
Observation:-
The simulation result both the cases is found and we can see that the case 1 without the inclusion of hhill climbing conditions and the wind velocity is much more efficient compared to case 2 in which includes the hill climbing conditions and the wind velocity.
The vehicle was not able to achieve the required top speed through using the huighest the possible current discharge of that same battery used before.
The fuel ecomy is also down in case 2 compare to case 1. So the efficiency of no load vehicle is high compared to the vehicle with additional loads acting on them and also we have visualised this using powertrain blockset.
Question 4] Keeping all other parameters same, compare the simulated results of hybrid and pure electric powertrains.
Answer:-
In this we modeled the pure Electric Vehicle and compare with the Hybrid Electric Vehicle.
Pure Electric Vehicle:-
The electric vehicle reference application represents a full electric vehicle model with a motor-generator, battery, direct-drive transmission, and associated powertrain control algorithms. Use the electric vehicle reference application for powertrain matching analysis and component selection, control and diagnostic algorithm design, and hardware-in-the-loop (HIL) testing. To create and open a working copy of the conventional vehicle reference application project, enter
autoblkEvStart
The electric vehicle reference application is configured with a mapped motor and battery. This diagram shows the powertrain configuration.
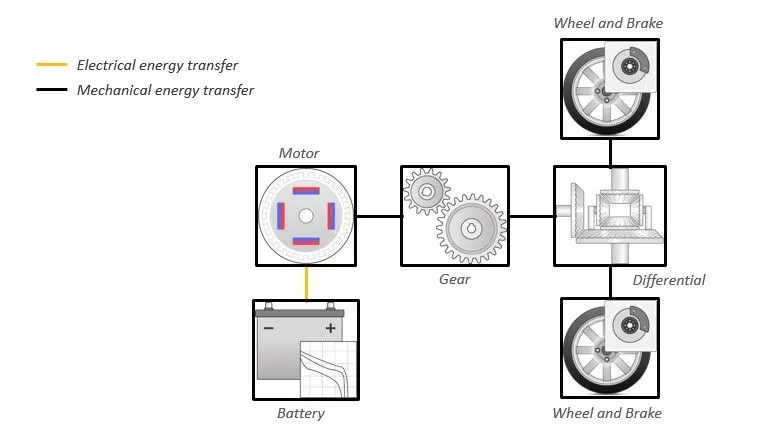
Model Electric Vehicle;-
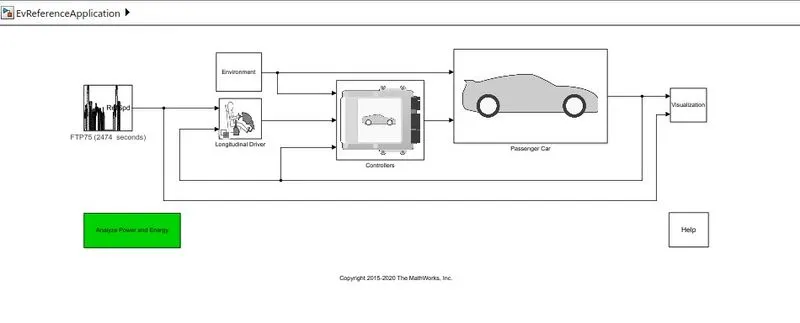
case 1:-
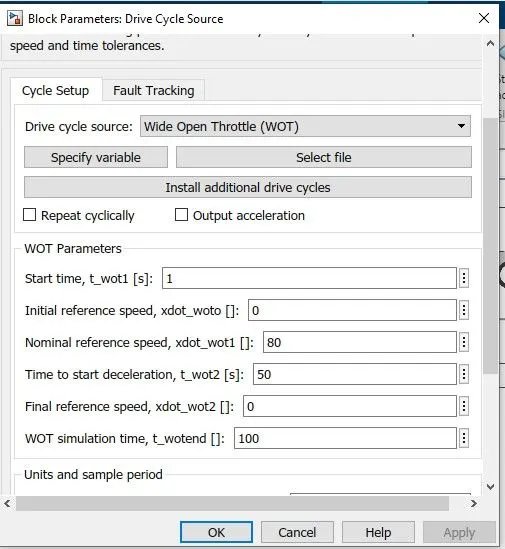
In this case we keep same data as using in case 1 in HEV and the Wide open throttle drive cycle using with stop time 100 seconds.
Speed = 80 Mph
Deceleration = 50 seconds
Gradability = 0 degree
Wind Velocity = 0 m/s
Graph:-
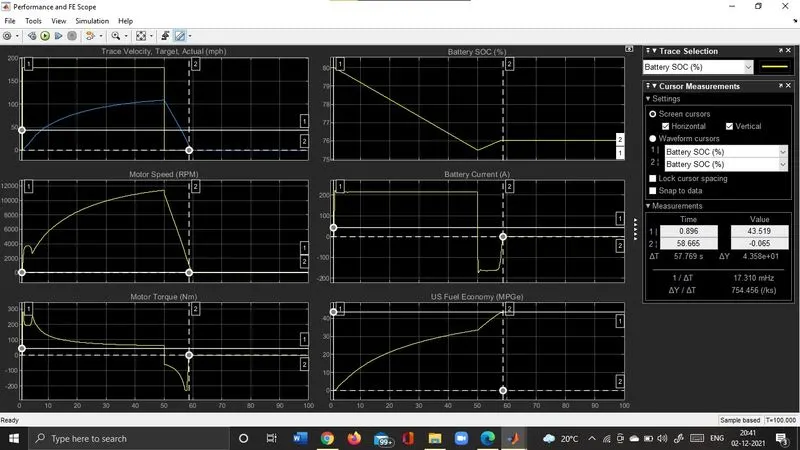
Result:-
plot 1:-
It shows the velocity of vehicle with respect to drive cycle data with tyhe time scale on X-axis.
The top speed achieved vecause some additional forces acting and so the car only run upto 108 Mph in 19.43 seconds.
Acceleratiuon time to reach 80 Mph = 19.43 seconds
Deceleration time to reach 80 Mph with minimun = 10.12 seconds
Plot 2:-
It shows the changes in speed of the motor in RPM throughout the drive cycle.
peak motor speed = 11270 RPM
Time to reach motor speed 11270 RPM = 48.38 seconds
Plot 3:-
It shows the torque characteristics and its changes the motor in (Nm) throughout the drive cycle.
Peak motor torque = 282 Nm
Time to reach torque 282 Nm = 1-2 seconds
Plot 4:-
It shows the battery current values (A) and it changes for various acceleration inputs as per the drive cycle.
The peak current discharge from the battery = 222 A
The peak current charging from the battery = -173 A
Plot 5:-
It shows the State of charge (SOC) % and its change the corresponding to the driving inputs.
The state of charge decreased from 80% to 75.5% discharge in period of 48.60 seconds and then it is incrreased upto 76% in charge time 7.9 seconds.
plot 6:-
It shows the fuel economy as mile per gallon fro the corresponding input driving condition.
The maximum miles that the car run per gallon of fuel equivalent = 43.48 miles in period 57.76 seconnds.
case 2:-
In this simulation changing hill climbing angle and wind velocity.
Speed = 80 Mph
Deceleration = 50 seconds
Gradability = 8 degree
Wind Velocity = 10 m/s
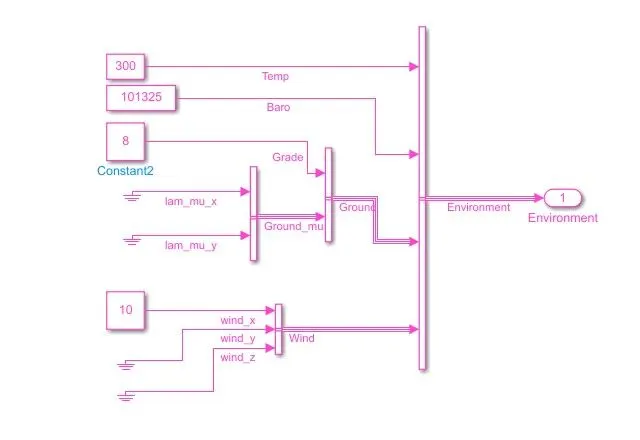
Graph:-
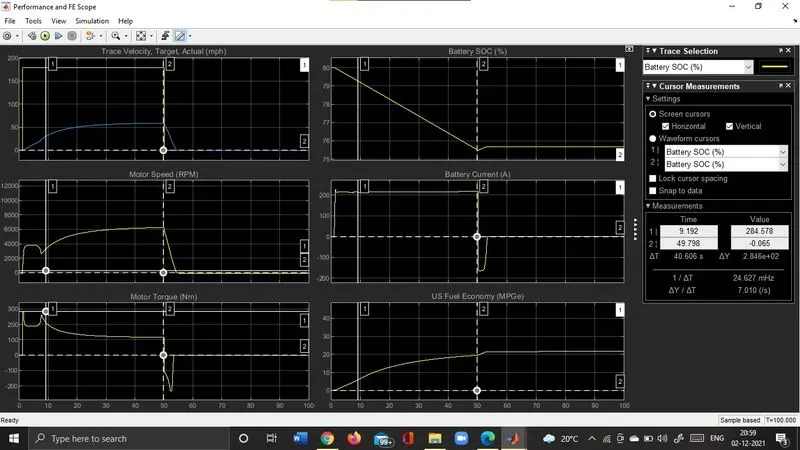
Result:-
plot 1:-
It shows the velocity of vehicle with respect to drive cycle data with tyhe time scale on X-axis.
The top speed 80Mph cannot be achieved vecause some additional forces acting and so the car only run upto 57.12 Mph.
Acceleratiuon time to reach 57.12 Mph = 48.89 seconds
Deceleration time to reach 57.12 Mph with minimun = 4.84 seconds
Plot 2:-
It shows the changes in speed of the motor in RPM throughout the drive cycle.
peak motor speed = 6231 RPM
Time to reach motor speed 6231 RPM = 48.68 seconds
Plot 3:-
It shows the torque characteristics and its changes the motor in (Nm) throughout the drive cycle.
Peak motor torque = 284 Nm
Time to reach torque 284 Nm = 1-2 seconds
Plot 4:-
It shows the battery current values (A) and it changes for various acceleration inputs as per the drive cycle.
The peak current discharge from the battery = 220 A
The peak current charging from the battery = -171 A
Plot 5:-
It shows the State of charge (SOC) % and its change the corresponding to the driving inputs.
The state of charge decreased from 80% to 75.5% discharge in period of 48.60 seconds and then it is incrreased upto 76% in charge time 7.9 seconds.
plot 6:-
It shows the fuel economy as mile per gallon fro the corresponding input driving condition.
The maximum miles that the car run per gallon of fuel equivalent = 21 miles in period 69.60 seconnds.
Observation:-
1] The EV is compared with HEV with the same environmenmtal and droive cycle conditions results is less top speed achuievement. The EV produces more values of of motor speed and motor torque compared to HEV motor speed and torque alone but HEV when it combines the torque of both motor and its engine it is higher than the EV torques. this is responsible to pull the hybrid car at higher top speed compared to electric car.
2] As the pure electric car here uses litium ion battery compared to the nickel metal hydride battery the discharging capacity and the rate of charging is higher in the pure electric car. as it is able to discharge in a fast rate the motor can produce high amount of torque instantly compared to HEV. also the SOC shows the battery efficiency of the pure electric to be higher than the hybrid vehicle and this is the also due to battery type used in these cars.
3] The efficiency of the elctric car is high compare than HEV which is evident from the miles per gallon numbers of both these cars.
4] EV produces zero emissions whereas the hybrid ones produce waste gas eission. these are some of the observation from the comparison of the above simulations using powertrain blockset.
Thank You
Dharmesh Bonde...