Week-11 Challenge: Braking
Question 1] For a defined driving cycle, calculate the energy required for braking.
Answer :-
Braking Energy :-
The braking performance is one the most important concerned in vehicle safety.
- Braking is the a process in which the motion of vehicle is restricted.
- When the vehicle is in motion the kinetic energy of the vehicle is high.
- To slow down the vehicle having high kinetic energy the application of brakes are applied.
- These brakes are used to convert the kinetic energy of the other form of energy.
- The main form of brakes are the mechanical brakes, which converts the kinetic enrgy into thermal enrgy and is released to the atmosphere.
- The kinetic enrgy of the vehicle is calculated by using
Kinetic Energy :-
`KE = frac{1}{2}*M*V^2`
where,
M = mass of vehicle in kg
V = velocity of the vehicle in m/s.
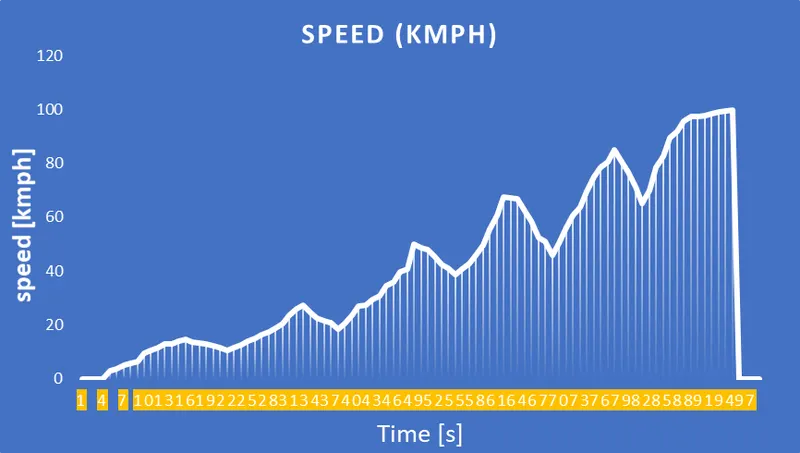
Drive cycle Graph Time Vs Speed:-
Calculations:-
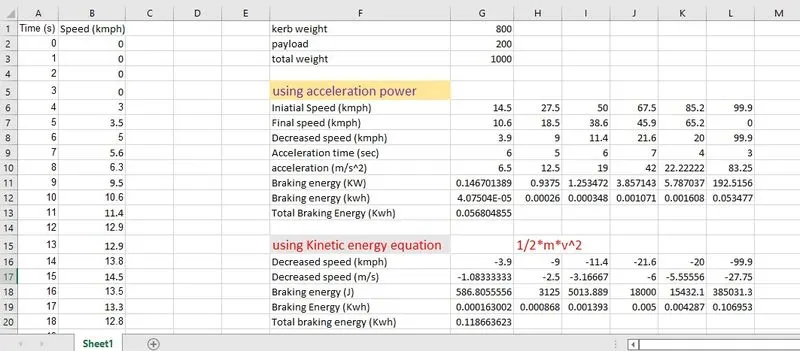
The braking energy for this drive cycle is 0.11866 Kwh.
Question 2] Why electric motor can’t develop braking torque at high speed similar to starting?
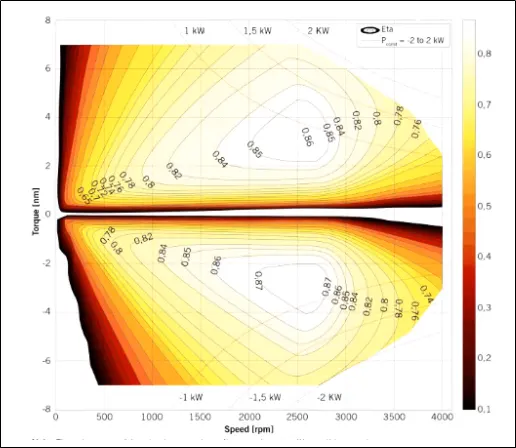
Fig:- Torque Speed Characteristics
The figure represents forward motoring (positive torque and speed) and forward braking (negative torque and positive braking).
We know that torque of the inuction motor is in inverse proportional to the square of the rotor speed so the it is at higher speed the torque will be less thats why at high speed electric motor cannot produce barking torque similar to starting.
How electric and mechanical brakes are coordinated?
The elctric motor must be controlled to produce the proper amount of braking force to recover as much braking energy as possible and at the same time the total braking force must be sufficient to meet vehicle decelartion commanded by the driver. For meeting the sufficient braking in EV we use control strategies.
Series brake control:- here mechanical brake and electrical brake are done one after anotyher.
Parallel brake control:- here both brakes are applied simultaneously.
We need both mechanical and electrical braking system. in emmergency braking or parking brake we need mechanical braking.
Mechanical brake:-
It is nothinf but friction brakes used in vehicle to slow down the vehicle. the most common type of brakes are drum brake and disc brake.
Electrical brake:-
It is used to reduce the speed of motor depending upon the flux and torque. This kind of braking can be done in different methods.
1] Plugging Type braking
2] Dynamic braking
3] Regenrative braking.
Question3] Make a MATLAB program which plots contour of given motor speed, torque and efficiency values. Attach the code as a .m file attach a screenshot of all the plots.
Answer:-
Matlab Coding:-
clear all
close all
clc

%% arrays
% speed arrays
w = linspace(1,1000);  % in Rad/s
% torque arrays
t = linspace(1,250);   % in N-m

%% 3D array create
% Meshgrid
[W T] = meshgrid(w,t);

%% losses coefficients
% copper losses
Kc = 0.23;
% iron losses
Ki = 0.009;
% windage losses
Kw = 0.000020;
% constant motor losses
K = 20;

%% Losses Calculations
Cu_L = (T.^2)*Kc; %copper losses = (Torque^2*copper loss coeff)
I_L = W.*Ki;  % iron losses = (speed*iron loss coeff)
W_L = (W.^3)*Kw  % windage losses = (speed^3*windage loss coeff)

%% calculation efficiency
O_P = W.*T;  % output power = (speed*torque)
I_P = (Cu_L)+(I_L)+(W_L)+(O_P)+K;  % Input power = (copper losses+iron losses+windage losses+output power)*Constant motor losse
Eff = O_P./I_P;  %efficiency = (output power/input power)

% Mapping contour of efficiency
%n = [0.7,0.8,0.85,0.9,0.91,0.92,0.925,0.93];
n = linspace(0.7,0.95,10);
contourf(W,T,Eff,n);
title('Speed Torque Characteristics','color','r')
xlabel('Speed [Rad/S]')
ylabel('Torque [Nm]')
contourcbar
Explanation:-
- starting the codes using clearing all data codes.
- speed and torque is defined as 2-dimensional linearly spaced arrays using the linspace command.
- constant of motor losses like copper loss, iron loss, windage loss.
- 2-dimensional arrays are defined in 3-dimensionl arrays using meshgrid command.
- equating the equations motor losses based on speed and torque.
- output power is defined using 3_dimensional speed and torque arrays.
- Input power is defined using sum of motor losses and output.
- efficiency is defined ration of output power to input power.
- mapping efficiency ranges are set.
- plotting the graph.
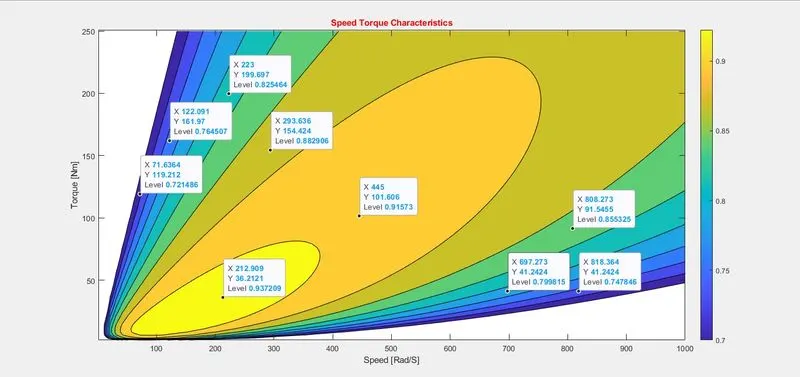
Plot:-
Result :-
From the plot it can be observed that the speed and torque varies as efficiency increase. This is occur due to motor losses. As we see the drak blue region represent the 70% efficiency and the yellow region represnt 93% efficiency.
Ex.- when it is at 70 % efficiency the torque reaches its peak value 250 Nm. it means the when the vehicle is at very low spweed the torque decrease as the speed increase for same efficviency. and at 93% efficiency the speed and torque required much less compared to an efficiency 70%. Greater the motor efficiency lower speed torque combination is required to overcome the motor losses.