Project 1 - Parsing NASA thermodynamic data
Parsing Thermodynamic data and Extracts Co-efficients and Evaluate thermodynamic properties such as Specific Heat, Enthalpy and Entropy.
Objectives:-
- Write a function that extracts the 14 co-efficients and calculates the enthalpy, entropy and specific heats for all the species in the data file.
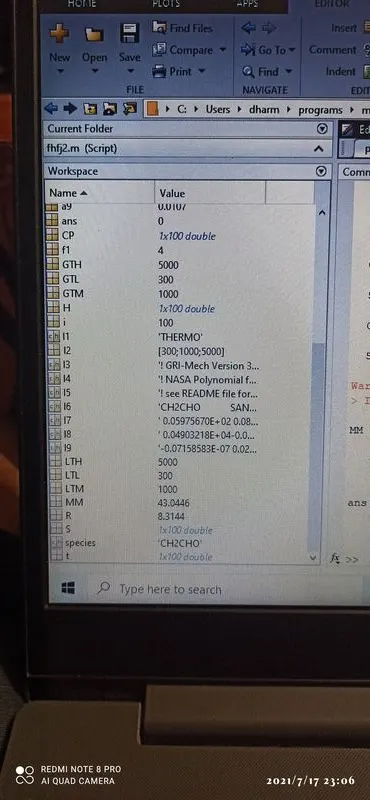
- Calculate the molecular weight of each species.
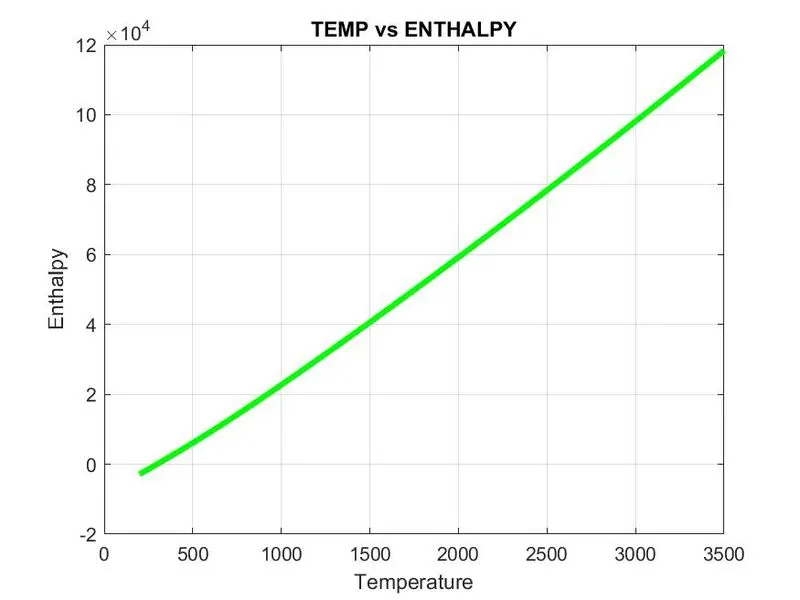
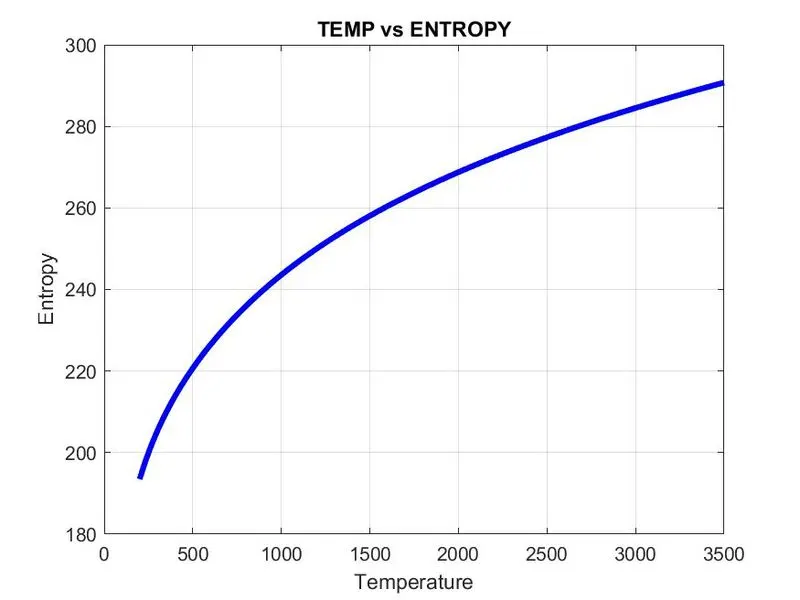
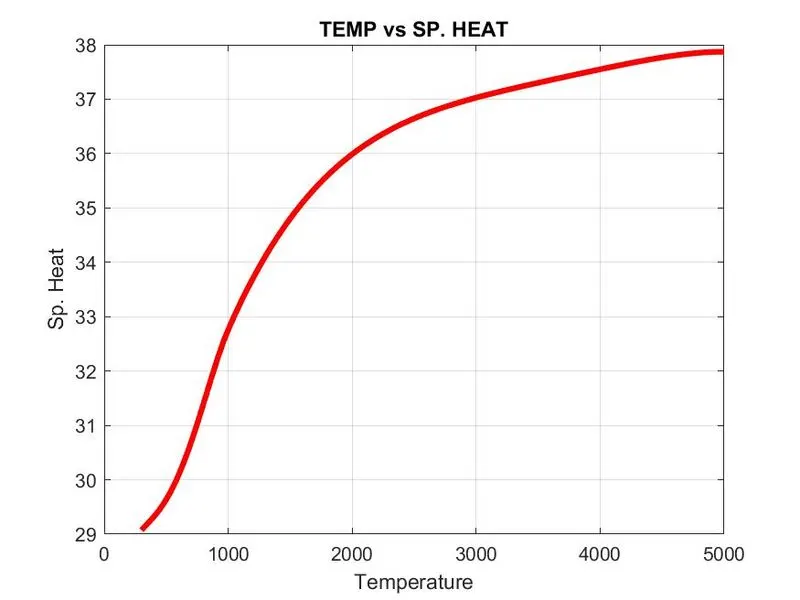
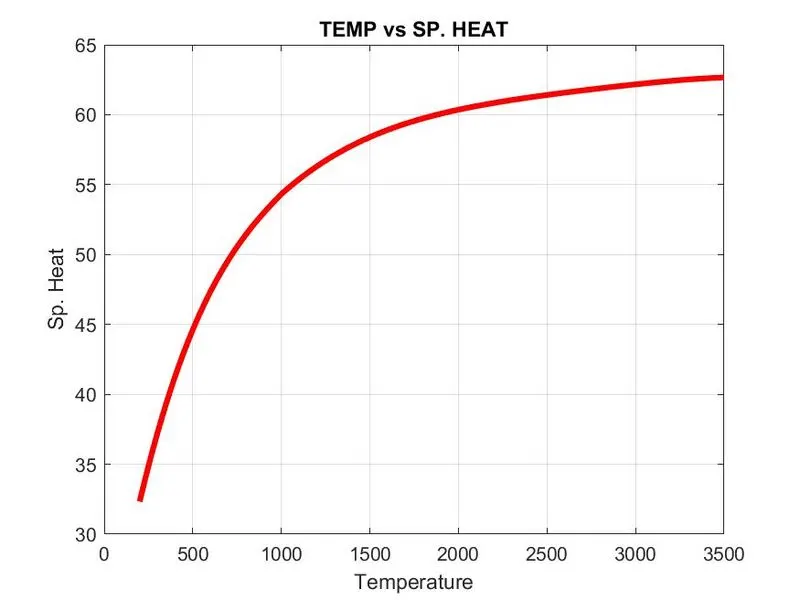
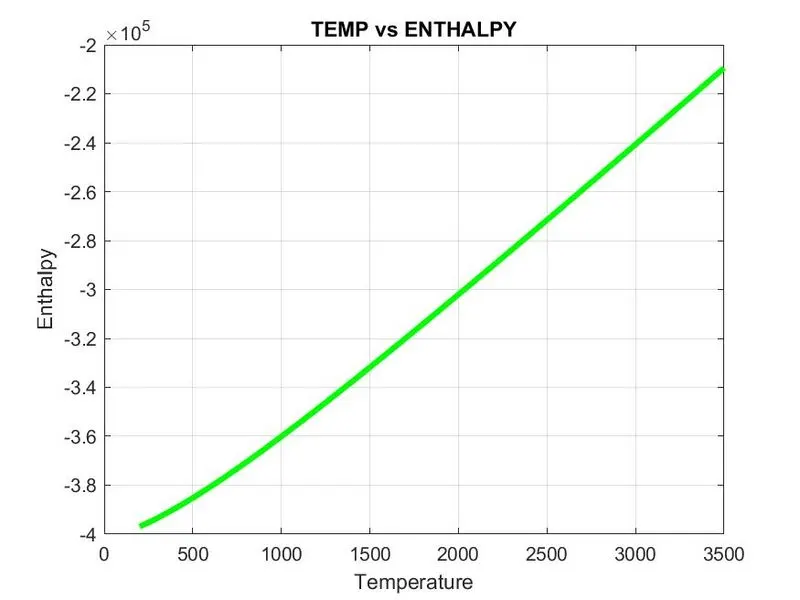
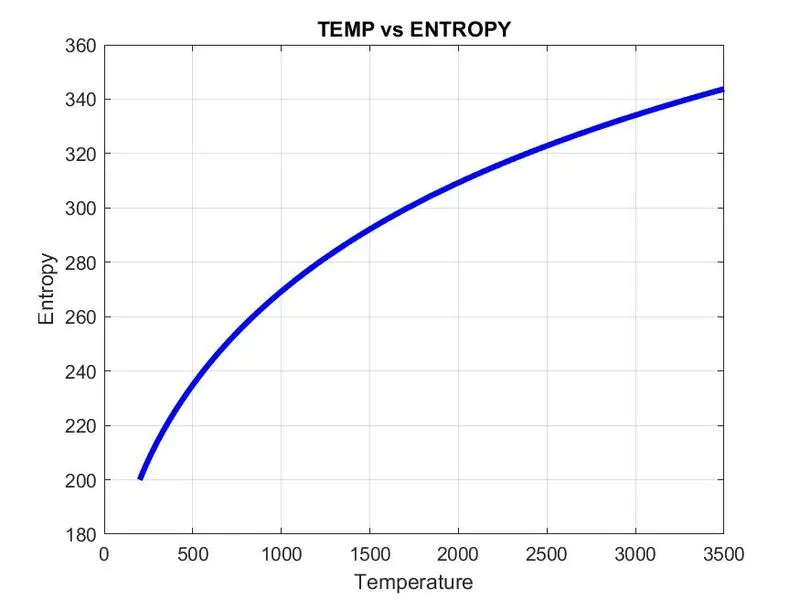
- Plot the Cp, Enthalpy and Entropy for the local temperature range (low temperature : high temperature) specific for each species.
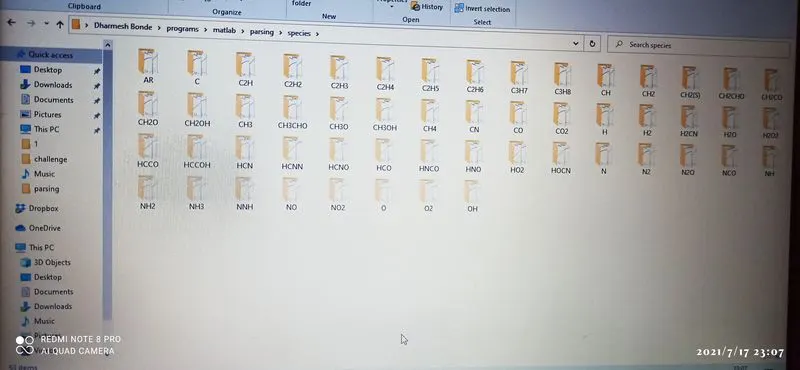
- Save the plots as images with appropriate names and dump them in separate folders for each species with suitable name.
- Plots for o2, N2 and Co2 species.
Introduction:- Parsing in computer languages refers to syntactic analysis of the input code into its components parts in order to facilitate the writing of compilers and interpreters. It can be used to describe split or separation.
Theory:- Parsing a file means re3ading in a data stream of some sort and building an in memory model of the semantic content of the data. This aims at facilitating performing some kind of transformation on the data. Example of parse is to break down a sentence to explain each element to someone. It breaks down words into functional units that can be converted into machine language. It is used to derive a string using the production rules of a grammar. It is used to check the acceptability of a string. it is used to check whether or not a string is syntactically correct. It takes the inputs and builds a Parse tree.
Formulae:- Using this formulas solving the specific heat, Enthalpy, and Entropy.
1] Specific Heat:-
`frac{Cp}{R} = a1+a2T+a3T2+a4T3+a5T4`
2] Enthalpy:-
`frac{H}{RT} = a1+frac{a2T}{2}+frac{a3T^2}{3}+frac{a4T^3}{4}+frac{a5T^4}{5}+frac{a6}{T}`
3] Entropy:-
`frac{S}{R} = a1*logT+a2T+frac{a3T^2}{2}+frac{a4T^3}{3}+frac{a5T^4}{4}+a7`
Where, R is the universal gas constant and T is a temperature.
R = 8.3144
a1,a2,a3,a4,a5,a6,a7 is the high temperature coefficient.
a8,a9,a10,a11,a12,a13,a14 is the low temperature coefficient.
Main program:-
clear all
close all
clc

%open the file & take a permission for read the file
f1 = fopen('THERMO.dat','r')

%reading name of file using fgetl command
l1 = fgetl(f1)

%read line number two through using fscanf command
l2 = fscanf(f1,'%f')
%global temperatures
GTL = l2(1)
GTM = l2(2)
GTH = l2(3)
%another method to read global temp
%l2 = fgetl(f1)  or tline = 'f1 values'
%a = strsplit(l2,' ')
%GTL = str2num(a{2})
%GTM = str2num(a{3})
%GTH = str2num(a{4})

%reading headers line
l3 = fgetl(f1)
l4 = fgetl(f1)
l5 = fgetl(f1)

for i = 1:53;   %for all species
%reading local temp
l6 = fgetl(f1)
%splitting the local temp
a = strsplit(l6,' ');
%read species name
species =(a{1})
%local temperatures
LTL = str2num(a{end-3})
LTM = str2num(a{end-1})
LTH = str2num(a{end-2})

%read the species data
l7 = fgetl(f1)    %tline = 'species data'
a = findstr(l7,'E');
%read each coefficient
a1 = str2num(l7(1:a(1)+3))
a2 = str2num(l7(a(1)+4:a(2)+3))
a3 = str2num(l7(a(2)+4:a(3)+3))
a4 = str2num(l7(a(3)+4:a(4)+3))
a5 = str2num(l7(a(4)+4:a(5)+3))

l8 = fgetl(f1)
a = findstr(l8,'E');
%read each coefficient
a6 = str2num(l8(1:a(1)+3))
a7 = str2num(l8(a(1)+4:a(2)+3))
a8 = str2num(l8(a(2)+4:a(3)+3))
a9 = str2num(l8(a(3)+4:a(4)+3))
a10 = str2num(l8(a(4)+4:a(5)+3))

l9 = fgetl(f1)
a = findstr(l9,'E');
%read each coefficient
a11 = str2num(l9(1:a(1)+3))
a12 = str2num(l9(a(1)+4:a(2)+3))
a13 = str2num(l9(a(2)+4:a(3)+3))
a14 = str2num(l9(a(3)+4:a(4)+3))

%evaluate function
R = 8.3144     %universal gas constant
t = linspace(LTL,LTH,100)
for i = 1:length(t)
    if t(i)>LTM
       CP(i) = R*((a1)+(a2*t(i))+(a3*t(i)^2)+(a4*t(i)^3)+(a5*t(i)^4));
       H(i) = (R*t(i))*((a1)+((a2*t(i))/2)+((a3*t(i)^2)/3)+((a4*t(i)^3)/4)+((a5*t(i)^4)/5)+(a6/t(i)));
       S(i) = R*((a1*log(t(i)))+(a2*t(i))+((a3*t(i)^2)/2)+((a4*t(i)^3)/3)+((a5*t(i)^4)/4)+(a7))
    else
       CP(i) = R*((a8)+(a9*t(i))+(a10*t(i)^2)+(a11*t(i)^3)+(a12*t(i)^4));
       H(i) = (R*t(i))*((a8)+((a9*t(i))/2)+((a10*t(i)^2)/3)+((a11*t(i)^3)/4)+((a12*t(i)^4)/5)+(a13/t(i)));
       S(i) = R*((a8*log(t(i)))+(a9*t(i))+((a10*t(i)^2)/2)+((a11*t(i)^3)/3)+((a12*t(i)^4)/4)+(a14))
    end
end

%create new folder
mkdir('species')
cd('species')
mkdir(species)


%plotting
% for specific heat
figure(1)
%subplot(3,1,1)
plot(t,CP,'linewidth',3,'color','r')
title('TEMP vs SP. HEAT')
xlabel('Temperature')
ylabel('Sp. Heat')
grid on
% image = getframe(gcf)
% imwrite(image.cdata,'t vs CP.png')

% saveas(1,species)

%for enthalpy
figure(2)
%subplot(3,1,2)
plot(t,H,'linewidth',3,'color','g')
title('TEMP vs ENTHALPY')
xlabel('Temperature')
ylabel('Enthalpy')
grid on
% image = getframe(gcf)
% imwrite(image.cdata,'t vs H.png')

% saveas(2,species)

% for entropy
figure(3)
%subplot(3,1,3)
plot(t,S,'linewidth',3,'color','b')
title('TEMP vs ENTROPY')
xlabel('Temperature')
ylabel('Entropy')
grid on
% image = getframe(gcf)
% imwrite(image.cdata,'t vs S.png')

% saveas(3,species)

%dir = (['species']);

% open current directory
cd(species);

% save the images
saveas(1,'spheat.jpg')
saveas(2,'enthalpy.jpg')
saveas(3,'entropy.jpg')
cd ..
cd ..

%calculation of molecular weight
MM = molecular_mass(species)
end


fclose(f1)
Function of molecular weight:-
function MM = molecular_mass(species)

% species = upper(species_name)

elements = ['H', 'C', 'N', 'O', 'A'];

atomic_mass = [1.00794 12.0107 14.0067 15.9994 39.948];

MM = 0;

for i = 1:length(species)
    for j = 1:length(elements)
        if strcmp(species(i),elements(j))
            MM = MM+atomic_mass(j);
            u = j;
        end
    end
    n = str2num(species(i));
    if n>1
        MM = MM+atomic_mass(u)*(n-1);
    end
end
Explanation of code:-
- Starting the program clearing all previous data.
- Open the THERMO.dat file in program using fopen command.
- Reading the file name using fgetl command.
- Calling Global temperature range in file using fscanf command then splitting they as 1] low global temp, 2] medium global temp, 3] high global temp.
- Reading the header of file using fgetl command its not neccesary.
- Use for loop for all species as 1:53.
- Reading species name using fgetl and str2num command and calling the low temperature range as in program they use then spliting and converting in numerical form then arranging in form of low, medium, high as.
- Reading species coefficient using tline or fgetl and findstr command and converting into numerical form same as three lines and creating high coefficient a1-a7, and low coefficient a8-a14.
- Creating function using formula as shown up for calculating CP, H, & S.
- Creating new folder for all species figure save in it.
- Creates figures in specific heat, enthalpy and entropy in all species and then give current directory and save all figures in new folder.
- Then create molecular calculation function for calcultion of all species molecular weight.
Figures from program:-
1] Species (O2):-
I] Specific heat:-
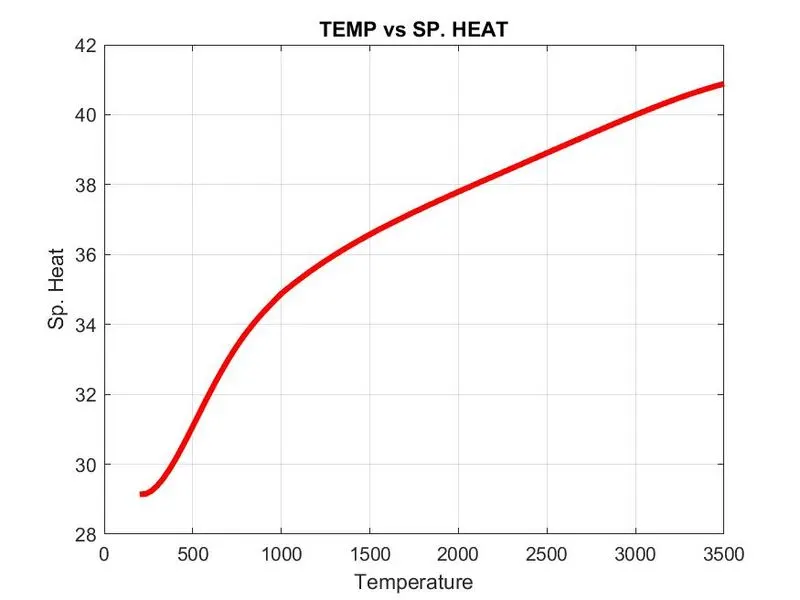
II] Entalpy:-
III] Entropy:-
2] Species (N2):-
I] Specific Heat:-
II] Enthalpy:-
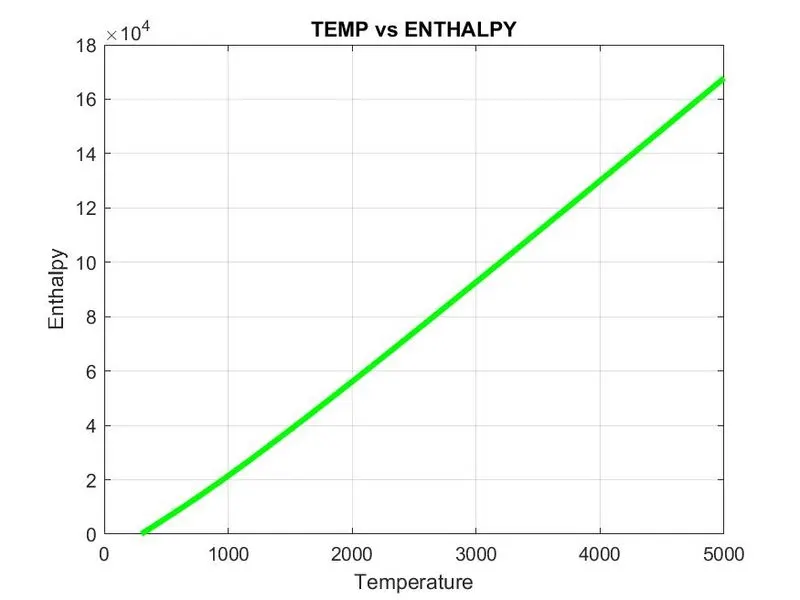
III] Entropy:-
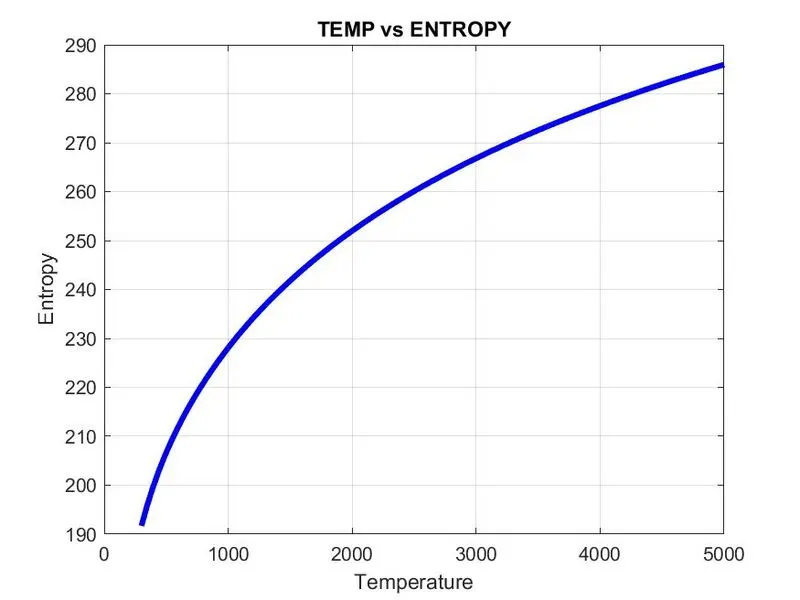
3] Species (CO2):-
I] Specific heat:-
II] Enthalpy:-
III] Entropy:-
Some Output from Program:-
1] molecular weight shown in workspace:-
2] Created new folders:-
Result:-
- The code for file parsing is done.
- The graph N2, O2, CO2 is plotted.
- Molecular weight for every elements is found.
- New files are created.
THANK YOU,
Dharmesh bonde