Week 4.1 - Genetic Algorithm
AIM: To Write a code in MATLAB to optimise the stalagmite function and find the global maxima of the function by using matlab.
EXPLANATION OF GENETIC ALGORITHM:A Genetic Algorithm was proposed by charles darwin.the genetic algorithm inspired by the process of natural selection that belongs to the larger class of evolutionary algorithms.it is used for the high quality solution of optimization.this methods are five phases in genetic algorithm.
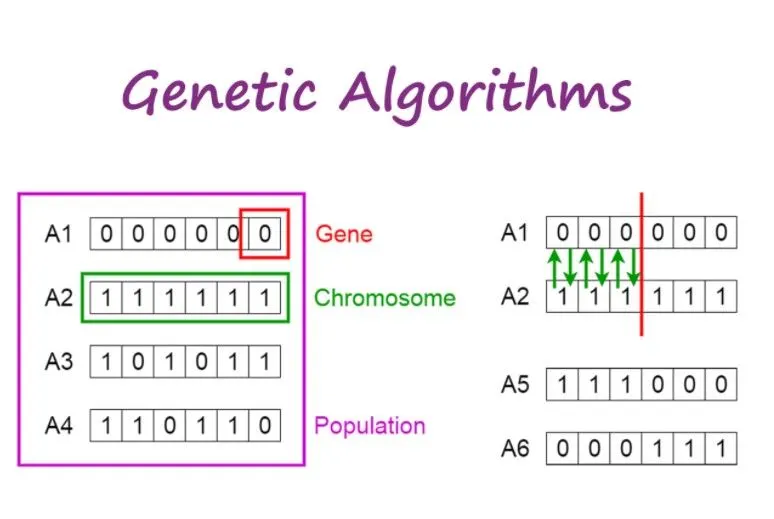
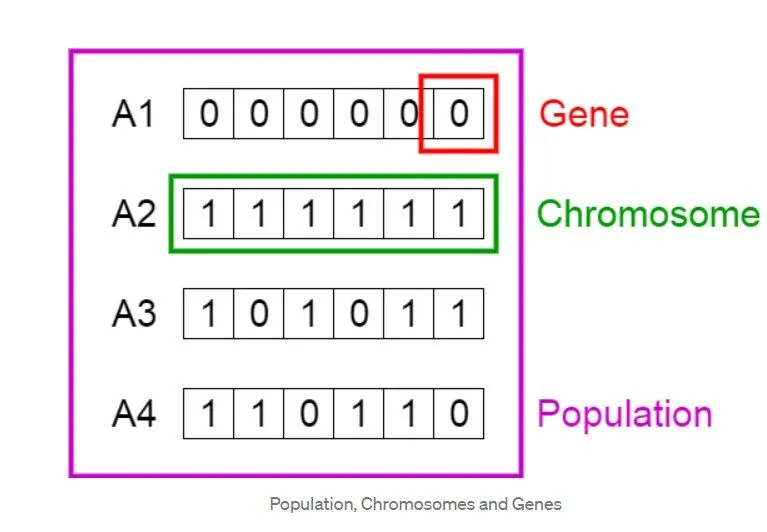
1.initial population-the process begins with the set of individuals which is called a population.an individual is characterized by a parameters known as genes. genes are joined into a string to form a chromosome.the set of individual is represented by using a string which the binary values are used as 0's and 1's.we encode the genes in chromosome.
2.fitness function-it determines how fit an individual.it gives a fitness score to each individual.the probability that an individual will be selected for reproduction is based on its fitness score.
3.selection-the idea of selection phase is to select the fitness individuals and let them pass their genes to next generation.two pairs of individuals(i.e.parents)are based on fitness scores.individuals with high fitness have more chance to be selected for reproduction.
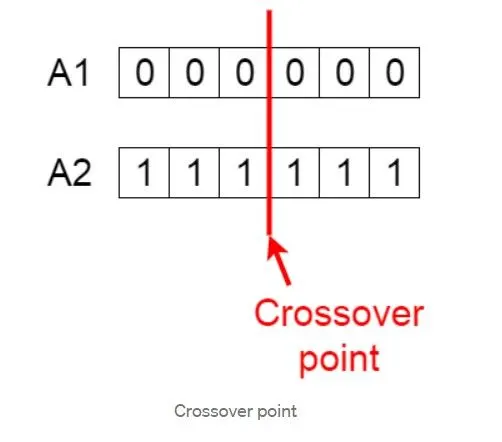
4.cross over-cross over is the most significant phase in a genetic algorithm.for each pair of parents to be mated,a cross point is chosen at random within the genes.offsprings are created by exchanging the genes of parents among themselves until the cross over point is reached.
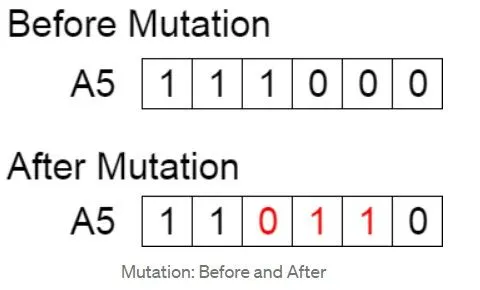
5.mutation-Certain newspring is formed,some of the genes can be subjected to a mutation with a low random probability. this implies that some of the bits in the bit string can be flipped.
syntax of genetic algorithm:
For (ex: x=ga(func,nvars)) to find the local unconstrained minimum,x, to the objective function,fun.nvars is the dimension (number of design variables) of function.
CODES AND EXPLANATION OF CODES:
1.The function should be declared with the name stalagmite.
2.The input variables of x and y are assigned.
3.The formula f(x,y)=f1x,f2x,f1y,f2y. of each individual polynomial is taken as ax,ay,bx,by.the below polynomial function is used
f(x,y)=f1x,f2x,f1y,f2y
f1x=[sin(5.1πx+0.5)]^6
f1y=[sin(5.1πy+0.5)]^6
f2x=exp(-4ln(2)((x-0.0667)²/0.64)))
f2y=exp(-4ln(2)((y-0.0667)²/0.64)))
4.Finally the -ive sign is used to optimize stability for the GA function(taking the minimum value)
5.After complete the function the main program has bee coded ,the linspace command is used which to difine the search space which should be inital value is 0 and the final value is 0.6.it is divided in to 150parts.
6.The points red is used for node points.
7.Meshgrid command is used for generating the 2d dimension.
8.For loop is used for repeating the sets.
9.surfc command is used to creating the surface of the plot and it can be filled.
10.The codes should be written by 3study plotted.
11.Three statistics is increasing the number of iterations that gives the output.
functions os stalagmite:
function [f]=stalagmite(input_vector)
x=input_vector(1);
y=input_vector(2);
ax=(sin(5.1*pi*x+0.5))^6;
ay=(sin(5.1*pi*y+0.5))^6;
bx= exp(-4*log(2)*(((x-0.0667)^2)/0.64));
by=exp(-4*log(2)*(((y-0.0667)^2)/0.64));
f=-(ax*bx*ay*by);
end
main program:The stalagmite function should be coded above.
clear all
close all
clc

%defining the initial inputs
x=linspace(0,0.6,150);
y=linspace(0,0.6,150);
num_cases=50;

%create a 2dimensional array
[xx,yy]=meshgrid(x,y);

%evaluate the stalagmite function
for i=1:length(xx)
    for j=1:length(yy)
        input_vector(1)=xx(i,j);
        input_vector(2)=yy(i,j);
        f(i,j)=stalagmite(input_vector);
    end
end

tic

for i=1:num_cases
    [inputs,fopt(i)]=ga(@stalagmite,2);
    xopt(i)=inputs(1);
    yopt(i)=inputs(2);
end

study_time=toc

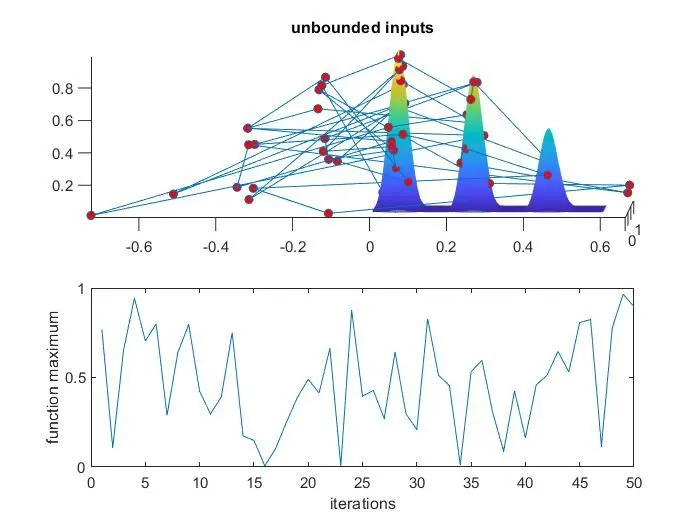
figure(1)
subplot(2,1,1)
hold on
surfc(x,y,-f)
shading interp
plot3(xopt,yopt,-fopt,'Marker','o','Markersize',5,'Markerfacecolor','r')
title('unbounded inputs')
subplot(2,1,2)
plot(-fopt)
xlabel('iterations')
ylabel('function maximum')

tic

%study 2-statistical behaviour
tic

for i = 1:num_cases
    [inputs, fopt(i)] = ga (@stalagmite,2,[],[],[],[],[0;0],[0.6;0.6]);
    xopt(i) = inputs(1);
    yopt(i) = inputs(2);
end
study2_time = toc

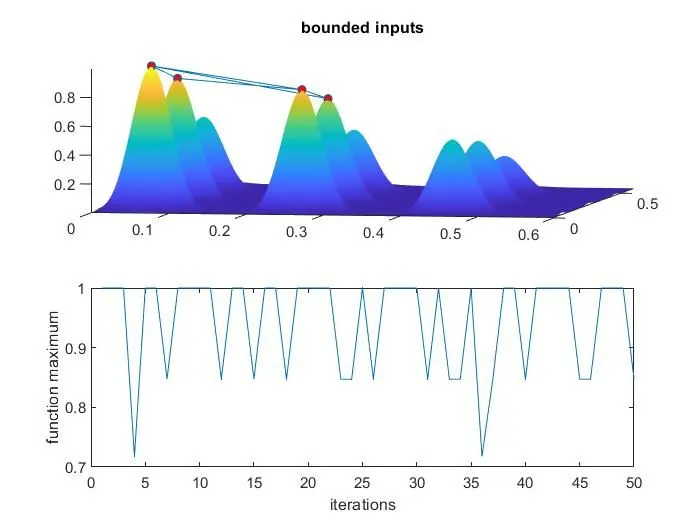
figure(2)
subplot(2,1,1)
hold on
surfc(x, y, -f)
shading interp
plot3(xopt,yopt,-fopt,'marker','o','MarkerSize',5,'MarkerFaceColor','r')
title('bounded inputs')
subplot(2,1,2)
plot(-fopt)
xlabel('iterations')
ylabel('function maximum')

%study 3-statistical behaviour

options=optimoptions('ga')
options=optimoptions(options,'PopulationSize',150);
tic
for i = 1:num_cases
    [inputs, fopt(i)] = ga (@stalagmite,2,[],[],[],[],[0;0],[1;1],[],[],options);
    xopt(i) = inputs(1);
    yopt(i) = inputs(2);
end
study3_time = toc

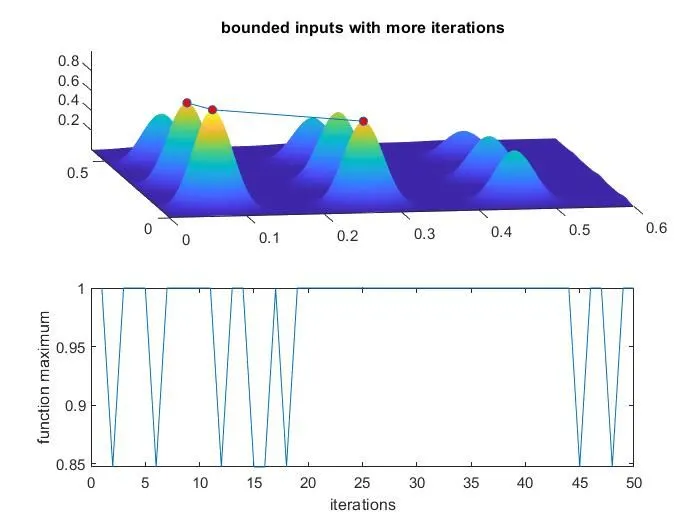
figure(3)
subplot(2,1,1)
hold on
surfc(x, y, -f)
shading interp
plot3(xopt,yopt,-fopt,'marker','o','MarkerSize',5,'MarkerFaceColor','r')
title('bounded inputs with more iterations')
subplot(2,1,2)
plot(-fopt)
xlabel('iterations')
ylabel('function maximum')
PLOTS:
plot 1 statistical 1
plot 2 statistical 2
plot 3 statistical 3
ERRORS:The error i have faced is the surface of the plot is not visible that error should be solved with the help of support persons.
COCLUSION:Thus the codes is created successfully for finding the maxima value for the given function and plotted by using the matlab. Increasing the number of iteration is decreasing the search space for right value also use the genatic algoritm is utilized and providing the necessary examples.