Week 3 - Solving second order ODEs
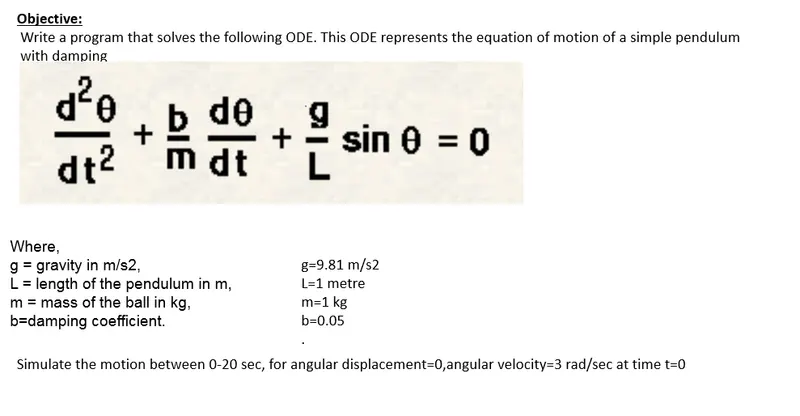
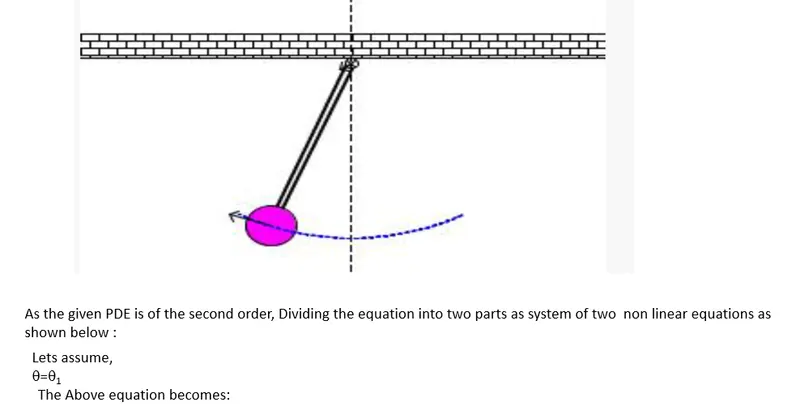

Steps Followed:
1. Import below modules into the sublime text editor.
import numpy as np
from scipy.integrate import odeint
import matplotlib.pyplot as plt
import math
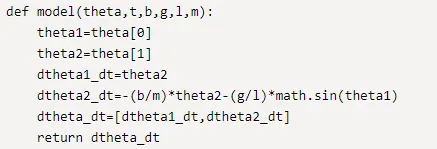
2. Define function that passes variables as argument
3. Define Variables as input
b=0.02 # Damping coefficient
g=9.81 # Acceleration due to gravity
l=1 # Length of the string
m=0.1 # mass of the ball
4. Define initial Conditions of displacement and velocity
theta_0=[0,3]
5. Define Time
t=np.linspace(0,20,100)
6. Define ODE to solve
theta=odeint(model,theta_0,t,args=(b,g,l,m))
7. Plot the displacement and velocity with respect to time
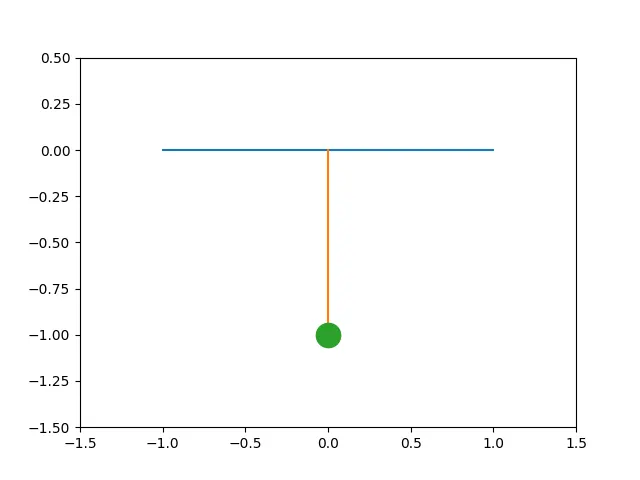
8. Animation of the pendulum
import numpy as np
from scipy.integrate import odeint
import matplotlib.pyplot as plt
import math

# Define function that returns dtheta/dt
def model(theta,t,b,g,l,m):
	theta1=theta[0]
	theta2=theta[1]
	dtheta1_dt=theta2
	dtheta2_dt=-(b/m)*theta2-(g/l)*math.sin(theta1)
	dtheta_dt=[dtheta1_dt,dtheta2_dt]
	return dtheta_dt
#Define Variables as a input
b=0.02 # Damping coefficient
g=9.81 # Acceleration due to gravity
l=1 # Length of the string
m=0.1 # mass of the ball

#Initial condition
theta_0=[0,3]

#Time points
t=np.linspace(0,20,100) # Define time

#Solve ODE
theta=odeint(model,theta_0,t,args=(b,g,l,m))

#Plot results
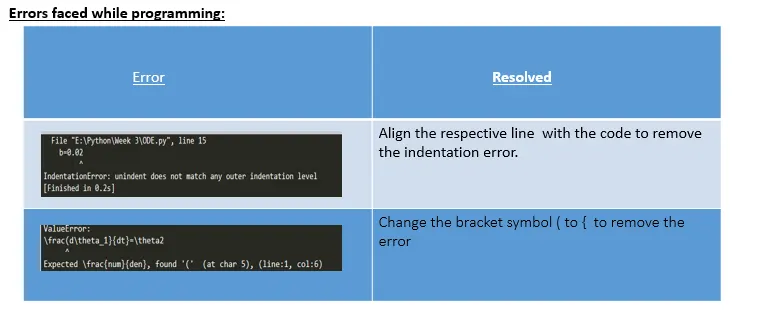
plt.plot(t,theta[:,0],'b-',label=r'$\frac{d\theta_1}{dt}=\theta2$')  # To plot Displacement
plt.plot(t,theta[:,1],'r--',label=r'$\frac{d\theta_2}{dt}=-\frac{b}{m}\theta_2-\frac{g}{L}sin\theta_1$')# To plot velocity
plt.ylabel('Displacement and velocity')
plt.xlabel('time')
plt.legend(loc='best')
plt.show()
 #Animation
A=theta[:,0]
ct=1
x0=0;
y0=0;
for i in A:
	#Define coordinates for the  center of the ball w.r.t theta
	x1=l*(math.sin(i));
	y1=-l*(math.cos(i));
	#Plotting fixed Point
	filename=str(ct)+'.png'
	ct=ct+1

	plt.figure()
	plt.plot([-1,1],[0,0])
	#Plotting length of the string
	plt.plot([x0,x1],[y0,y1])
	plt.plot(x1,y1,marker='.',markersize=35)
	plt.xlim([-1.5,1.5])
	plt.ylim([-1.5,0.5])
	plt.savefig(filename)
Output:
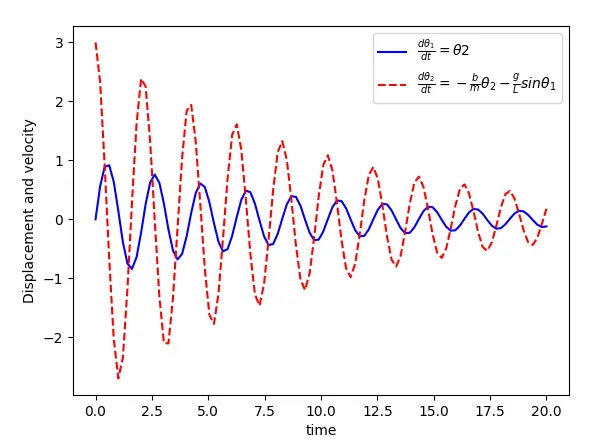
Above graph shows the angular displacement and angular velocity changes with respect to time.
Animation: