Week 2 - Flow over a Cylinder.
AIM:-
To simulate the flow over a cylinder and explain the phenomenon of karman vortex street.
OBJECTIVE: -
- To calculate the co-efficient of drag and lift for the given reynolds number in both steady and un-steady state simulation.
- Discuss the reynolds number with respect to the co-efficient of drag.
- To calculate the Strouhal number for re=100 for both steady and un-steady state simultion.
- Results should be validated with any standard literature and error should be within 5 % for un-steady state simulation of re=100.
Why does Vortex Shedding Matter?
The frequency of the vortices is dependent on the shape of the blunt body, and the velocity of the fluid flow or wind hitting this body. The vortices create low pressure zones on the downwind side of the object on alternate sides. As the fluid flows to fill the low pressure zone, it produces a vibration at a specific calculable frequency. This vibration is only a major concern if it happens to coincide with the natural frequency of the structure. For structures that are tall and uniform in size and shape, the vibrations can be damaging and ultimately lead to fatigue failure. Masts or towers are highly susceptible to vibrations induced by vortex shedding. By completing a vortex shedding analysis of structures under realistic wind loading, engineers can evaluate whether more efficient structures can and should be developed.
INTRODUCTION:-
Flow over a cylinder is one of the simulation in CFD and till date the research is going on in the un-steady behaviour caused by a flow.
In fluid dynamics a Karman vortex street (or a von Kármán vortex street) is a repeating pattern of swirling vortices, caused by a process known as vortex shedding, which is responsible for the unsteady seperation of flow of a fluid around blunt bodies.
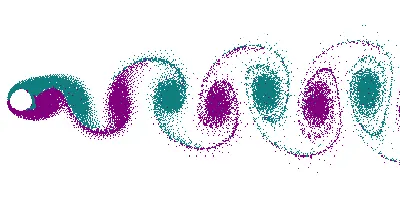
It is named after the engineer and fluid dynamicist THEODORE VON KARMAN and is responsible for such phenomena as the "singing" of suspended telephone or power lines and the vibration of a car antenna at certain speeds. Mathematical modeling of von Karman vortex street can be performed using different techniques including but not limited to solving the full Navier-Stokes equations with k-epsilon, SST, k-omega and Reynolds stress, and large eddy simulation (LES) turbulence models or by numerically solving some dynamic equations such as the Ginzburg landau equation.
A vortex street will form only at a certain range of flow velocities, specified by a range of REYNOLDS NUMBER (Re), typically above a limiting Re value of about 90. The (global) Reynolds number for a flow is a measure of the ratio of inertial to viscous force in the flow of a fluid around a body or in a channel, and may be defined as a nondimensioanl parameter of the global speed of the whole fluid flow:
| Re= ρ*v*L/μ |
where:
- ρ = Density of the fluid.
- V = the free stream flow speed (i.e. the flow speed far from the fluid boundaries ,
 like the body speed relative to the fluid at rest, or an inviscid flow speed, computed through the Bernoulli equation), which is the original global flow parameter, i.e. the target to be non-dimensionalised.
  = a characteristic length parameter of the body or channel.
- μ = Dynamic viscosity.
GEOMETRY: -
- For creating a geometry for boundary layer with the hep of space claim and in space claim the units are set to be in meters(m)
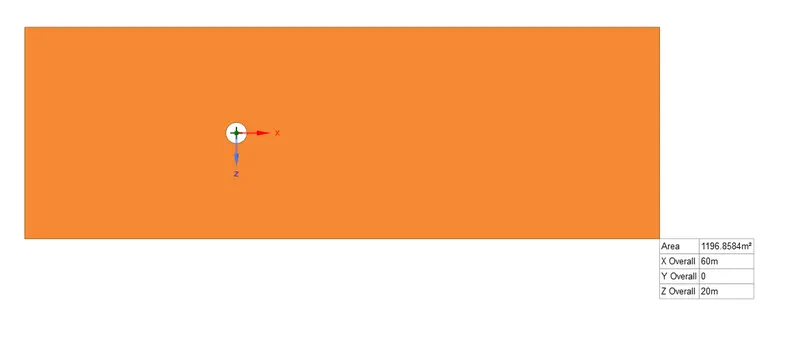
- Draw a circle of 2m dia and fom its centre point a 20m construction line ie, 10D of the circle should be drawn left side of the centre point & 40m construction line ie, 20D of the circle towards the right side from the centre point of the circle also draw a vertical construction line of 10m both side from the edge of the 10m construction line and make it as a rectangle to joint the both sides to form a boundary layer.
- Using pull tool make the boundary layer as a surface,then delete the construction lines and circle.
- Then the boundary layer will look like:-
MESHING: -
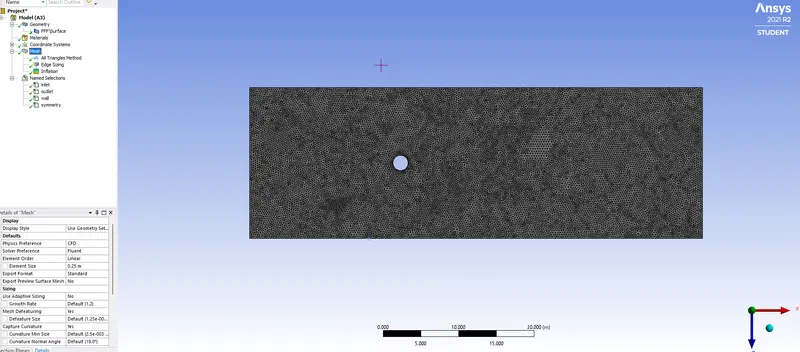
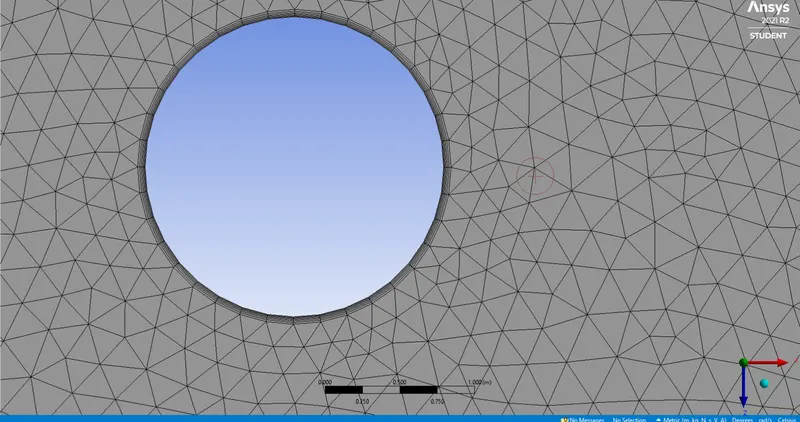
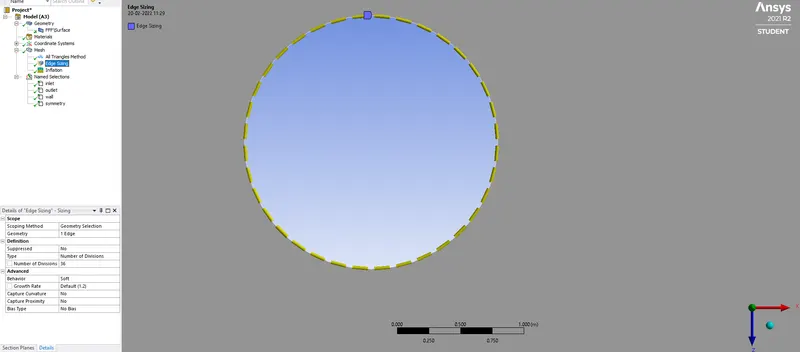
For meshing we're going to use triangular mesh with the element size of 0.25m and Inorder to capture the physics we've used edge sizing for creating 36 divisions for the circle in the boundary layer also we've created inflation layer to the circle with first layer thickness of 5e-3m. The growth rate of the layer is 1.2.
Naming the edges accordingly.
SOLUTION SETUP: -
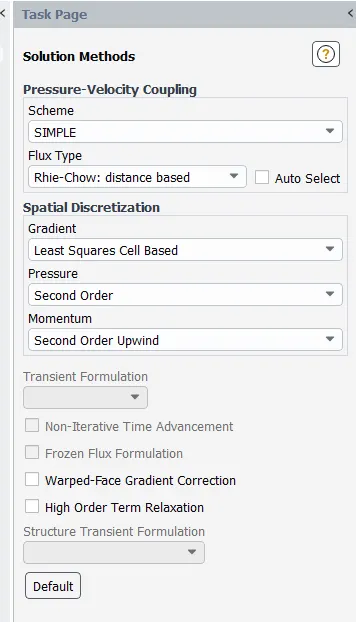
For the simulation pressure based solvers are used and both steady state and un-steady state simulations were done with respect to the reynolds number.
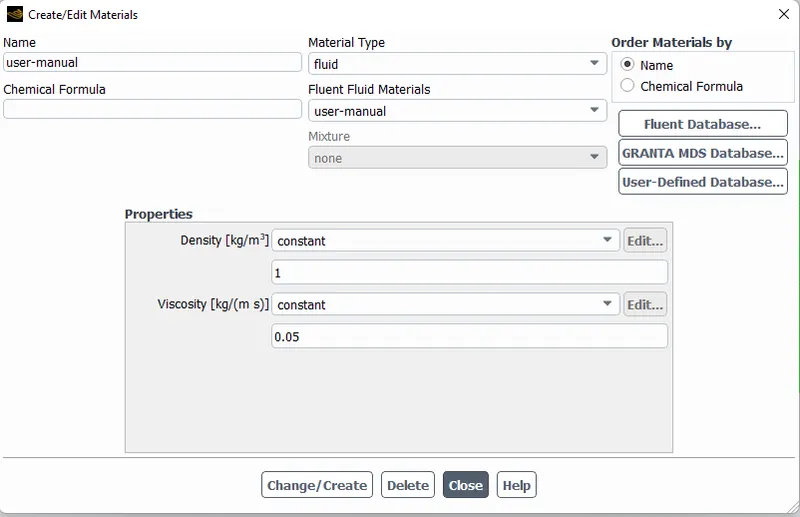
The viscosity will be consatant for all the models which is 0.05kg/ms also the Density will be constant for all the models which is 1kg/m^3.
The velocity will be change with respect to the change in reynolds number.
The viscous layer is laminar model.
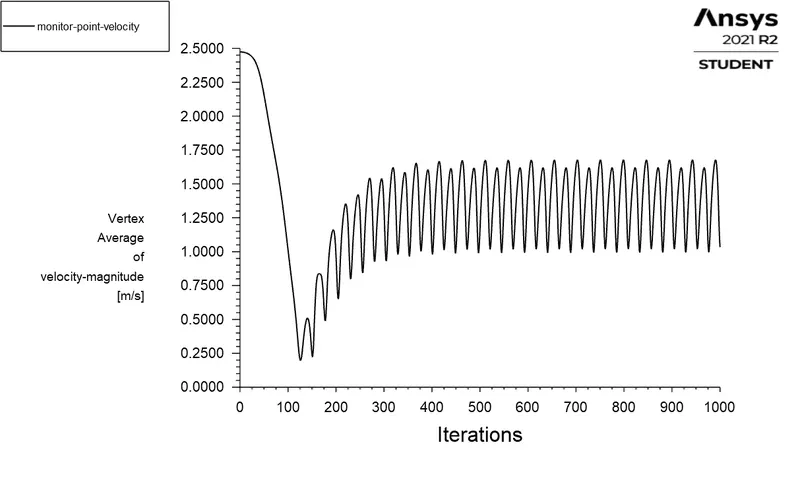
A Monitor point is included along X-axis from the cylinder which is 8m from the centre of the cylinder(circle).
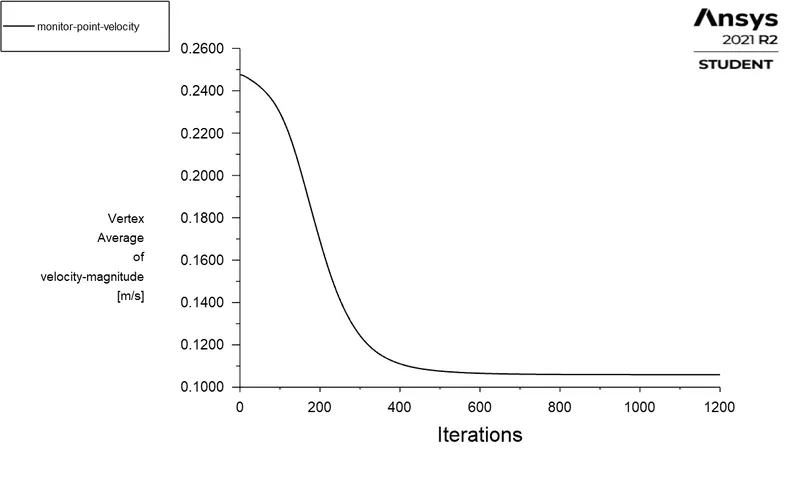
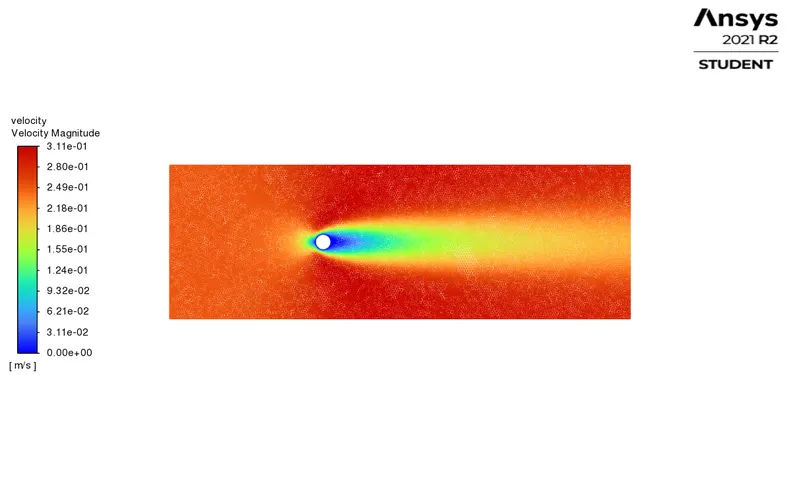
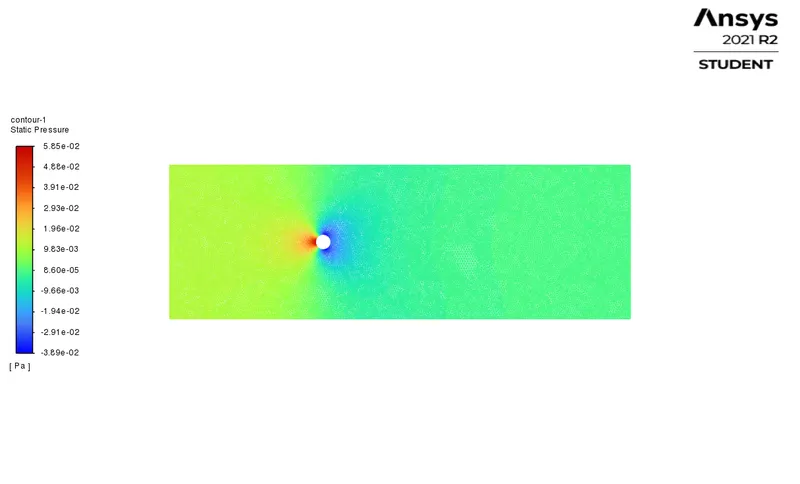
STEADY STATE SIMULATION FOR Re=10
VISCOSITY=0.05KG/MS
DENSITY= 1KG/M^3
VELOCITY=0.25M/SEC
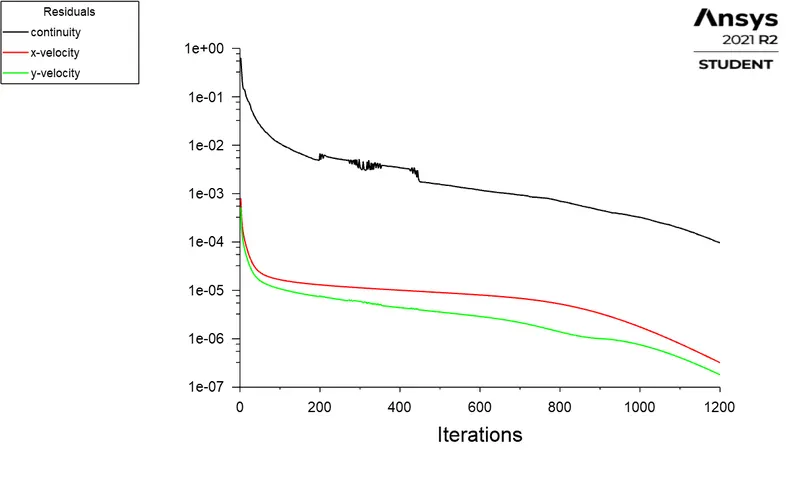
ITERATIONS =1200
RESIDUAL PLOT: -
VERTEX AVG PLOT :-
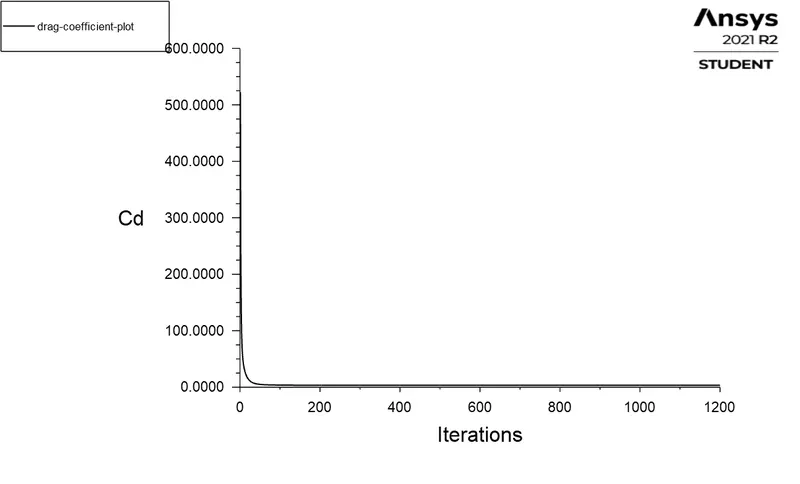
DRAG CO-EFFICIENT PLOT:-
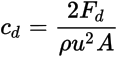
Formulae for drag co-effiecient: -
 |
= | drag coefficient |
 |
= | drag force |
 |
= | mass density of fluid |
 |
= | flow speed of the object relative to the fluid |
 |
= | reference area |
Cd= 3.3241635
LIFT-COEFFICIENT PLOT: -
where  is the lift force
 is the relevant surface area
 is the fluid density
V is the velocity
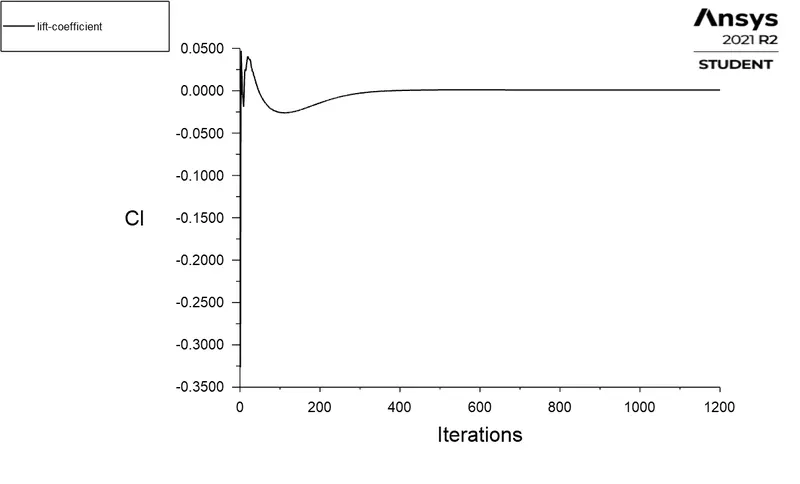
Cl=0.00093065464
VELOCITY-CONTOUR PLOT: -
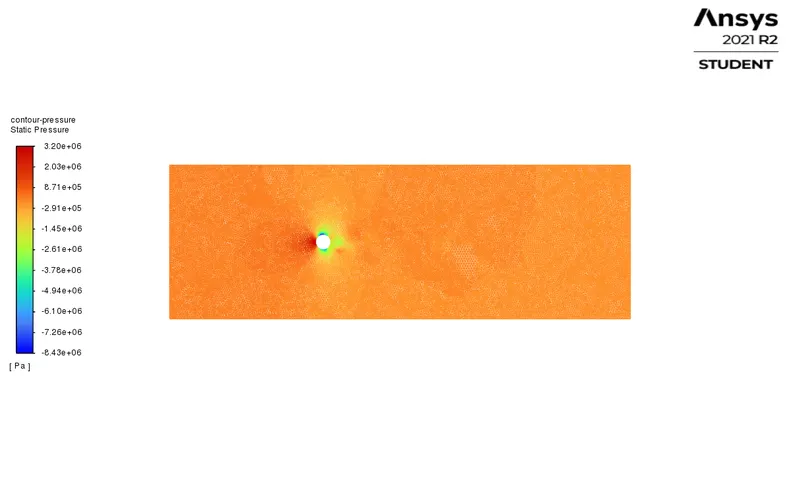
PRESSURE CONTOUR PLOT:-
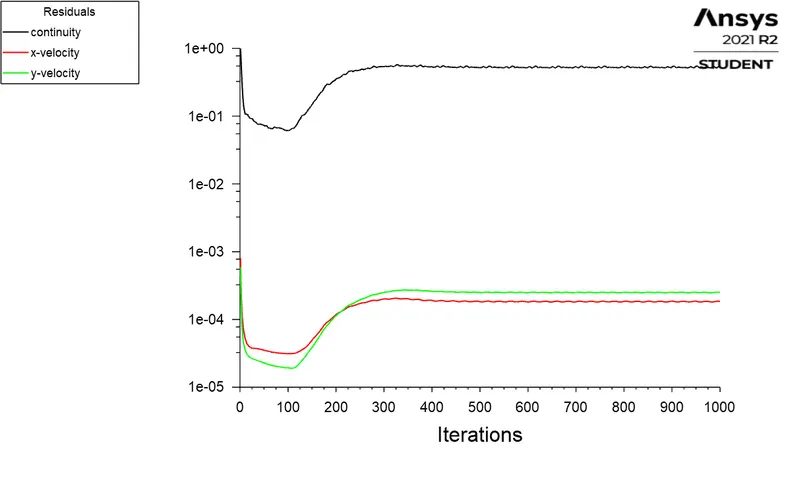
STEADY STATE SIMULATION FOR Re=100
VISCOSITY=0.05KG/MS
DENSITY= 1KG/M^3
VELOCITY=2.5M/SEC
ITERATIONS =1000
RESIDUAL PLOT: -
VERTEX AVG PLOT :-
DRAG CO-EFFICIENT PLOT: -
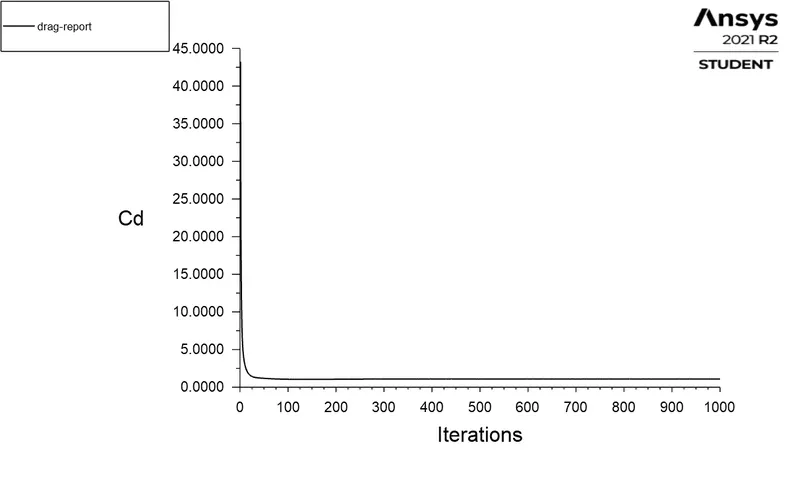
Cd= 1.0962357
LIFT CO-EFFICIENT PLOT:-
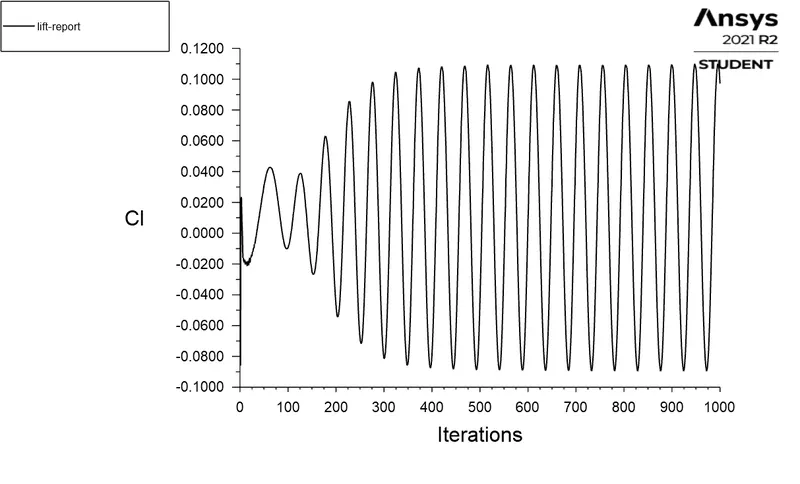
Cl= 0.097205166
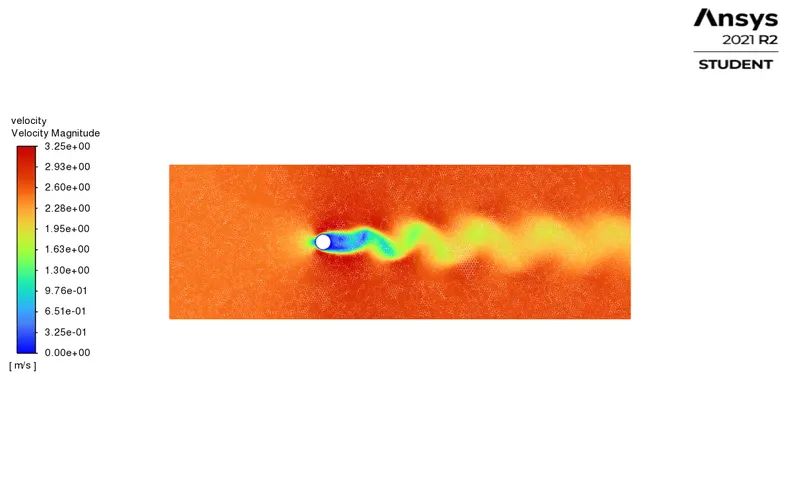
VELOCITY CONTOUR PLOT :-
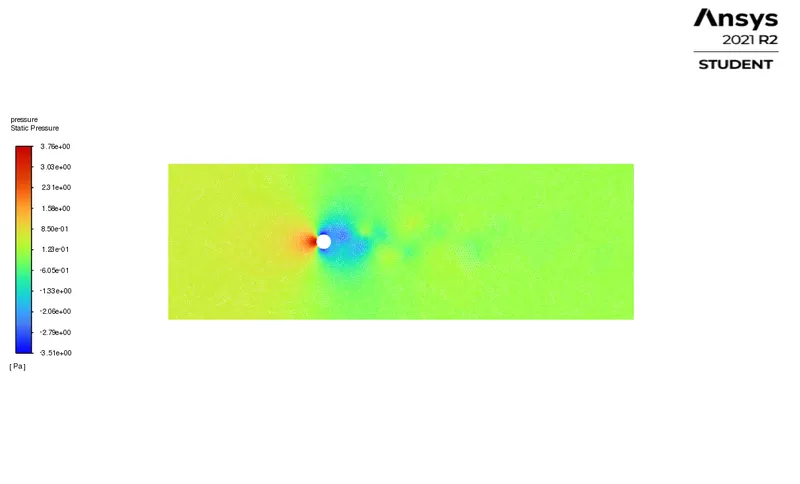
PRESSURE CONTOUR PLOT: -
STROUHAL PLOT: -
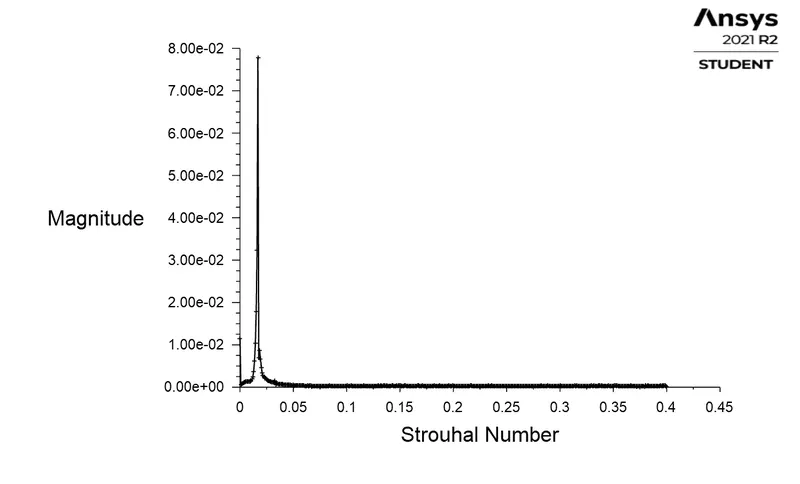
The Strouhal number is often given as

where f is the frequency of vortex shedding
L is the characteristic length
U is the flow velocity
UNSTEADY STATE SIMULATION FOR Re=100
VISCOSITY=0.05KG/MS
DENSITY= 1KG/M^3
VELOCITY=2.5M/SEC
ITERATIONS =1500
RESIDUAL PLOT: -
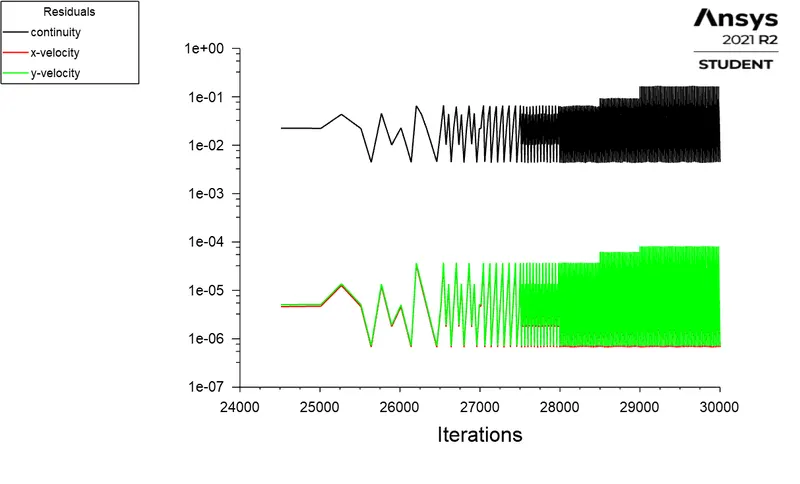
VERTEX AVG PLOT :-
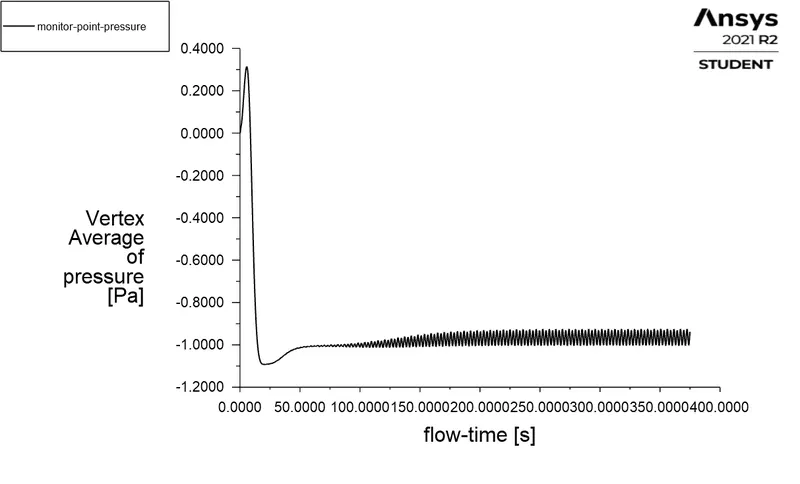
DRAG CO-EFFICIENT PLOT: -
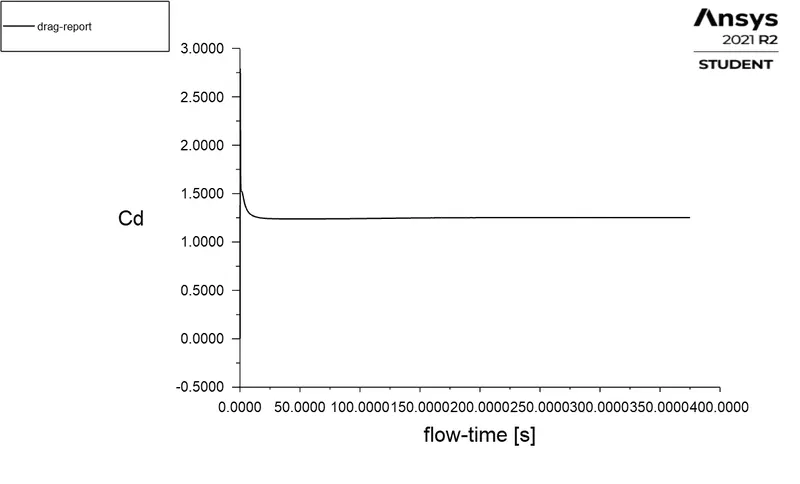
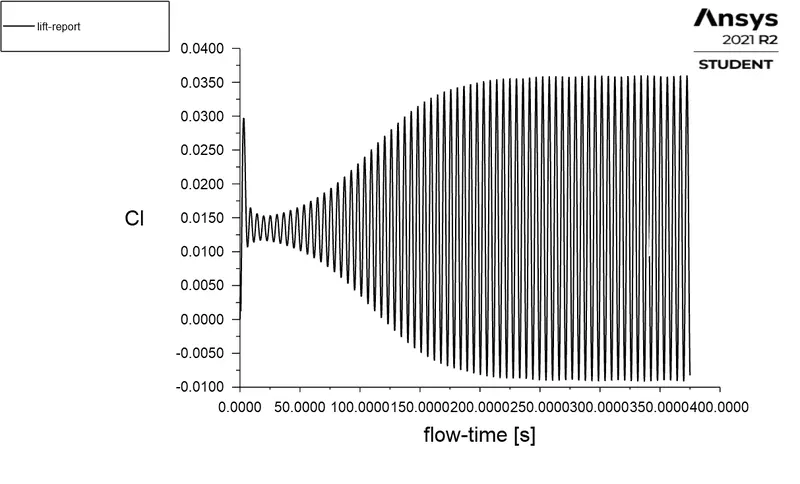
LIFT CO-EFFICIENT PLOT: -
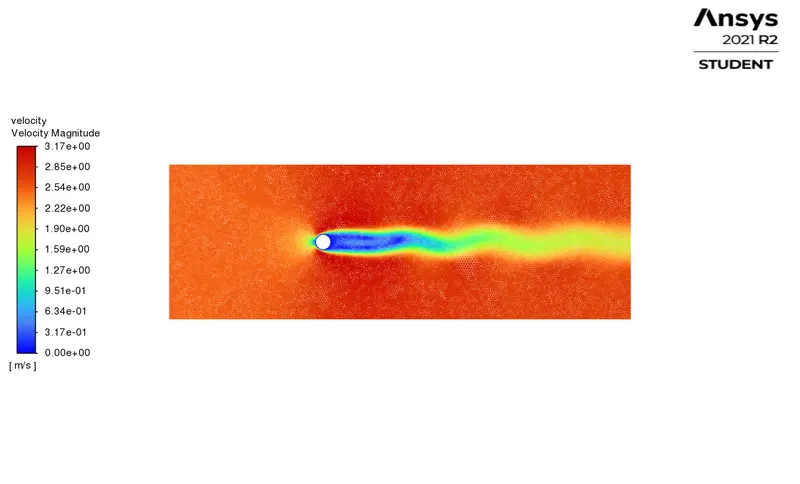
VELOCITY CONTOUR PLOT: -
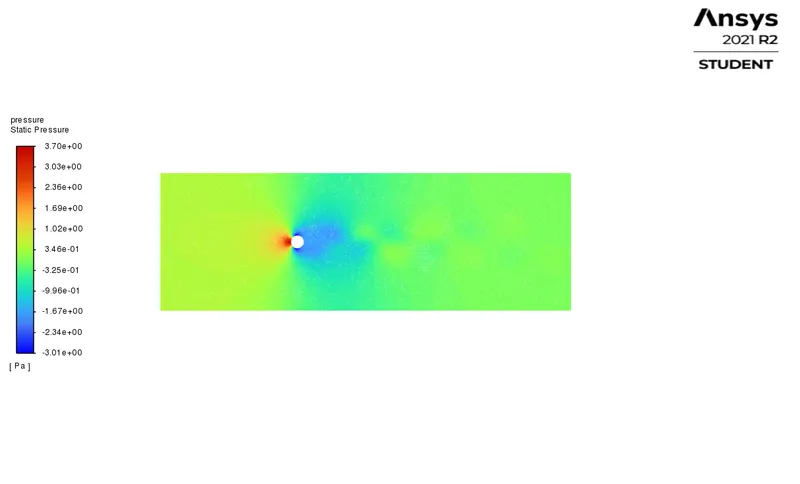
PRESSURE CONTOUR PLOT:-
STROUHAL PLOT: -
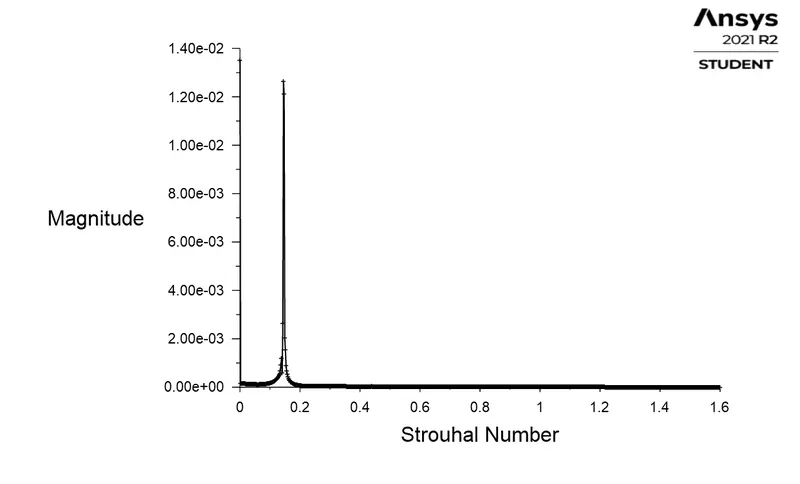
STROUHAL NUMBER = 1.68E-02.
STEADY STATE SIMULATION FOR Re=1000
VISCOSITY=0.05KG/MS
DENSITY= 1KG/M^3
VELOCITY=25M/SEC
ITERATIONS =1000
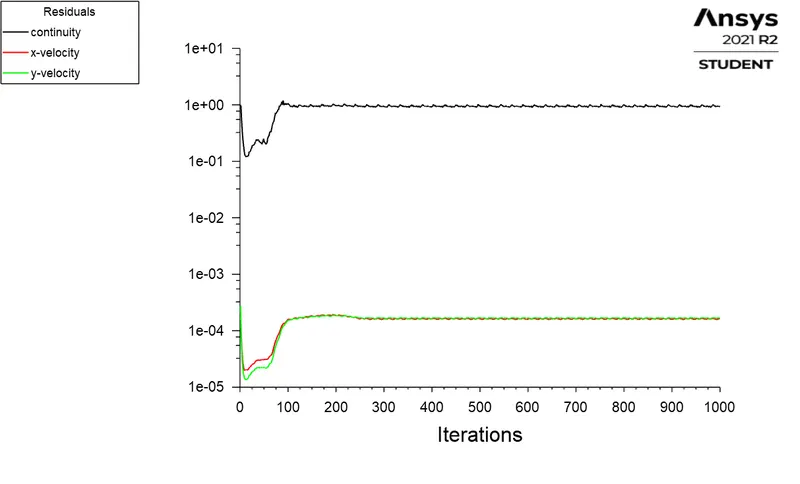
RESIDUAL PLOT: -
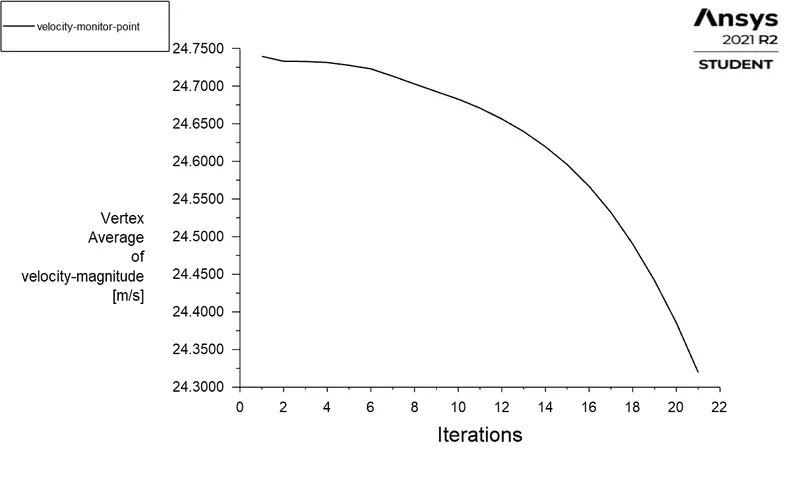
VERTEX AVG PLOT: -
DRAG COEFFICIENT PLOT:-
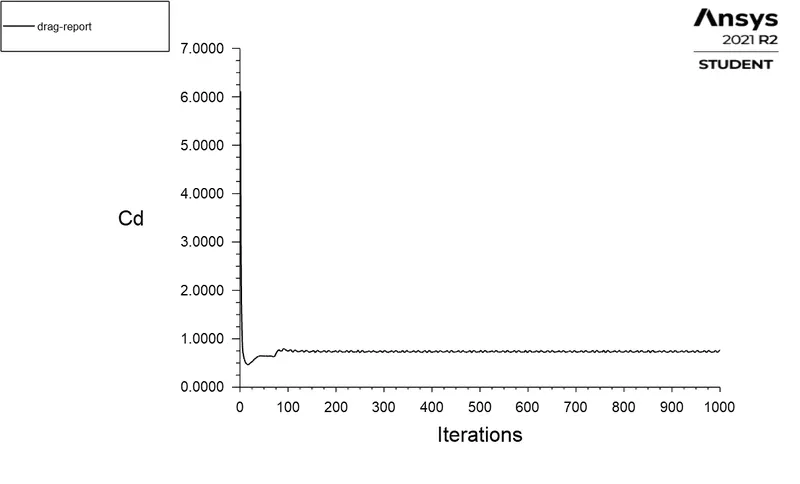
Cd=0.76091699
LIFT COEFFICIENT PLOT: -
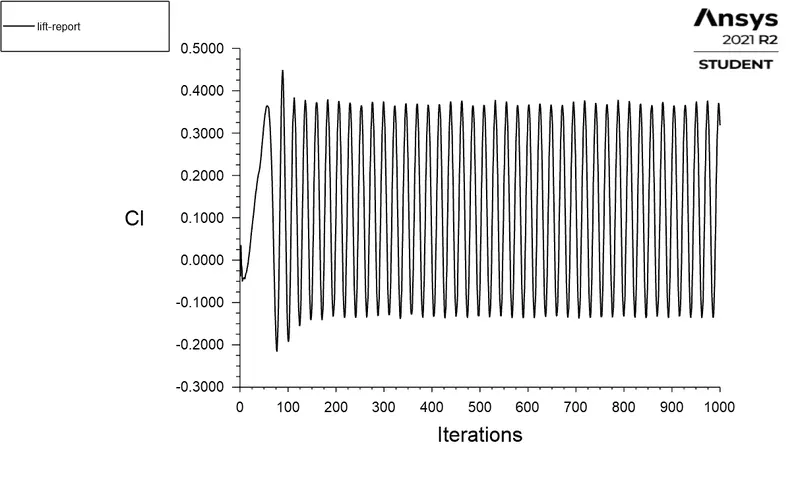
Cl= 0.31851738
VELOCITY CONTOUR PLOT: -
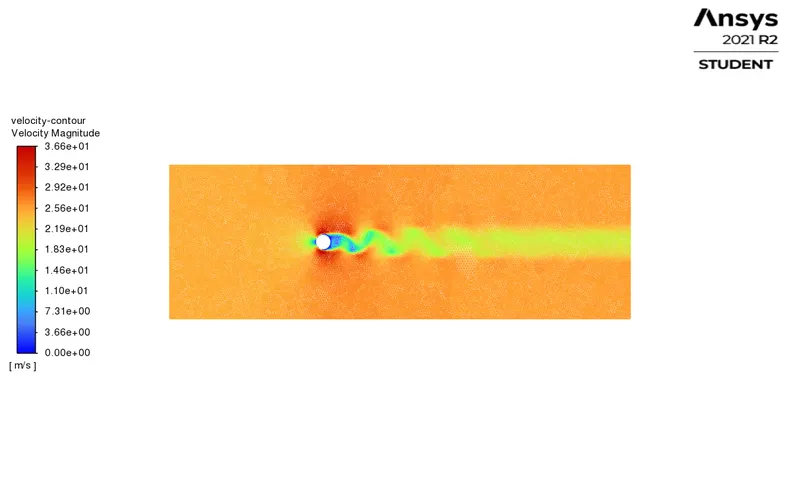
STEADY STATE SIMULATION FOR Re=10000
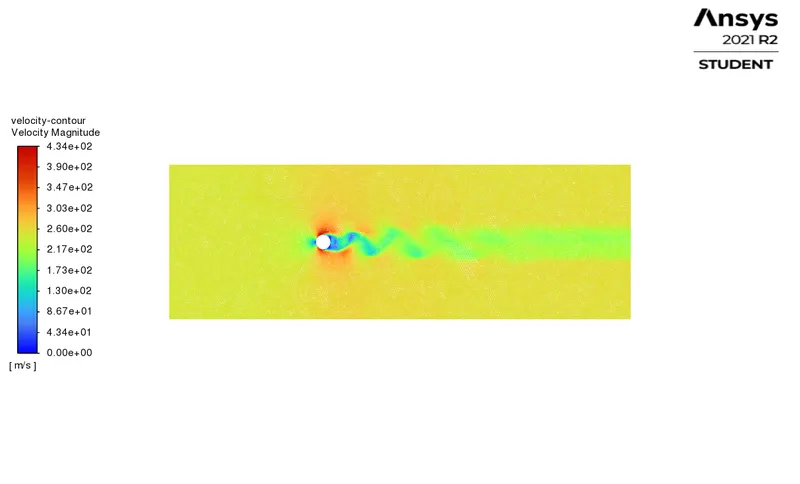
VISCOSITY=0.05KG/MS
DENSITY= 1KG/M^3
VELOCITY=250M/SEC
ITERATIONS =1000
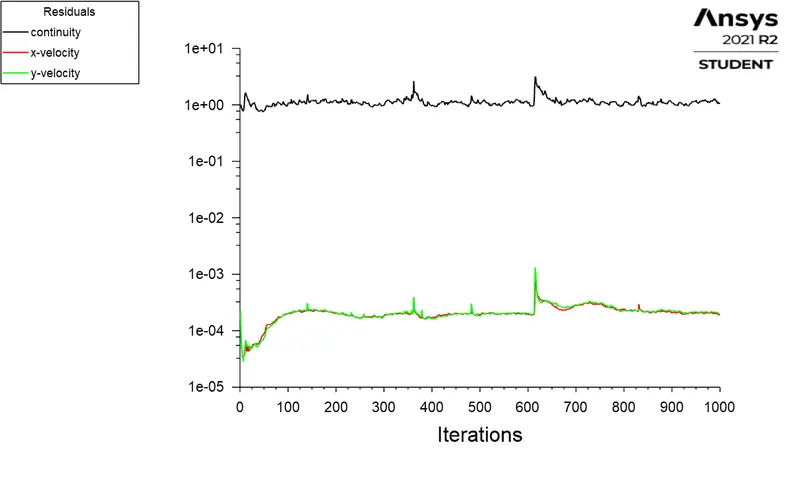
RESIDUAL PLOT:-
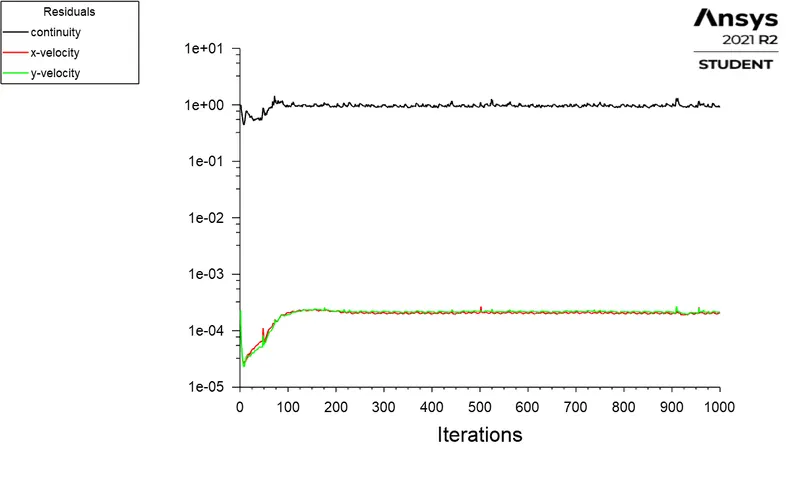
VERTEX AVG PLOT: -
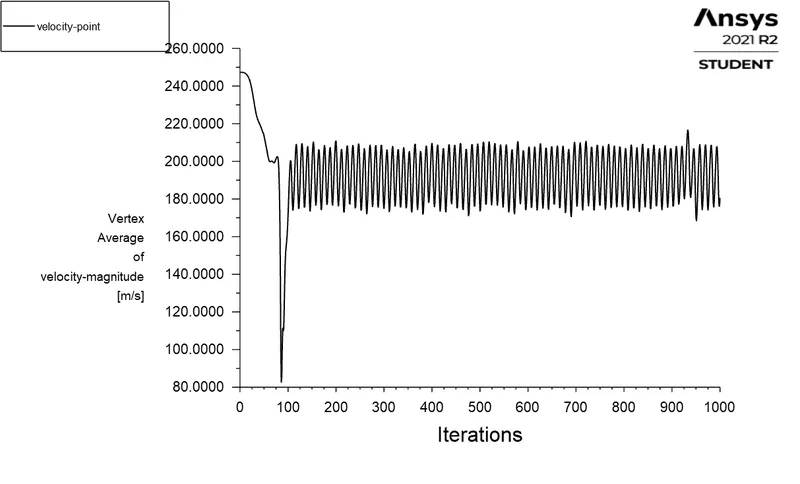
DRAG COEFFICIENT POT: -
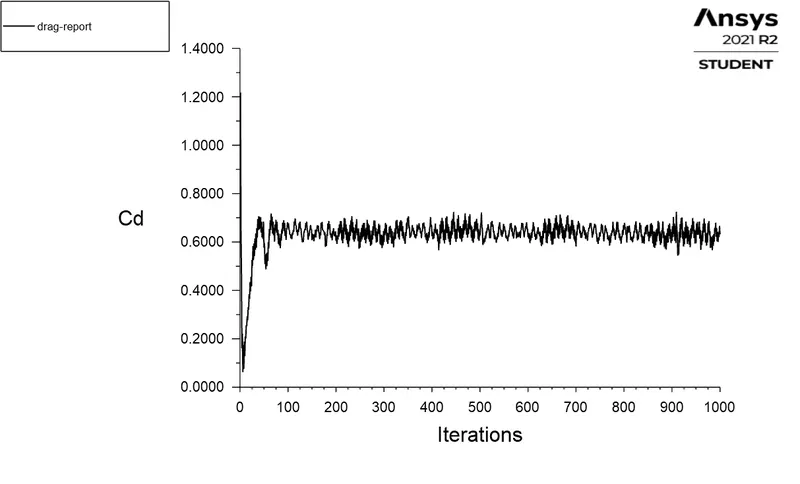
Cd= 0.63220616
LIFT COEFFICIENT PLOT: -
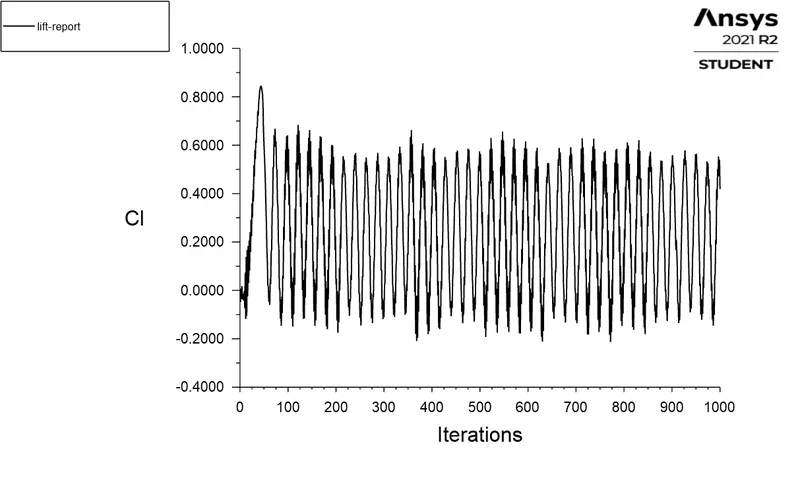
Cl= 0.4188178
VELOCITY CONTOUR PLOT: -
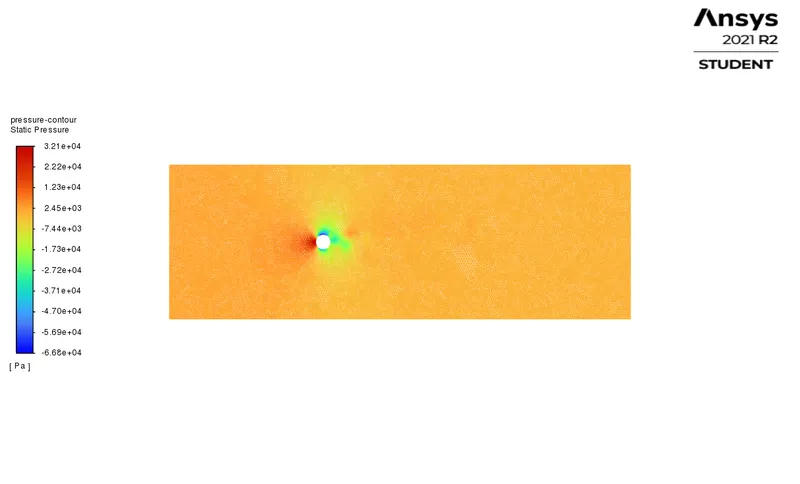
PRESSURE CONTOUR PLOT :-
STEADY STATE SIMULATION FOR Re=100000
VISCOSITY=0.05KG/MS
DENSITY= 1KG/M^3
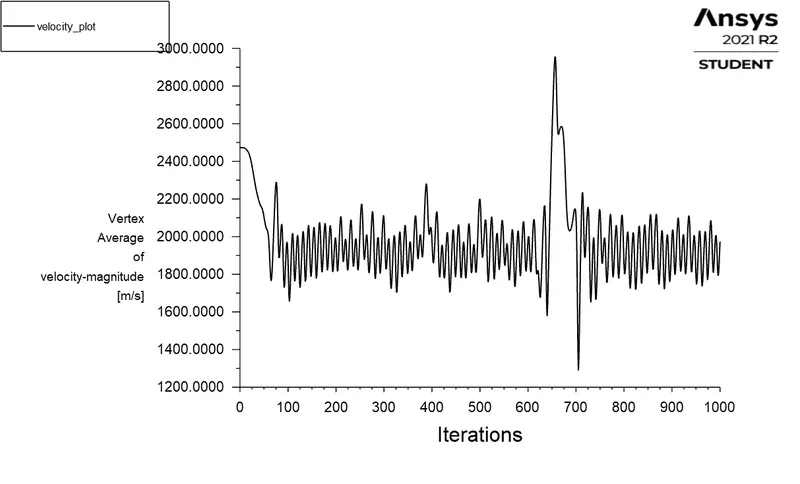
VELOCITY=2500M/SEC
ITERATIONS =1000
RESIDUAL PLOT: -
VERTEX AVG PLOT: -
DRAG COEFFICIENT PLOT: -
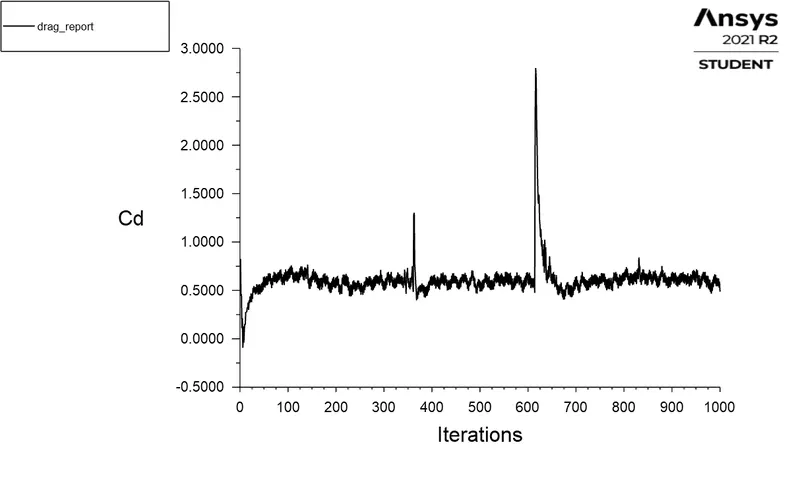
Cd= 0.48667144
LIFT COEFFICIENT: -
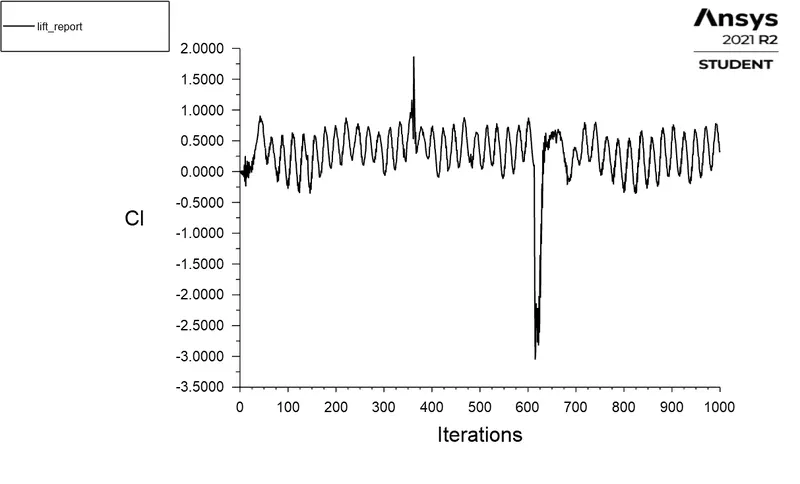
Cl= 0.34066981
VELOCITY CONTOUR PLOT: -
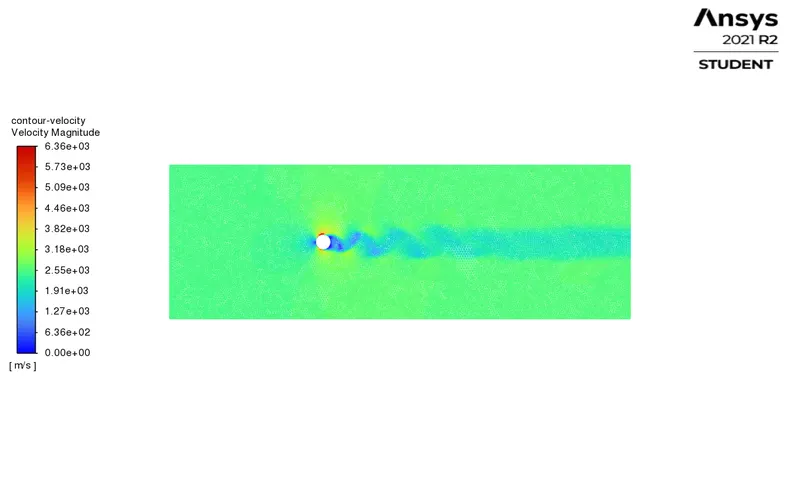
PRESSURE CONTOUR PLOT: -
COMPARISION OF REYNOLDS NUMBER WITH CO-EFFICIENT OF DRAG AND LIFT
| REYNOLDS NUMBER | DRAG COEFFICIENT | LIFT COEFFICIENT |
| Re= 10 | 3.3241635 | 0.00093065464 |
| Re=100 | 1.0962357 | 0.097205166 |
| Re=100(un-steady state) | 1.2519351 | 0.0082495736 |
| Re= 1000 | 0.76091699 | 0.31851738 |
| Re= 10000 | 0.63220616 | 0.4188178 |
| Re=100000 | 0.48667144 | 0.34066981 |
CONCLUSION: -
- As we seen from the above table co-efficient of drag decreases with the increase in reynolds number.
- The lift co-efficient increases with the increase in reynolds number.
- The vortex shedding behind the cylinder wall increases with respect to the increase of reynolds number.
- The transient simulation captures more vortices than steady state & also it takes more time to simulate the results.
Reference paper: -