Week 1- Mixing Tee
Aim:-
To simulate the flow of air through a mixing tee to understand the effect of length with respect to the momentum ratio of velocity of mixing air by using two types of pipe(i.e. short and long tee pipe)
Description: -
Mixing tee is a type of mixing mechanism. Mixing tees are widely used in the petrochemical, HVAC industry etc. in which two fluid streams with different physical and/or chemical properties mix together. Hot air flowing in the main pipe is mixed with cold air flowing through a tee.
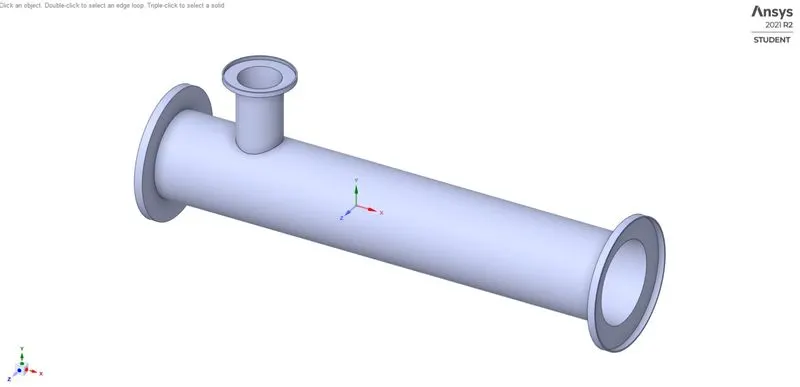
The above model is a mixing tee which we’re going to simulate by passing hot air of 36degC along the x-axis and cold air of 19degC along y-axis.
For the above experiment we’ve two cases:-
- Case 1
- Short mixing tee with a hot inlet velocity of 3m/s.
- Momentum ratio of 2, 4.
- Case 2
- Long mixing tee with a hot inlet velocity of 3m/s.
- Momentum ratio of 2, 4.
To calculate the moment ratio:-
Momentum ratio = velocity at cold inlet / velocity at hot inlet
CAD clean up:-
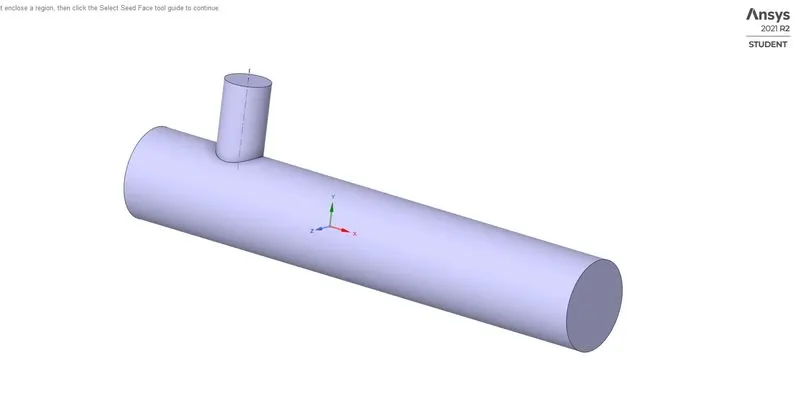
After opening Ansys software selecting Ansys fluent in that first option will be geometry where we are going to add the mixing tee model to clean up using Space claim.
After extracting the volume of the Cad model then we move to mesh option.
Mesh:-
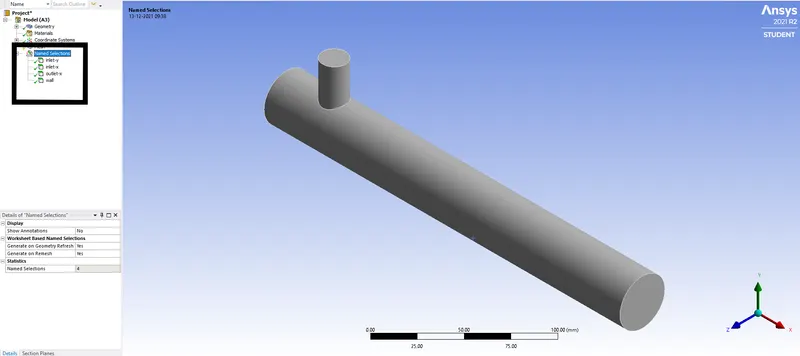
The cleaned Cad model will appear then adding names to the faces of the mixing tee
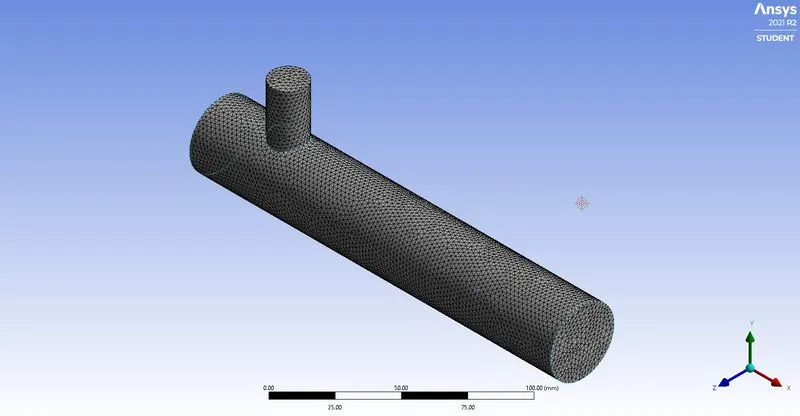
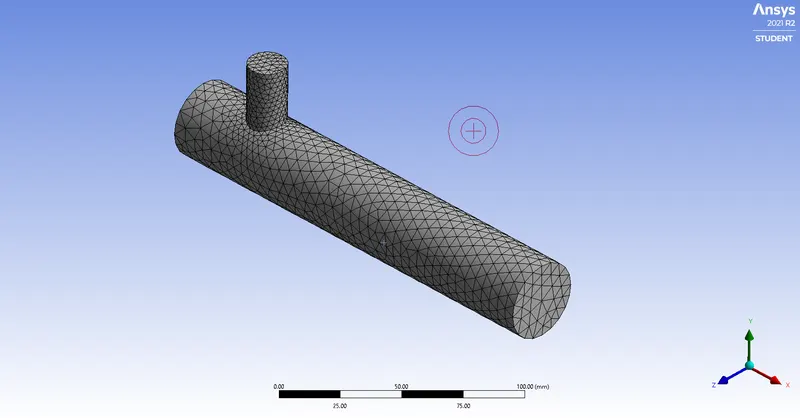
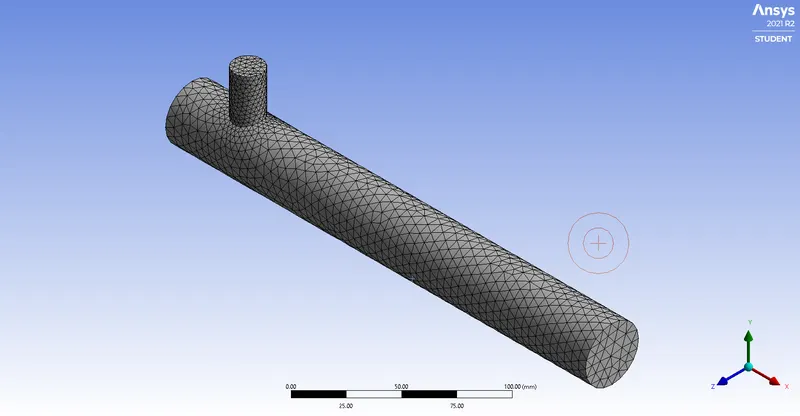
After naming the faces of the mixing tee with respect to the boundary conditon , meshing of the mixing tee by clicking generate mesh option in the mesh icon in that the mesh size were changeable. Mesh size-2mm
Setup:-
In this stage we apply the velocity and temperature details to the respective boundary layers, also selecting the turbulence models like k-epsilon & k-omega.
In this challenge we used k-epsilon turbulence module for every case.
Cfd post:-
In this stage we see the post results of the mixing tee simulation using the k-epsilon turbulence model and to make a plane along xy axis to see the contour plots clearly.
Momentum ratio is 2.
Inlet velocity(x)=3m/s
Inlet velocity(y)=6m/s
Inlet temp(x)=36degC
Inlet temp(y)=19degC
Residual plot:-
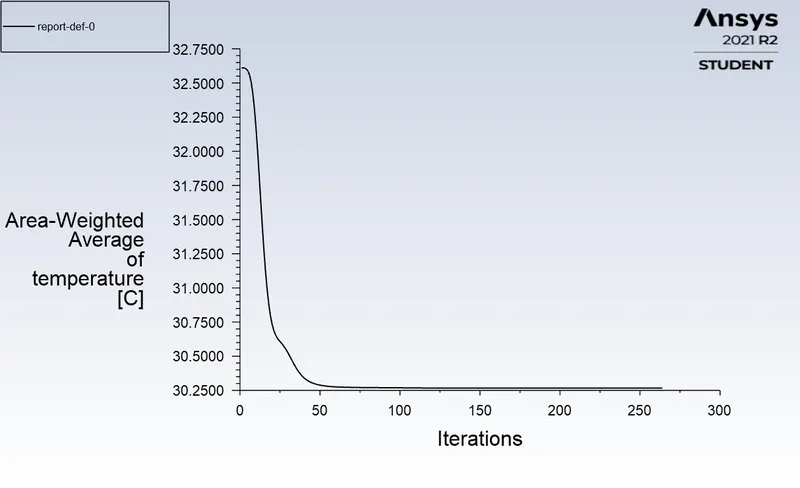
Temperature plot: -
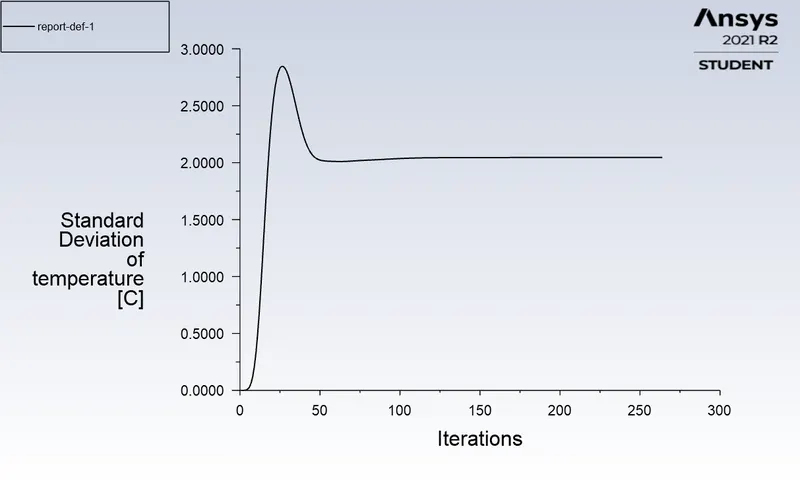
Standard deviation plot:-
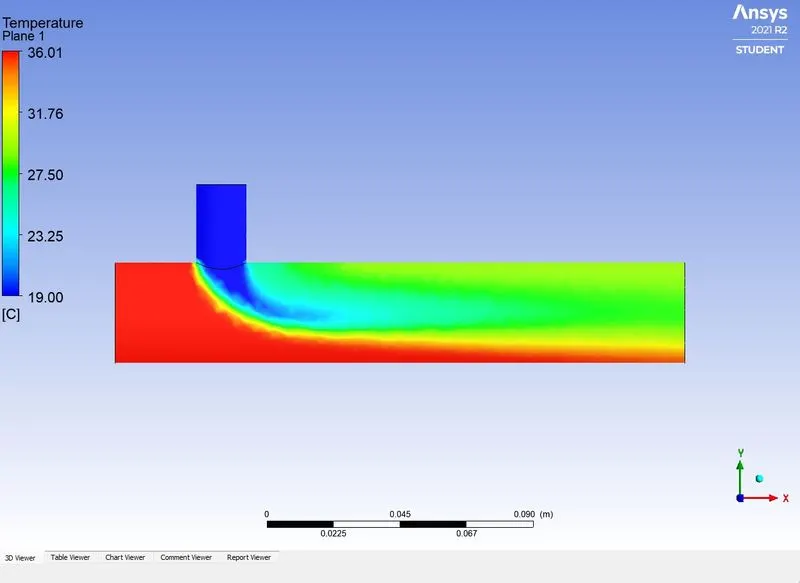
Temperature contour plot:-
Velocity contour plot:-
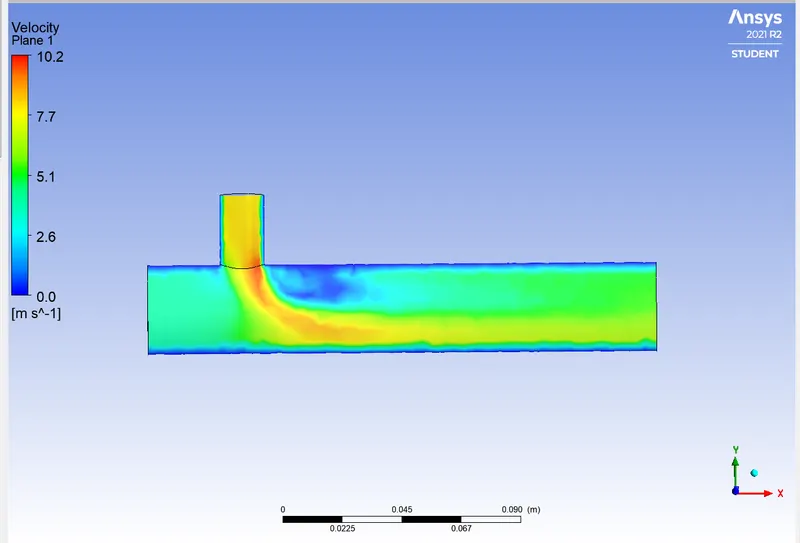
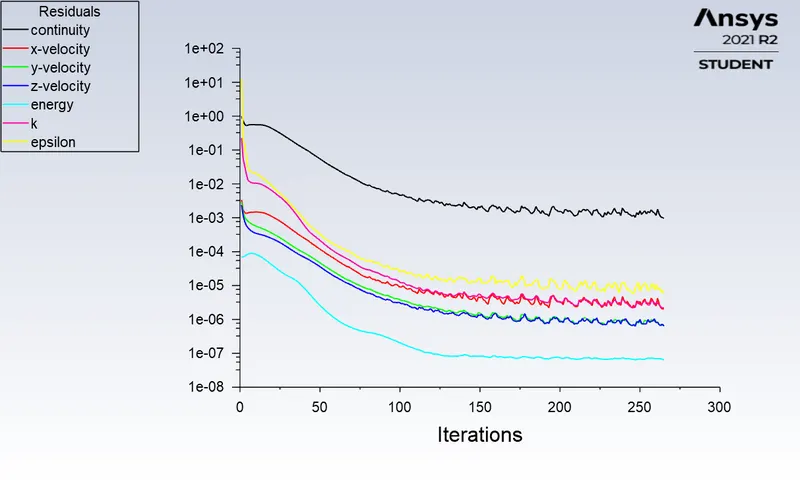
Above contour plots are showing the diffusion of temperature and velocity with respect to the mesh size and momentum ratio value. Number of elements in the 104716 , solution is converged at 150th iteration. Area weighted average=30.26659degC & Standard deviation=2.045488degC.
Case 1:-
mesh size 5mm
short.tee with momentum ration 2 & inlet-x velocity 3m/s.
Residual plot: -
Area weighted avg plot:-
Standard deviation plot:-
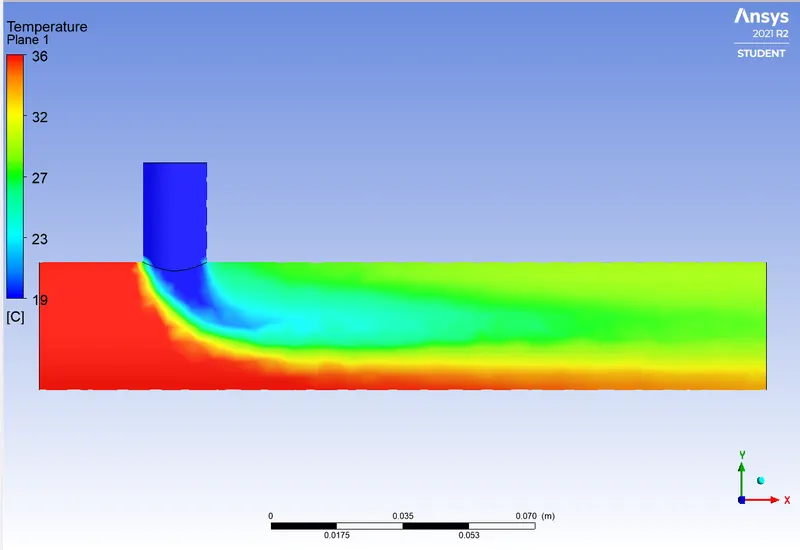
Temperature contour plot: -
Velocity contour plot: -
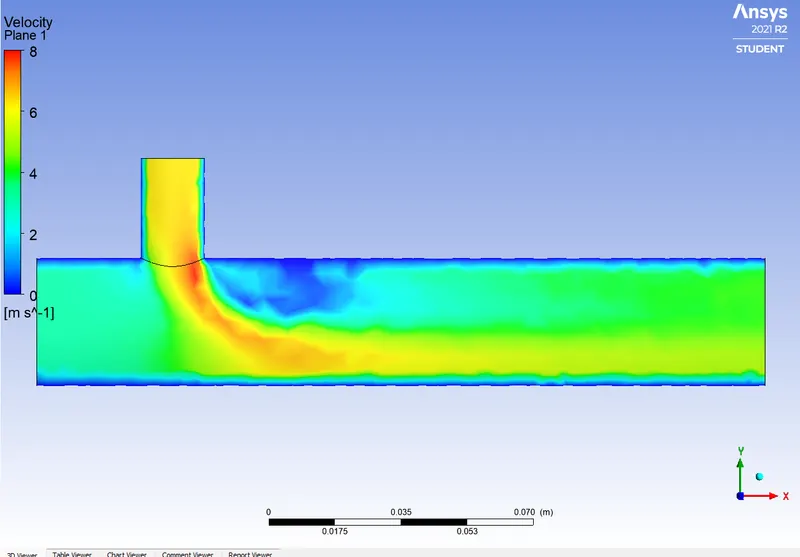
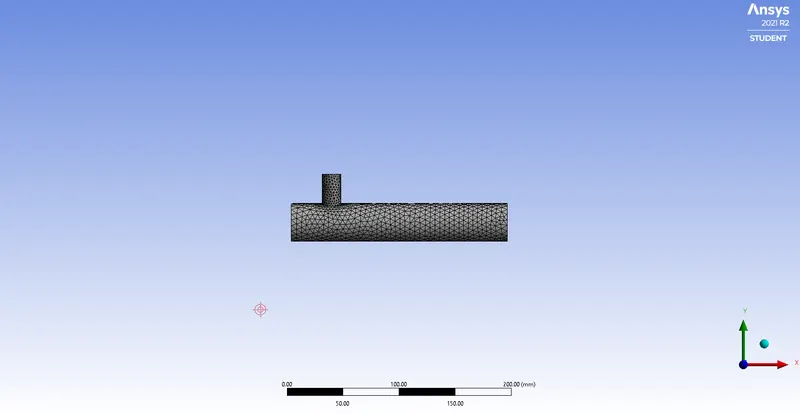
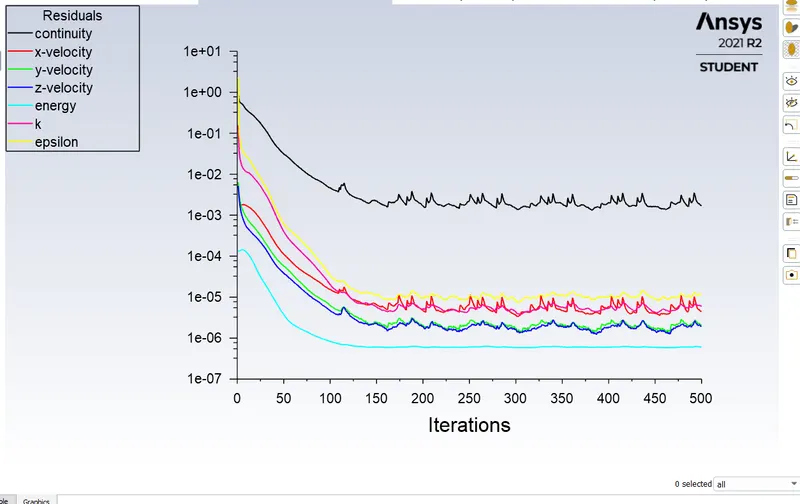
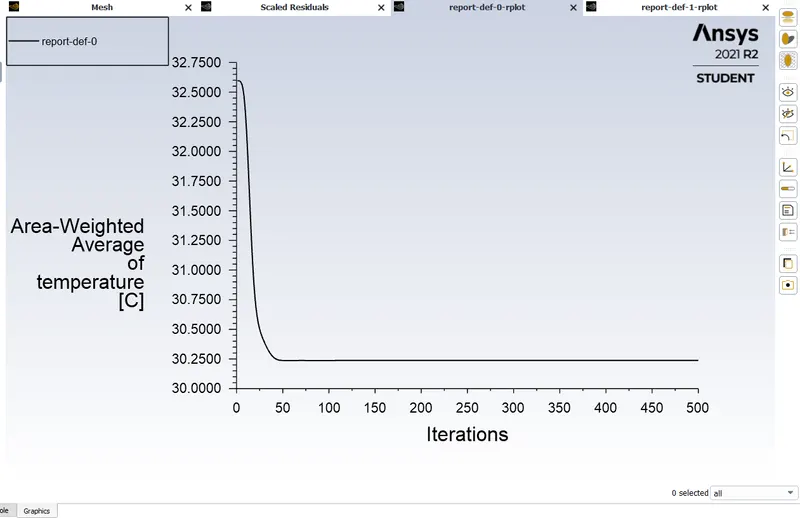
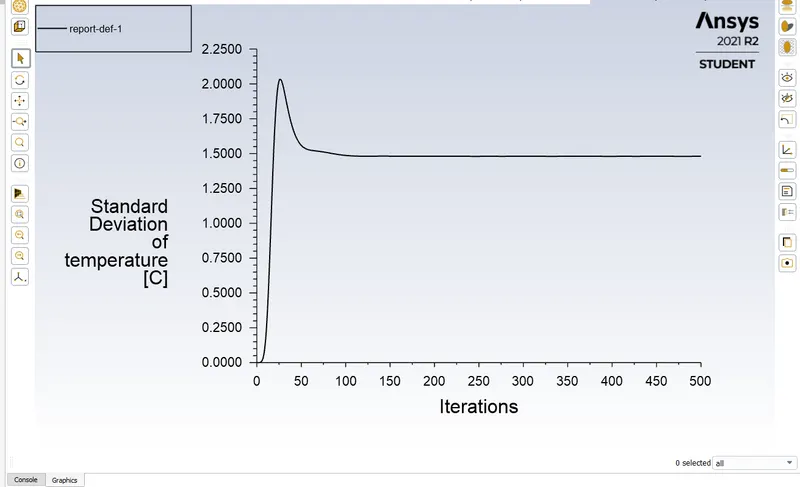
from the above plots the cell count is 14166 and solution is converged at 250th iteration.
Average weighted avg temperature- 30.238097degC
Standard deviation temperature-1.480737degC
While comparing the above solution this shows the lower deviation in temperture.
Mesh size 8mm:-
short tee with momentum ratio 2& inlet-x 3m/s
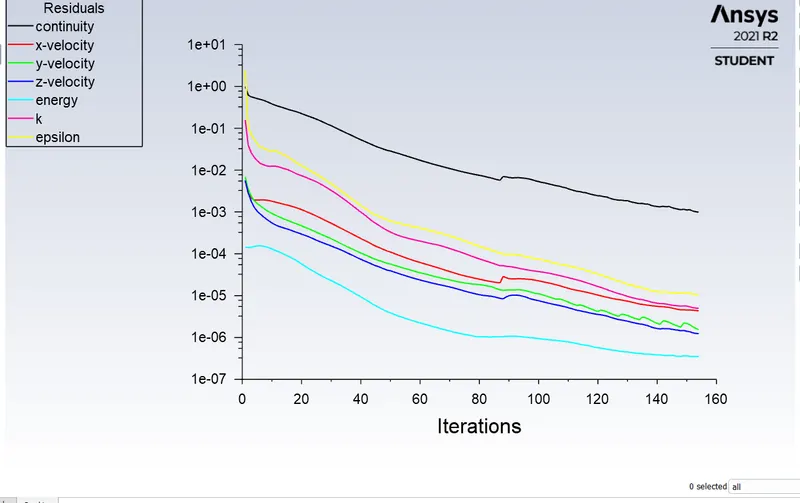
Residual plot:-
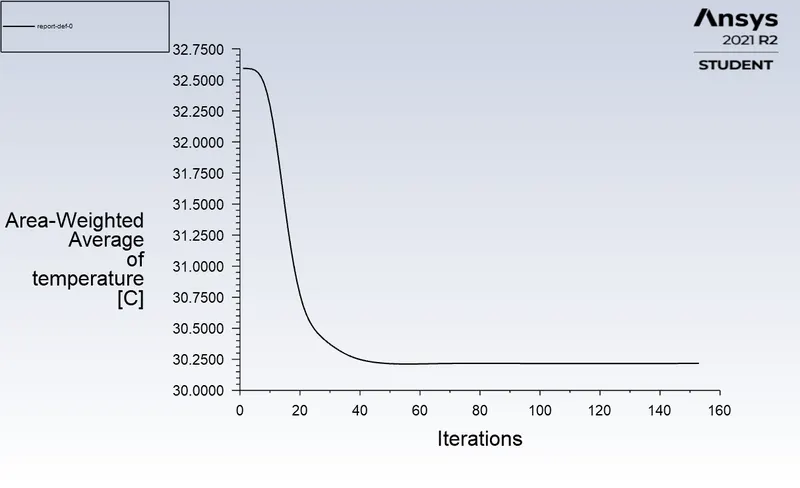
Area weighted average plot:-
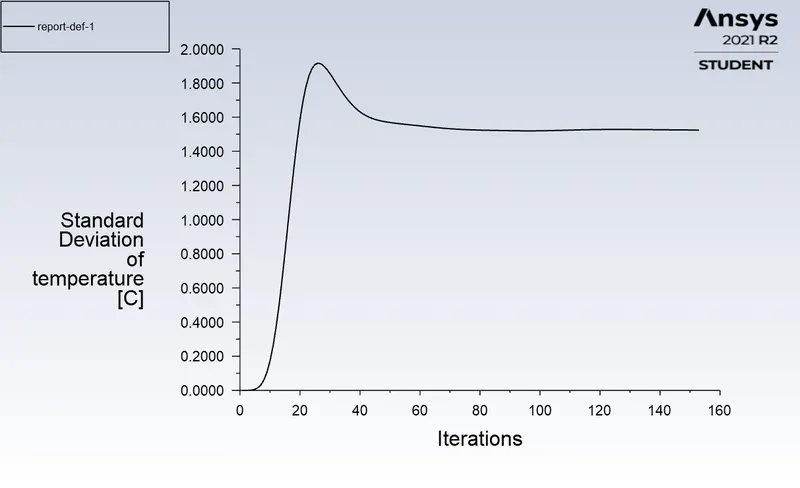
Standard deviation plot: -
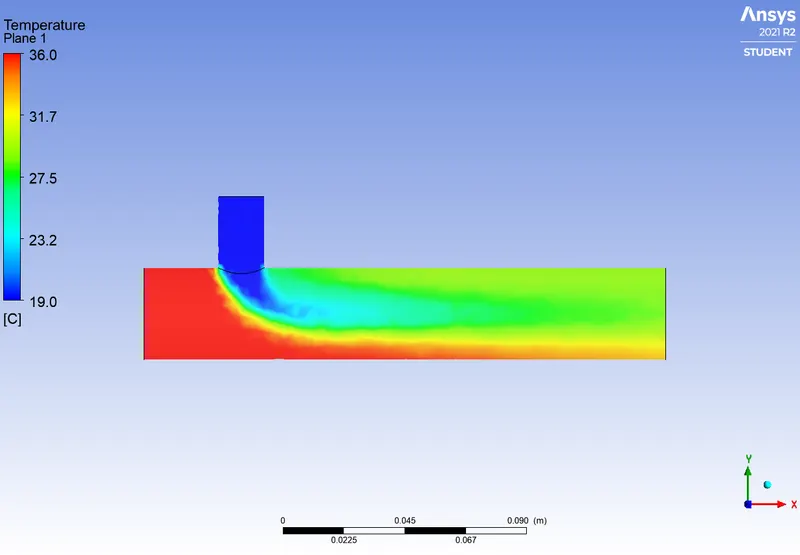
Temperature contour plot: -
Velocity contour plot:-
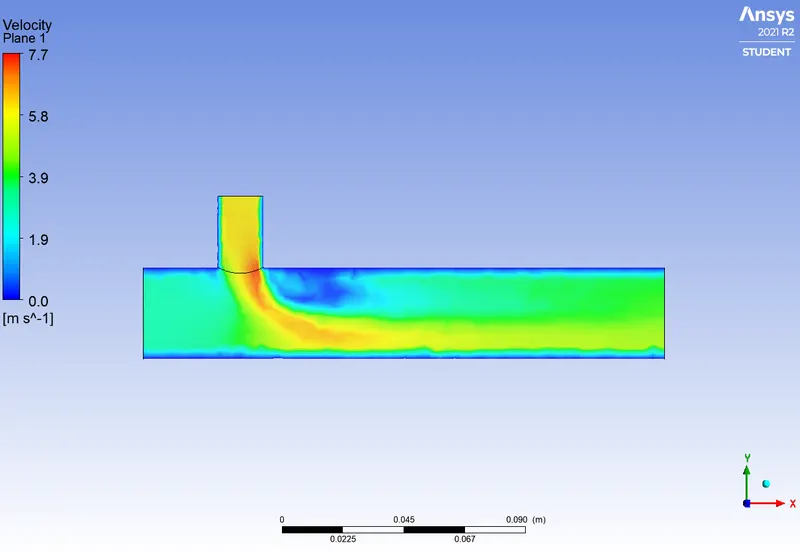
from the above plots the cell count is 14166 and solution is converged at 158th iteration.
Average weighted avg temperature- 30.21733 degC
Standard deviation temperature-1.524048degC
While comparing the above solution this shows the higher deviation in temperture.
From comparing the above three cases with three different element size using k-epsilon turbulence model the 5mm element size shows the lower standard deviation temperatures.
Case 1 :-
Short tee with mometum ration 4
inlet-x will be 3m/s
inlet-y will be 12m/s
Mesh size default(10.219mm)
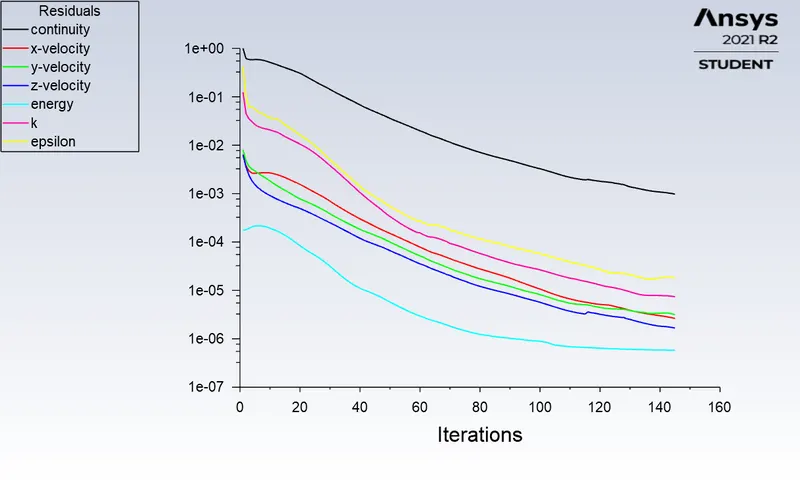
Residual plot: -
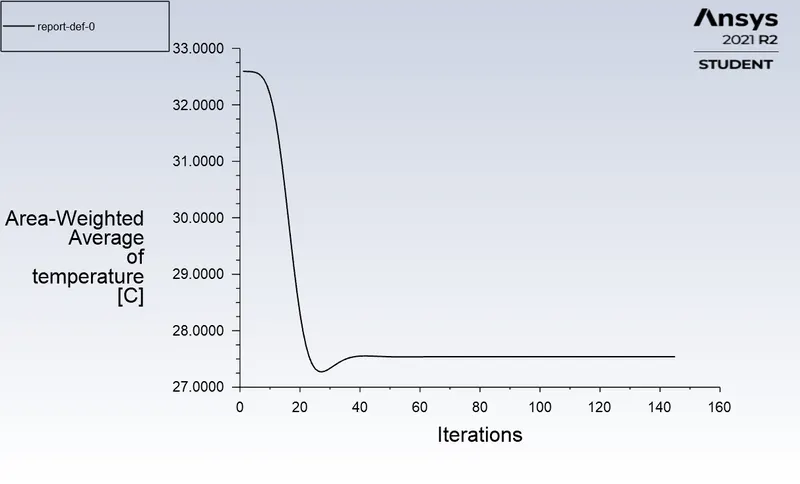
Area weighted average plot: -
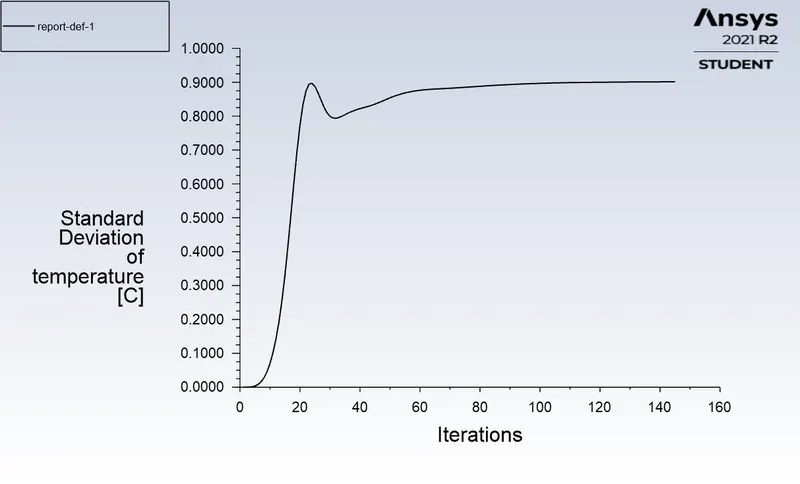
Standard deviation plot: -
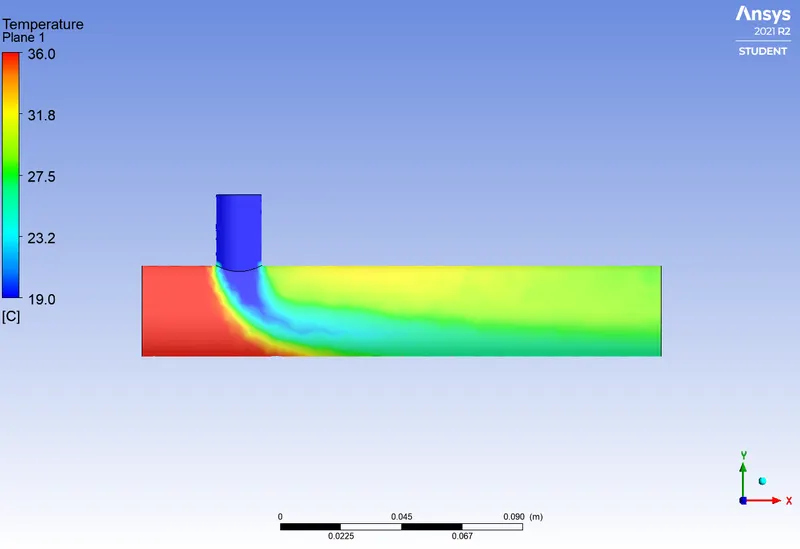
Temperature contour plot:-
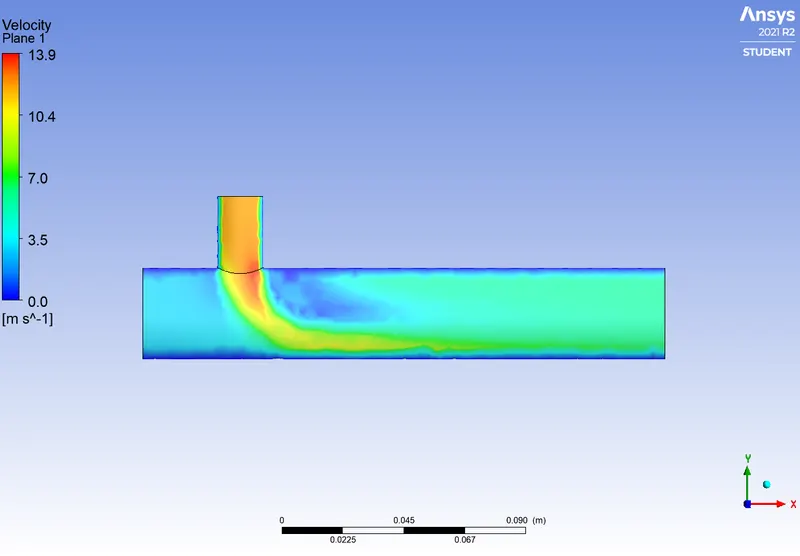
Velocity contour plot: -
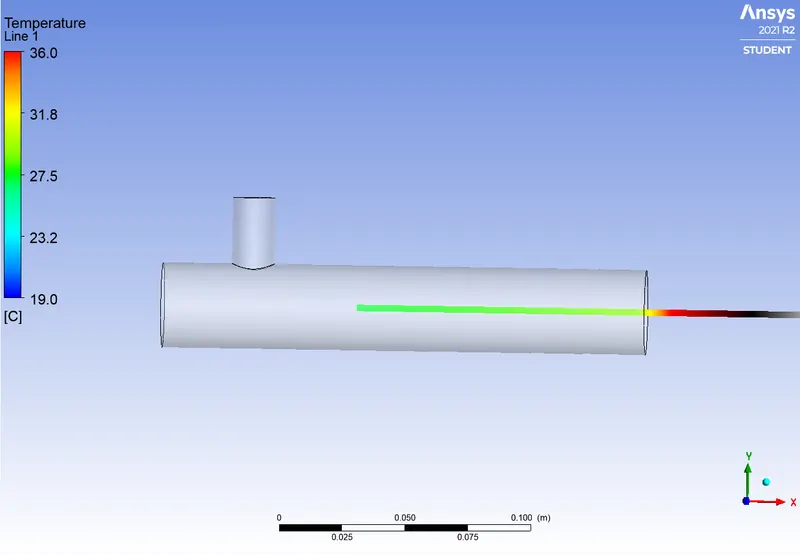
Temperature line plot:-
Velocity line plot:-
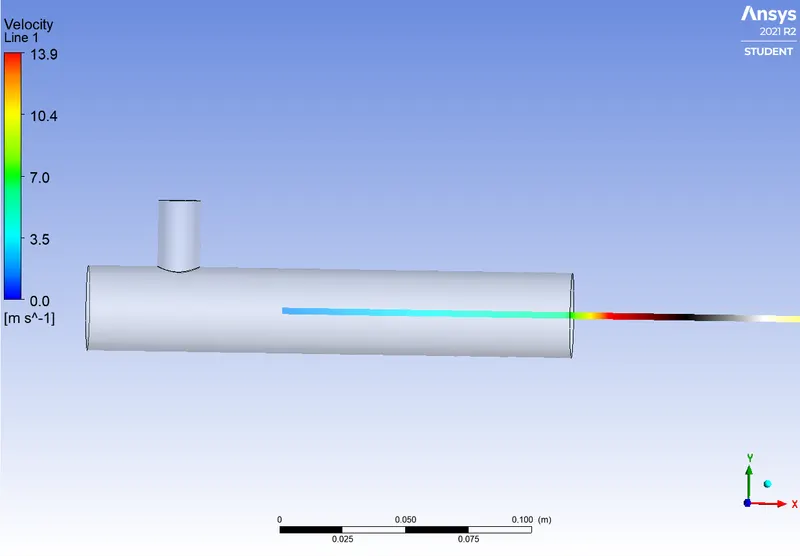
For this mixing tee simulation of momentum ratio 4. Here we used k-epsilon method.
the cell count is 12444, the solution is converged at 145th iteration.
Standard deviation- 0.901348degC
Average weighted average-27.53962degC
Case 2:-
Long.tee with momentum ration 2
inlet-x will be 3m/s
Mesh:-
mesh size default (13.583mm)
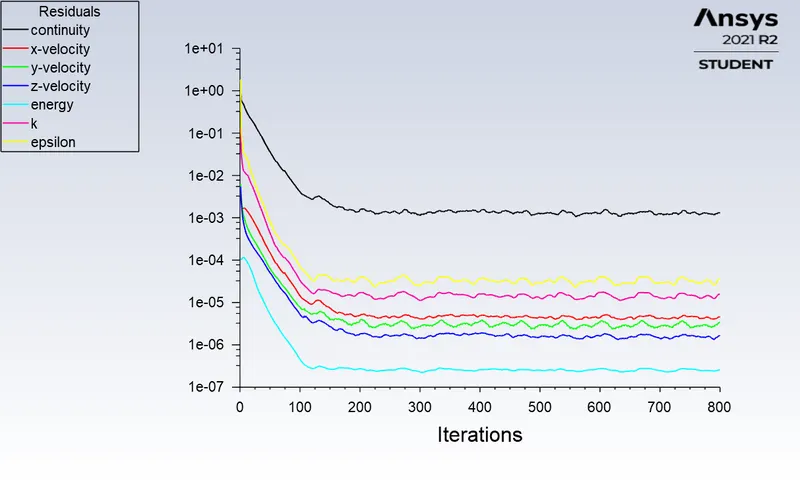
Residual plot:-
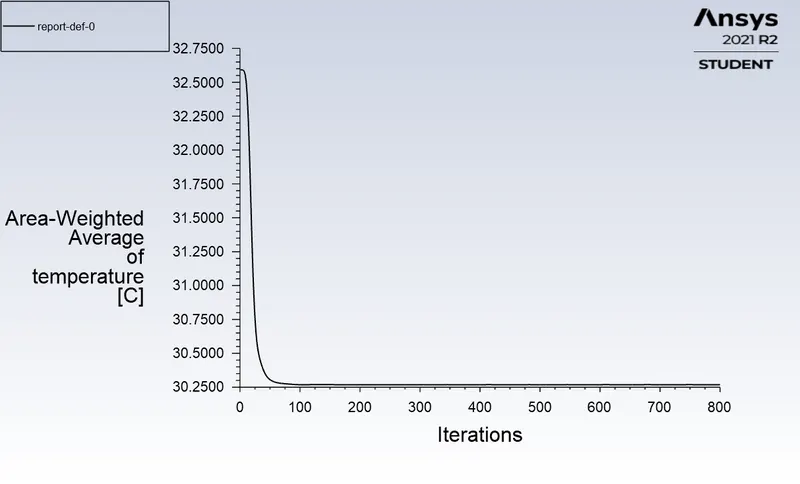
Area weighted average plot:-
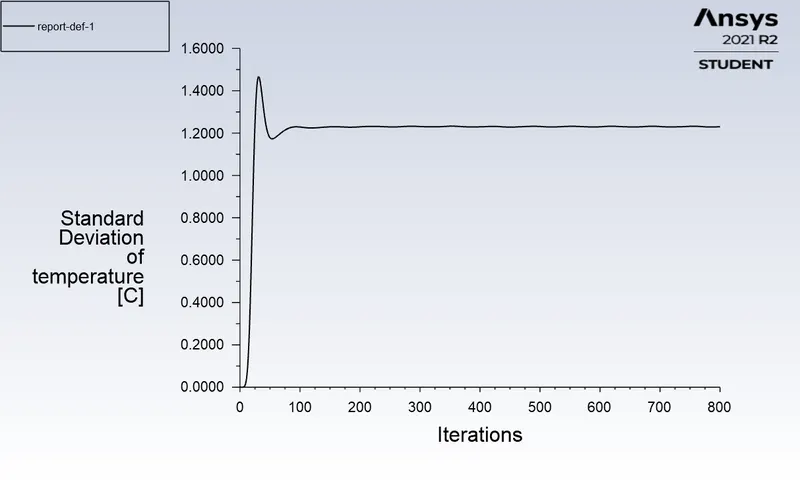
Standard deviation plot:-
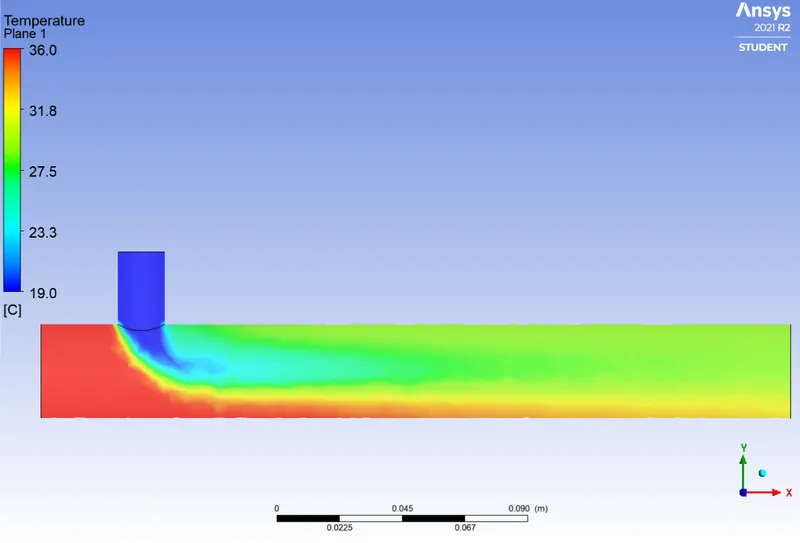
Temperature contour plot:-
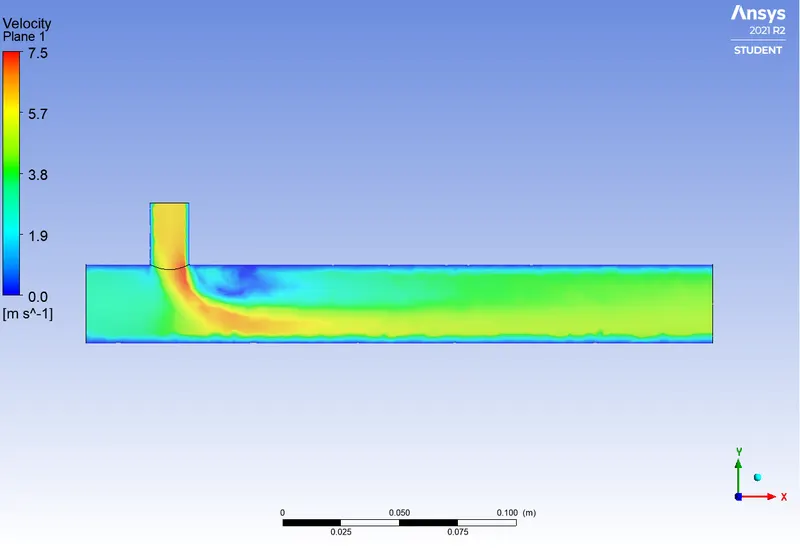
Velocity contour plot: -
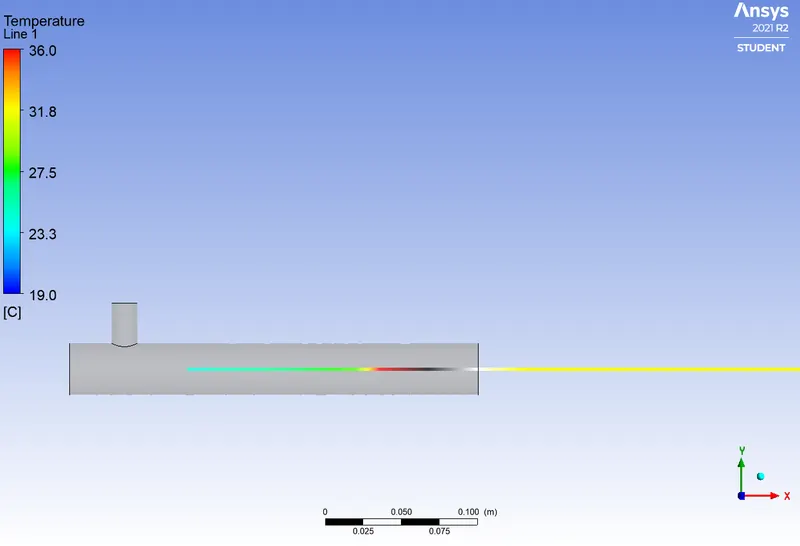
Temperature contour line plot: -
Velocity contour line plot: -
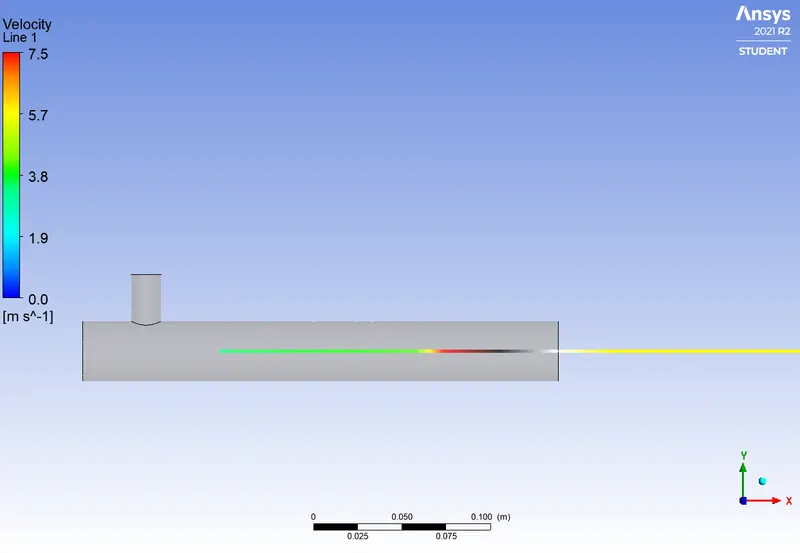
From the above Simulation of long.tee using k-epsilon turbulence model the total cell is 15566 and solution converged at 230th iteration, area weighted average- 30.26818degC, Standard deviation temperature- 1.230068degC.
Case 2:-
Long tee with momentum ratio of 4
inlet-x velocity is 3m/s
Mesh :-
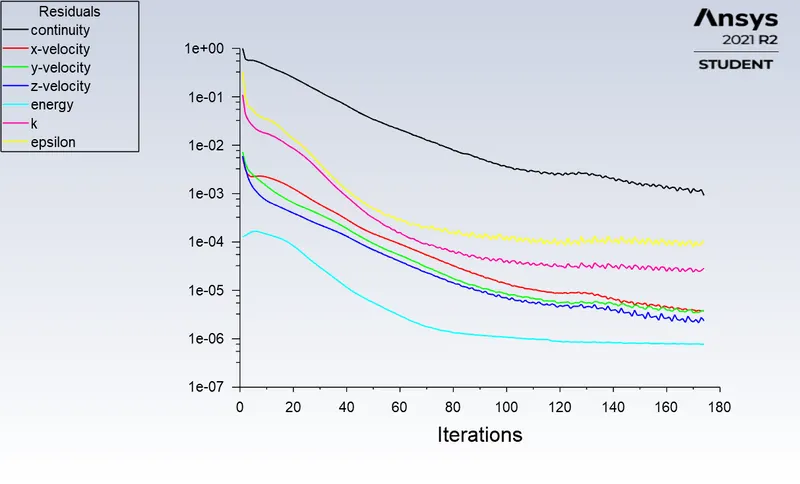
Residual plot: -
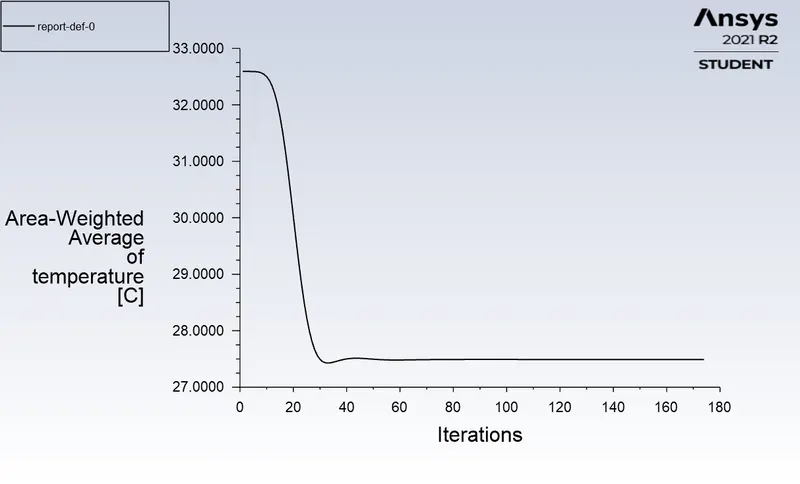
Area weighted average plot: -
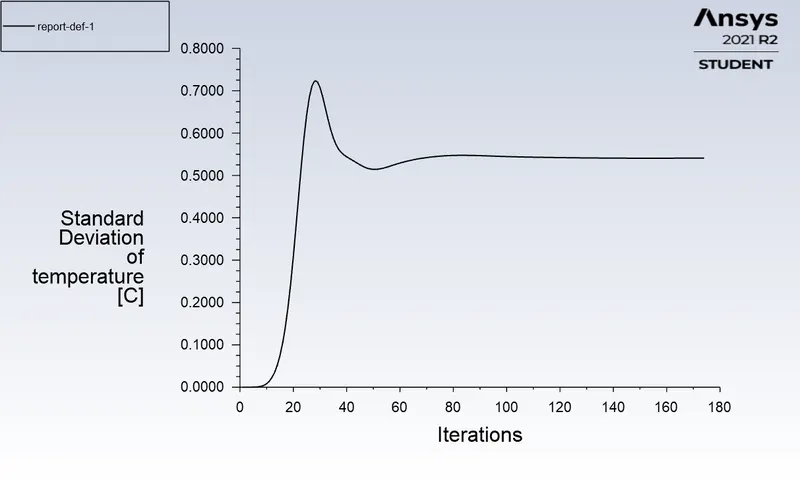
Standard deviation plot:-
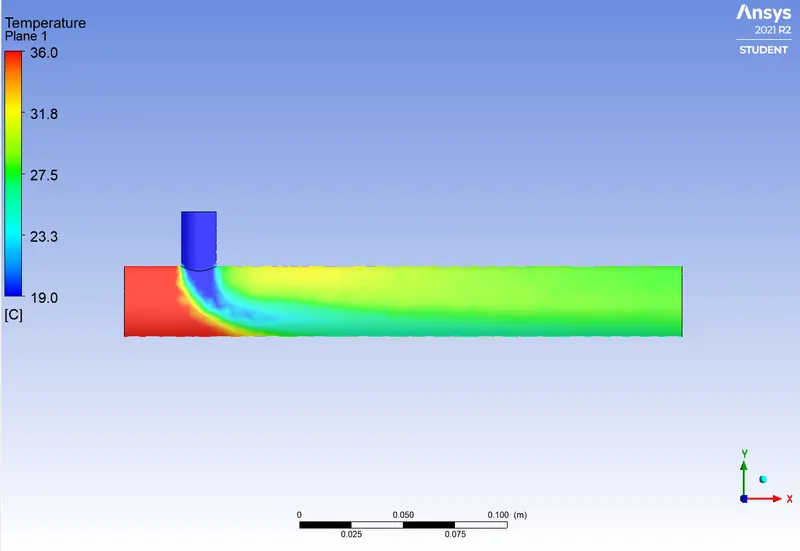
Temperature contour plot: -
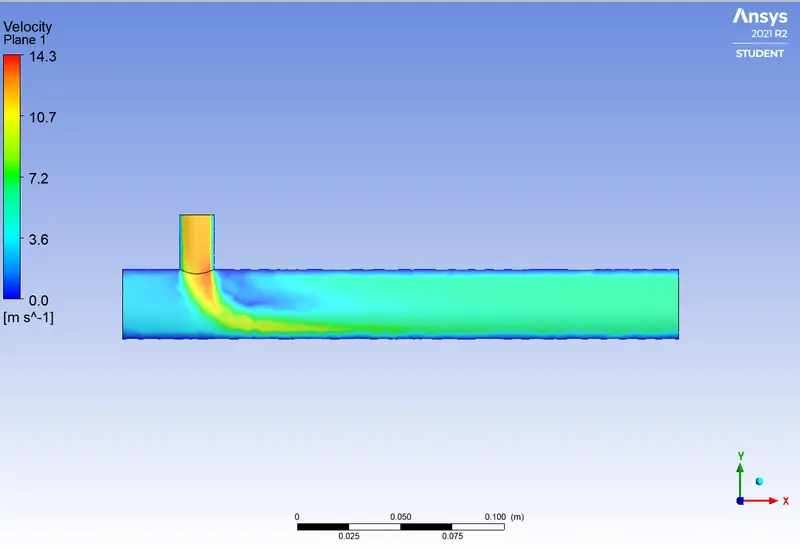
Velocity contour plot: -
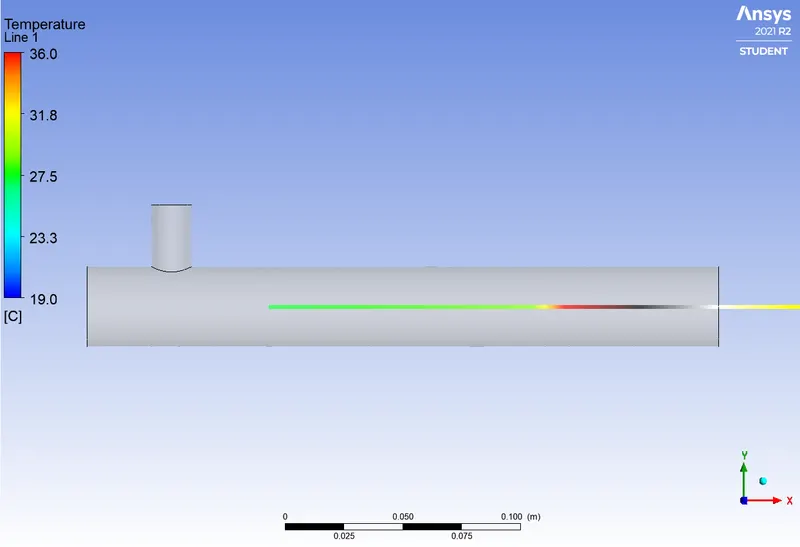
Temperature contour line plot: -
Velocity contour line plot: -
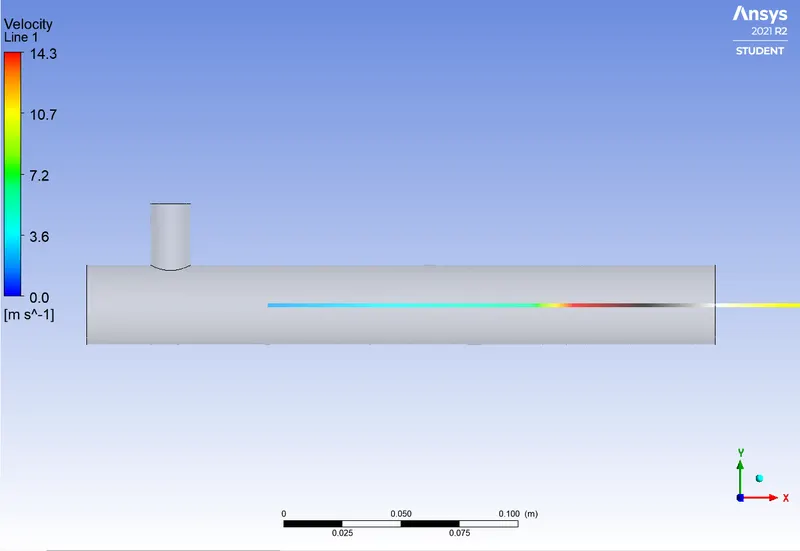
For the above simulation of long.tee with momentum ratio 4, using k-epsilon turbulence model.
total cell count is 15566
mesh size is defualt-13.853mm
solution converged at 174th iteration
Area weighted average temperature- 27.49085degC
Standard deviation temperature- 0.5410328degC
Comparing all the results the long tee with momentum ratio 4 has the low standard deviation temperature.
Comparing all the cases:-
| Case | Element size | Outlet temp | Standard deviation temp | Converged | Cell count |
| Short.tee | 2mm | 30.2665 | 2.0454 | 150th iteration | 104716 |
| Short.tee | 5mm | 30.2381 | 1.4807 | 250th iteration | 14166 |
| Short.tee | 8mm | 30.2173 | 1.5240 | 158th iteration | 12444 |
| Short.tee | default(10.219mm) | 27.5396 | 0.9013 | 140th iteration | 12444 |
| Long.tee | default(13.853mm) | 30.2681 | 1.2300 | 230th iteration | 15566 |
| Long.tee | default(13.853mm) | 27.5396 | 0.5410 | 145th iteration | 15566 |