Week-11 Challenge: Braking
Objective:
- To calculate the energy required for braking.
- Explaination on why electric motor can’t develop braking torque at high speed similar to starting? How electric and mechanical brakes are coordinated?
- Write a MATLAB program which plots contour of given motor speed, torque and efficiency values.
Description:
1.
First, a user defined drive cycle was considered and braking energy for the respective drive cycle was calculated as shown below using the following formula,
Braking energy = 0.5 * mass * velocity^2.
From the user-defined drive cycle following were the braking energy calculated at respective speed reduction,
|
Sl. No. |
Speed(mps) |
Braking energy (J) |
|
1 |
30 – 28 |
62667.747 |
|
2 |
28 – 25 |
49958.3447 |
|
3 |
40 – 35 |
97918.355 |
|
4 |
42 – 40 |
127893.362 |
|
5 |
60 – 55 |
241798.3885 |
|
6 |
55 – 50 |
199833.3789 |
|
7 |
50 – 35 |
97918.35568 |
|
8 |
35 – 20 |
31973.34063 |
|
9 |
20 – 15 |
17985.0041 |
|
10 |
15 – 10 |
7993.335157 |
|
11 |
10 – 8 |
5115.734501 |
|
12 |
8 – 6 |
2877.600657 |
|
13 |
6 – 5 |
1998.333789 |
|
14 |
5 - 2 |
319.7334063 |
*Note: Mass of the vehicle was taken as 800kg.
Total Braking energy = 946.251015 KJ.
2.
As we know that, the speed is proportional to the frequency. Until the base speed (nominal speed) the voltage to frequency ratio is kept constant which in turn keeps the air gap magnetic flux constant. The torque is proportional to the flux hence remains constant until the base speed. As power is the product of speed & torque, the power keeps increasing with speed until the base speed. This is called the constant torque mode of operation. Beyond base speed, the speed is increased by increasing the frequency alone keeping voltage constant. In this mode, the air gap flux decreases with increasing speed. The product of speed & torque remains constant in this operation beyond base speed.
The regenerative braking is classified on the basis of control strategies into: -
- Series regenerative braking
The series braking system with optimal feel consists of a braking controller that controls the braking forces on the front and rear wheels. The purpose of this strategy is to minimize the stopping distance and optimize the driver’s feel. The shortest braking distance and good braking feel require the braking forces on the front and rear wheels to follow the ideal braking force distribution, curve I [8]. Figure 1 illustrates the principle of this braking control strategy. When the commanded deceleration is less than a certain value (0.2 g, for example), only the regenerative braking on the rear wheels is applied which emulates the engine retarding function in conventional vehicles. When the commanded deceleration is greater than 0.2 g, the braking forces on the front and rear wheels follow the ideal braking forces distribution curve I, shown by the thick solid line in Figure 1. In our case the braking force on the rear wheels (driven axle) is composed of two parts: regenerative braking force and mechanically frictional braking force. When the braking force demanded for rear axle is less than the maximum braking force that the electric motor can produce, only electrically regenerative braking will apply. But when the commanded baking force is greater than the available regenerative braking force, the electric motor will operate its maximum braking torque, and the remaining braking force is provided by mechanical braking system. The principal of series braking system with optimal energy recovery is to recover the braking energy as much as possible in the condition of meeting the total braking force demanded for given deceleration. This principal is illustrated in Figure 2.
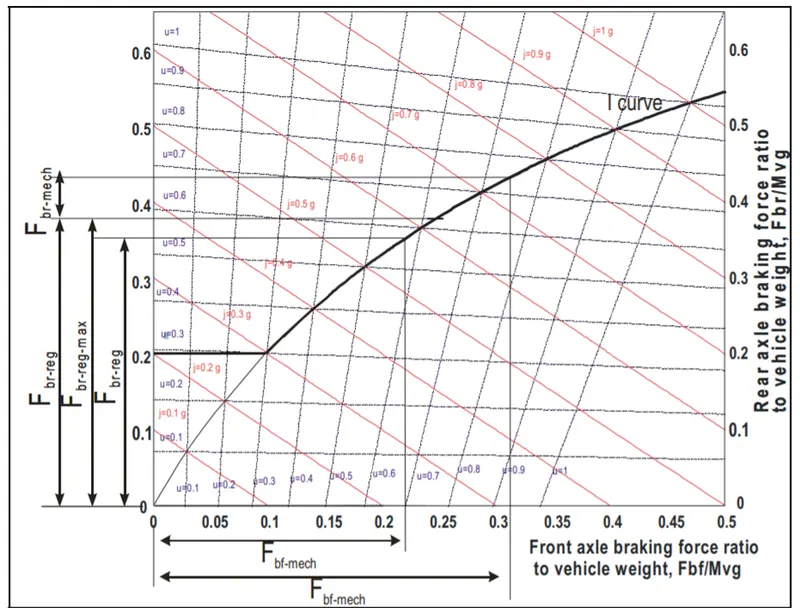
Fig.1: Series brake optimal feel strategy.
Fig.2: Series brake optimal energy recovery strategy.
- Parallel regenerative braking:
The parallel brake system includes both an electrical (regenerative) brake and a mechanical brake, which produce braking forces in parallel and simultaneously. The operating principal is illustrated in Figure 3, in which regenerative braking is applied only to the rear wheels. The parallel brake system has a conventional mechanical braking which has a fixed ratio of braking forces distribution on the front and rear wheels. Regenerative braking adds additional braking force to the rear wheels, resulting in the total braking force distribution curve. The mechanical braking forces on the front and rear axles are proportional to the hydraulic pressure in the master cylinder. Because the regenerative braking force available is a function of motor speed and because almost no kinetic energy can be recovered at low motor speed, the regenerative braking force at high vehicle deceleration (e.g., j/g=0.8) is designed to be zero so as to maintain braking balance. When the demanded deceleration is less than this deceleration, regenerative braking is effective.
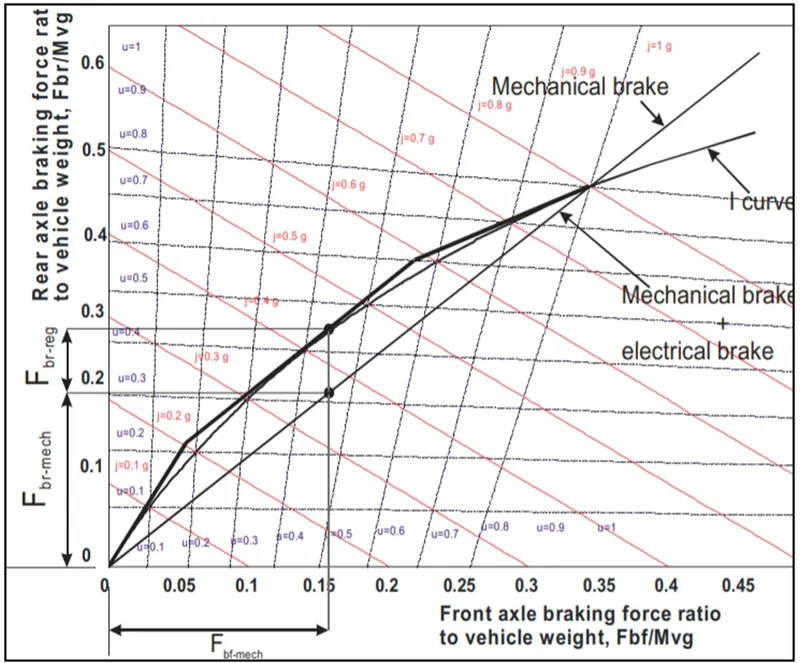
Fig.3: Parallel brake strategy.
3.
MATLAB program to plot contour for given motor speed, torque and efficiency,
clear all
close all
clc

T = linspace(0,200,300); %Torque
S = linspace(0,1000,1000); %Speed

Kc = 0.055; %Copper loss constant
Kf = 0.0085; % Iron loss constant
Kw = 0.0001; % Windage loss constant
C = 30; %Constant loss

[A,B] = meshgrid(S,T);
CuL=(B.^2)*Kc;%copper loss
FeL=A*Kf;%Iron loss
WL=(A.^3)*Kw;%Windage loss


Output = A.*B;
Input = Output+CuL+FeL+WL+C;
Z = Output./Input;%Efficiency
V=[0.4,0.5,0.6,0.7,0.8,0.85,0.9];

%Cotour plot for motor efficiency
contourf(A,B,Z,V);

colorbar
box off
grid off
title('Contour plot for Motor speed, Torque & Efficiency')
xlabel('Speed');
ylabel('Torque');
grid on
Inputs considered,
Motor speed = 1000 rad/s
Torque = 300 m/s
Copper loss constant (Kc) = 0.055
Iron loss constant (Kf) = 0.0085
Windage loss constant (Kw) = 0.0001
Constant loss (C) = 30
Formula used,
Total loss in motor = CuL+FeL+WL+C
Where, CuL = Copper loss
FeL = Iron loss
WL = Windage loss
C = Constant loss of motor
CuL = Kc*(T^2)
FeL = Ki*(W)
WL = Kw*(W^3)
Where, W = speed of the motor in rad/s
T = Torque of the motor in N-m
Output power = W*T
Input power = Output power + Total loss in motor
Efficiency = Output power / Input power.
Output:
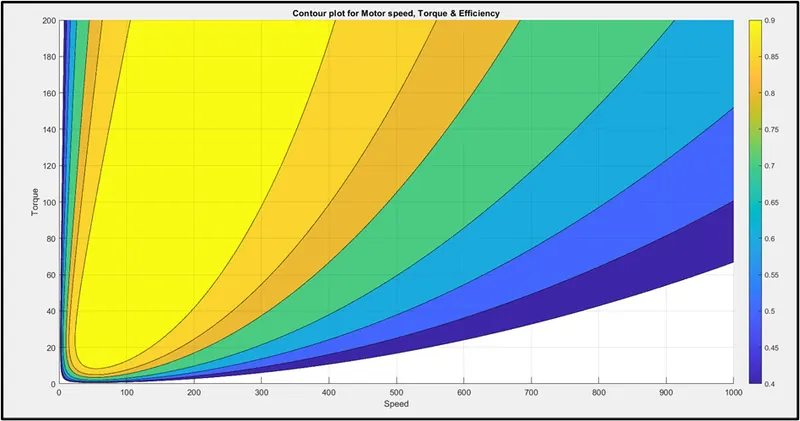
From above graph we can see that the max efficiency is obtained within speed value 50 to 350, torque value within 15 to 200.
Conclusion:
- Braking energy for the user defined drive cycle was calculated.
- Discussion on braking in EV was done.
- MATLAB code was written to execute the Contour plot.