Week-11 Challenge: Braking
Aim1:
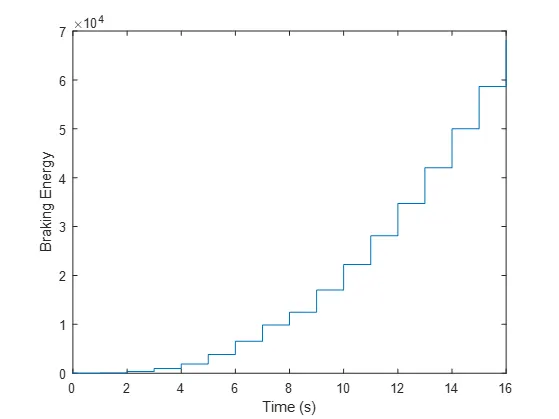
For a defined driving cycle, calculate the energy required for braking.
A driving cycle is a series of data points representing the speed of a vehicle versus time.
Driving cycles are produced by different countries and organizations to assess the performance of vehicles in various ways, as for instance fuel consumption, electric vehicle autonomy and polluting emissions.
Steps for plotting graph:
- First create a excel sheet of any values as per choice for time and speed. For braking energy calculation implement the formula,
Eb = 0.5*m*v2
Where,
m = 1000kg ___Given
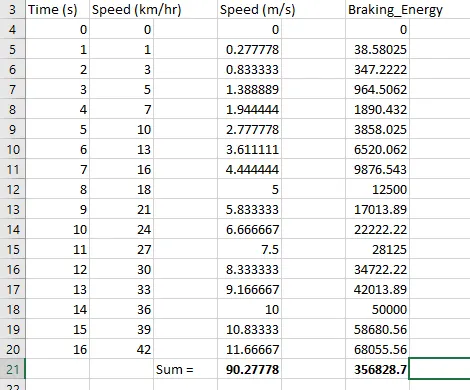
Total braking energy = 356828.7 N-m
Average braking energy = 20989.2 N-m
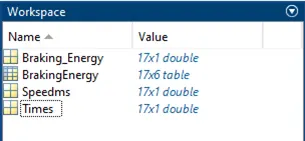
- Now open the MATLAB and import the excel sheet.
- First input the whole table in the MATLAB and then input single columns.
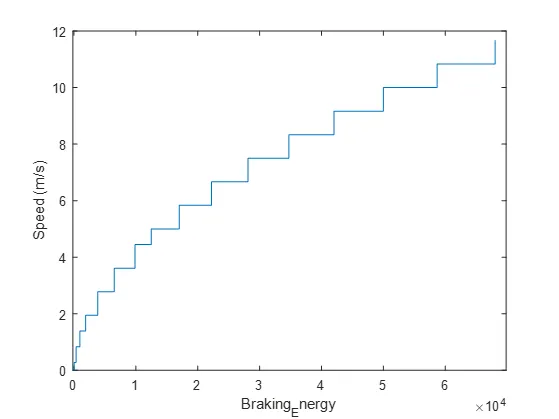
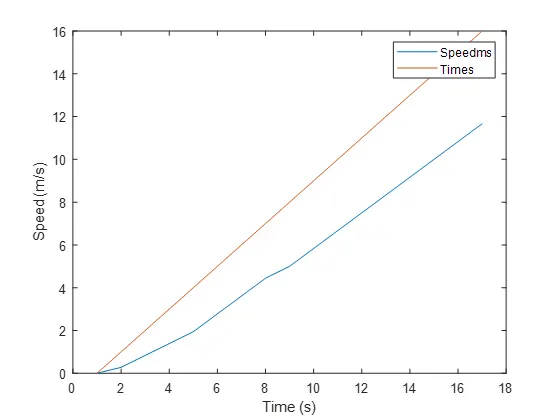
- Now by selecting different two sets of columns we can create an array and can plot graph directly.
Graphs
Aim2:
Why electric motor can’t develop braking torque at high speed similar to starting? How electric and mechanical brakes are coordinated?
Sometimes after accelerating you can't reach the maximum torque. The reason is that no matter how much the current loop wants to increase current (proportional to torque) by increasing the PWM duty cycle of the power stage, the Vmotor is too close to Vbemf and therefore current can't increase more.
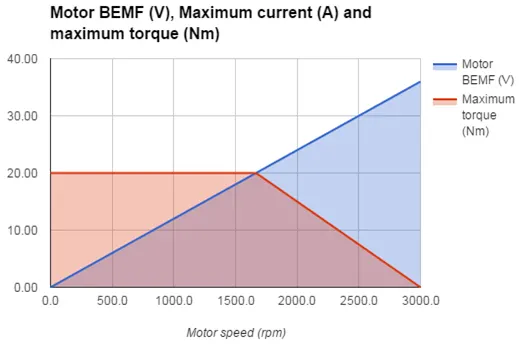
Whenever Friction torque + Additional loads = Motor Torque, the load remains in equilibrium (does not move, or moves under constant speed). Whenever Friction torque + Additional loads < Motor Torque, the load accelerates (Motor torque - Friction torque - Additional loads = Acceleration torque > 0). Al high speeds, the BEMF is so close to Vbus that the applicable Motor torque gets limited. Then, the bigger the Friction torque + Additional load is, the smaller the Acceleration torque becomes.
This can also occur if acceleration or speed is limited by some reason.
This situation does not occur at the beginning of an acceleration because most of the torque is used to increase the kinetical energy of the load (and motor). But when the speed is already high and no extra load is applied it is not possible to increase the torque.
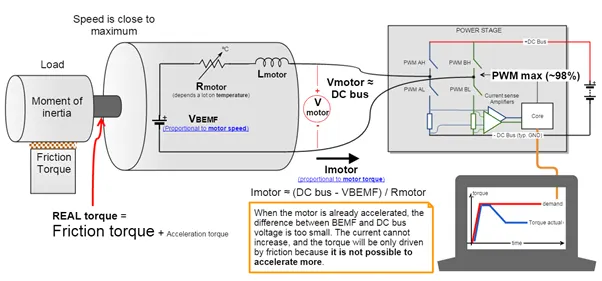
Reasons why the torque actual is NOT the real torque:
- If commutation, phasing, is not correct, an important part of the current is not useful torque, it just creates electrical and magnetic loses.
- If current loop is not well configured or unstable, the current will be higher and with ripple, the real "useful mechanical torque" will be indeed lower.
- Torque constant can vary due to several factors, like motor construction, temperature of the magnets (that affects its magnetic properties).
Maximum Achievable Torque depending on Motor Sped:
To prevent this
- Increase DC bus voltage.
- Unlimit system acceleration.
- Use a motor with less resistance and lower back EMF proportion.
How electric and mechanical brakes are coordinated?
In an electric motor the total brake distribution is in two aspects which are electrical brake called as Regenerative Braking system and Mechanical brake or classical brake with hydraulic cylindrical system. Brake force distribution must be uniform. If the regenerative braking power requirement is more than the charging limit of the battery or more than regenerative capacity of the machine, we must apply mechanical brakes as well. In practical case the combination of these two is applied. So usually it is combined response of Mechanical brake and Regenerative brake. The reason for how this brake force are combined, that particular phenomenon is called Brake control strategies. There are two brake control strategies,
- Series – In case of series we apply Mechanical Brake and Regenerative Brake one after another. We can apply only one brake strategy at a time either apply regenerative or apply mechanical brake. The series brake control strategy has further classification that is based on whether we want comfort of driver or brake behaviour compared to energy efficiency.
- Parallel – In case of parallel we can apply both the brakes simultaneously.
Aim3:
Make a MATLAB program which plots contour of given motor speed, torque and efficiency values. Attach the code as a .m file attach a screenshot of all the plots.
MATLAB Code:
clear all
close all
clc

W = linspace (0,400);
T = linspace (0,400);

%Motor constant
Kc = 0.3; %for copper loss
Ki = 0.009; %for iron loss
Kw = 0.00001; %for windage loss
cont = 25; %for constant motor loss

%making mesh
[X,Y] = meshgrid(W,T);
outputpower = (X.*Y); %Torque*Speed = Power
B = (Y.^2)*Kc; %copper loss
C = (X.^3)*Kw; %windage loss
D = X*Ki; %Iron loss
Inputpower = outputpower + B + C + D + cont;
Z = outputpower./Inputpower;

%set efficiencies for which the control will be plotted
V = [0.72, 0.74, 0.75, 0.80, 0.82, 0.87, 0.89, 0.90, 0.92];
box off
grid off
contour(X, Y , Z, V)
xlabel('Speed(rad/sec)')
ylabel('Torque(N-m)')
hold on
V = [8000, 10000];
contour(X, Y, outputpower, V)
Output:
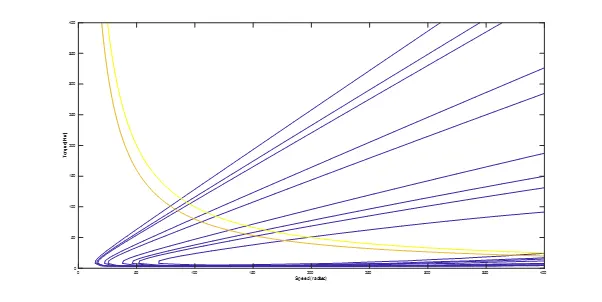
From this contour plot, we can see that the highest level of efficiency arises in the innermost contour contour plot and this efficiency decreases as the contours increase in size from the innermost contour