Week 10 - Simulating Combustion of Natural Gas.
The following objectives were undertaken during this project:-
Part I
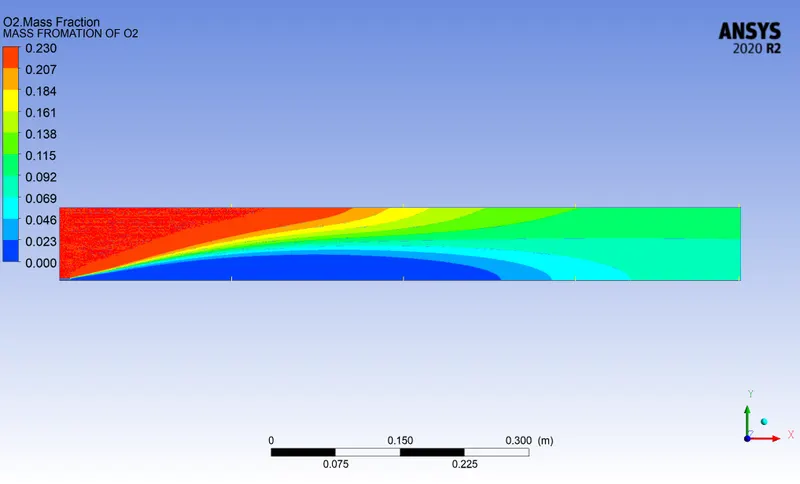
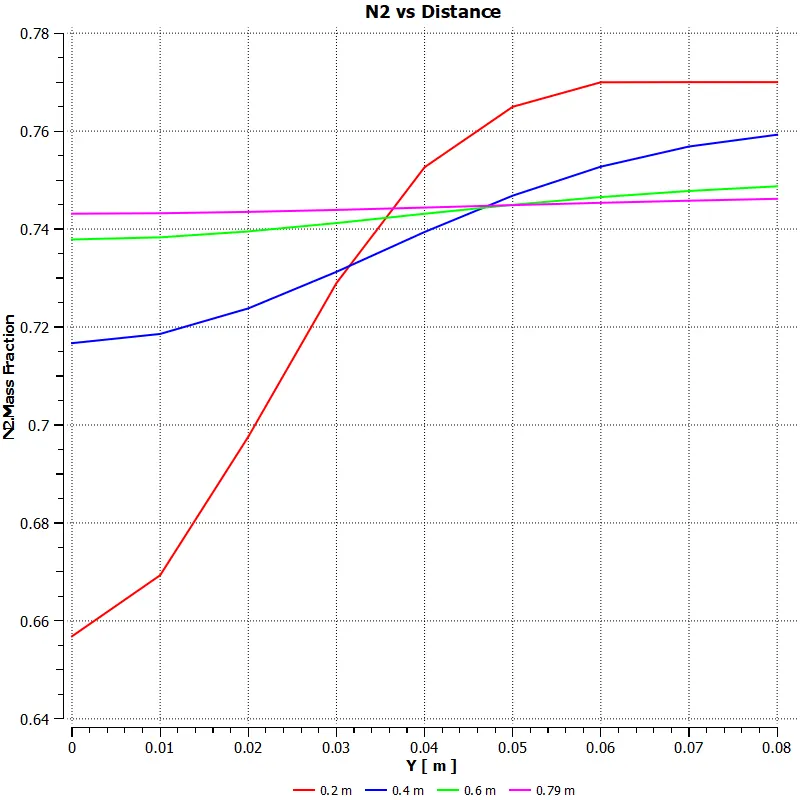
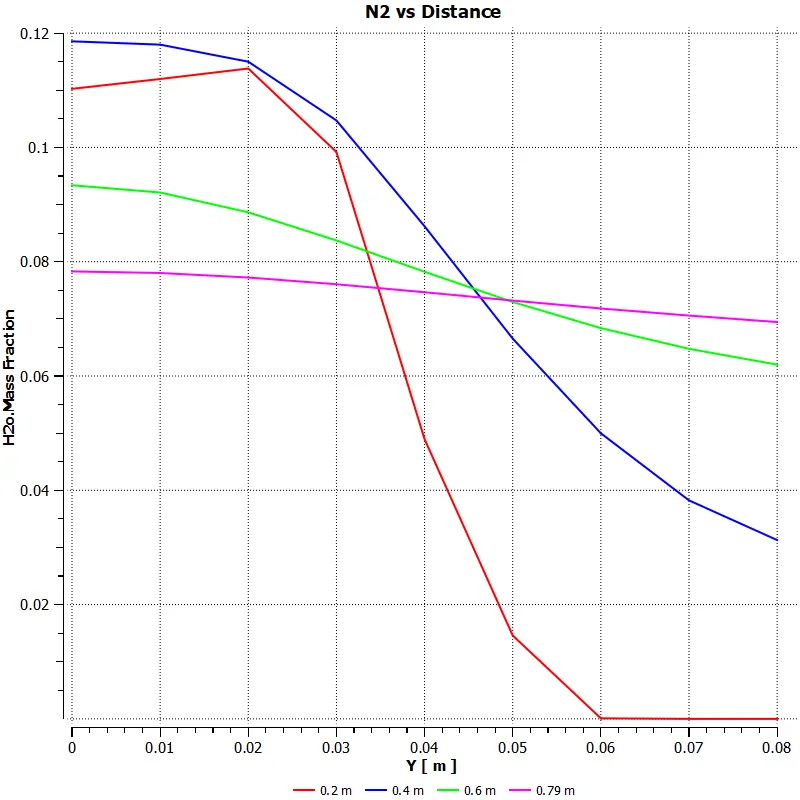
Perform a combustion simulation on the combustor model and plot the variation of the mass fraction of the different species in the simulation using line probes at different locations of the combustor as shown in Fig. You need to plot for CO2, H2O, CH4, N2, O2, NOx emissions & Soot formation.
Part II
As you must have observed from the above simulation, the Nox and soot is getting formed at the outlet of the combustor. Such formation has harmful effects on the environment and humans. The stringent government norms also demand the least formation of Nox and soot and to satisfy those requirements, you need to check the effect of adding the water in the fuel.
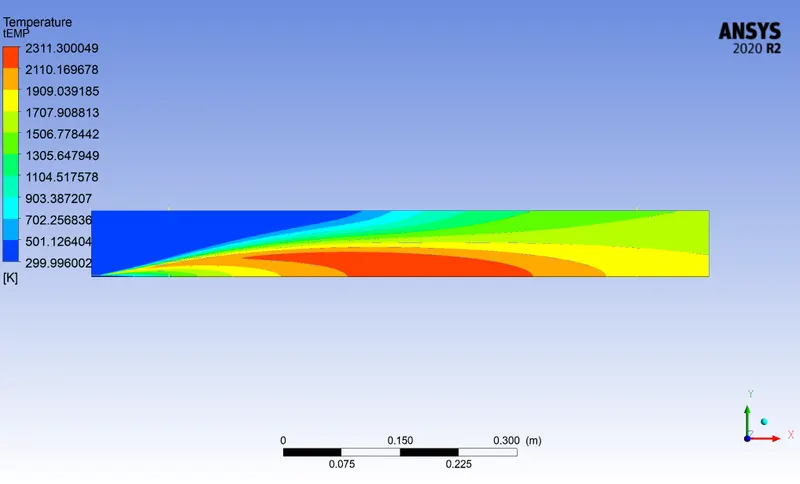
In this part, you need to add the water content in the fuel from 5% to 30% by mole and observe the effect of it on the results. It is necessary to provide line plots and contours to prove your claim
Theory:-
Combustion is a fundamental process that is required to move any mechanical system. It can be defined as the process in which chemical energy is converted into heat energy. It contains a fuel and an oxidizer ( solid, liquid or gas but usually gas). For example an IC engine is a machine that converts the stoichometric mixture of fuel ( gasoline ) and Air to heat energy which can generate the required motion. In layman's term burning fuel is combustion. During the process of combustion some by products are obtained due to the chemical reaction between fuel and oxidizer. This can generate certain flue gases that can have ramifications on nature and hence it is necessary to select the proper stoichiometric ratio of fuel and oxidizer so that minimal fuel gases can be released. Pollutants such as NOx, SOx, Co2, Co are some major green house gases that can deplet the ozone layer and are harmful to the nature.
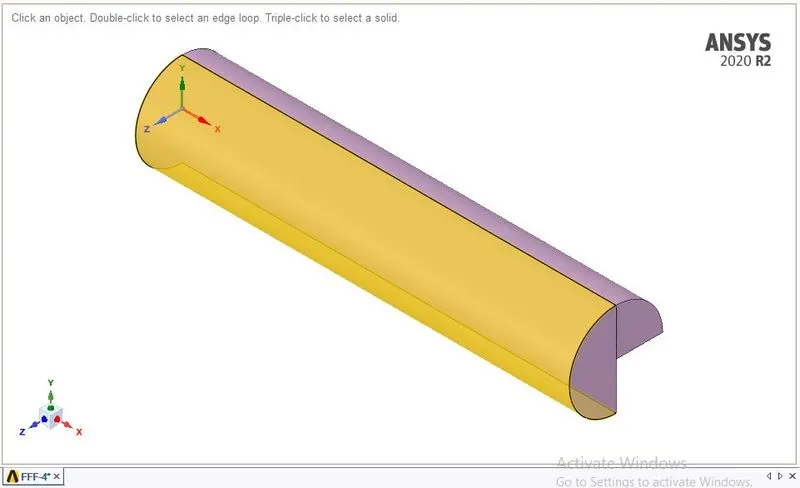
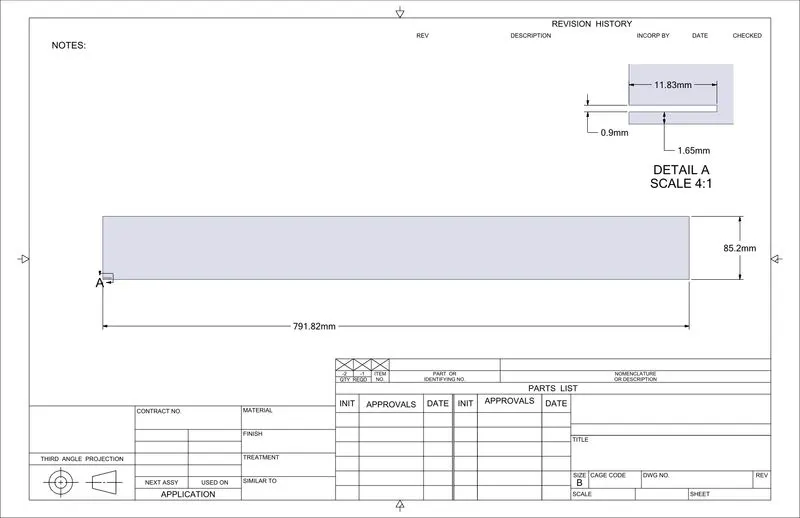
Introduction and pre processing :- The CAD model was provided in which the simulation for the aforementioned tasks were accomplished. In order to make the simulation easier the 2-d model was made and simulation was performed. The image is mentioned below.
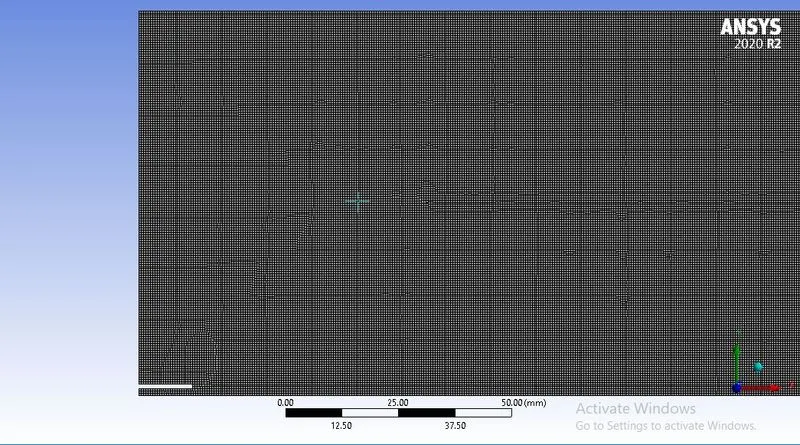
After the successful completion of model the model was meshed in ansys 2020 r2. The min. mesh size was 0.5 mm that concluded approx 2.7 lakh nodes. Further details are mentioned below.
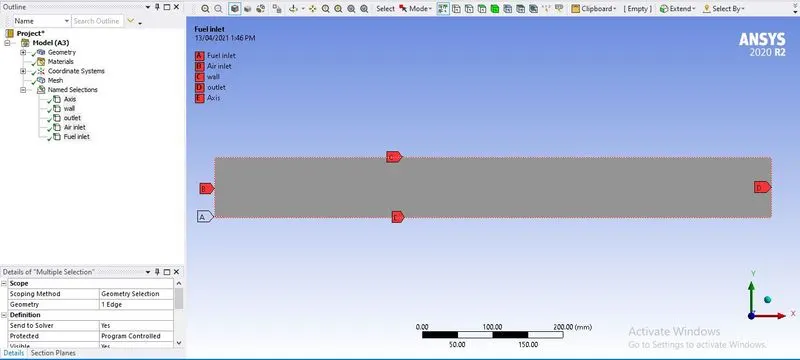
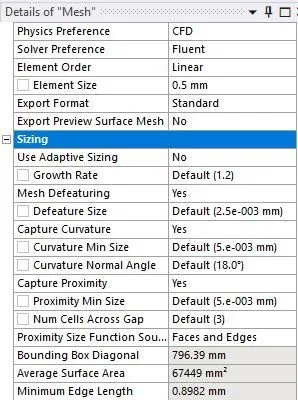
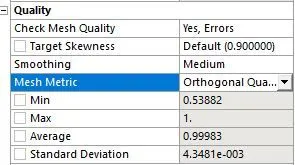
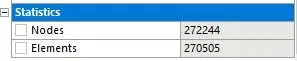
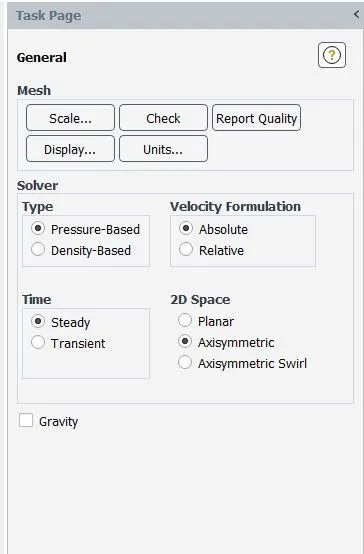
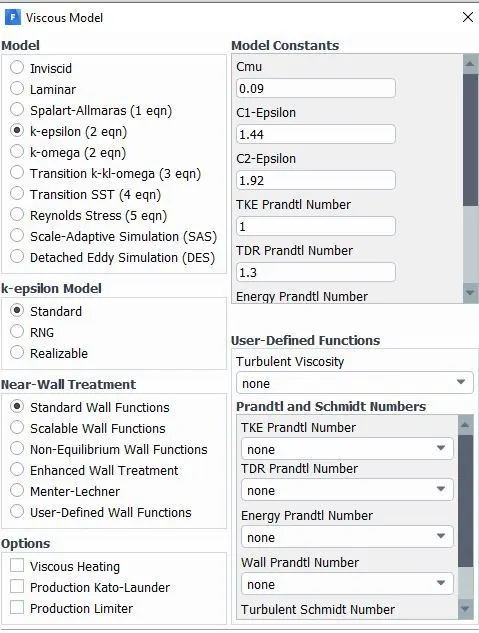
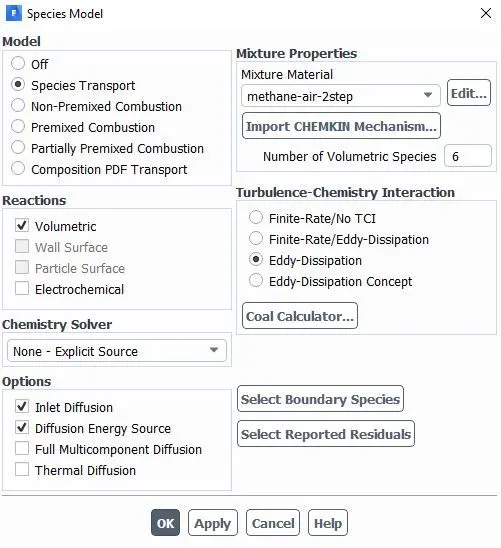
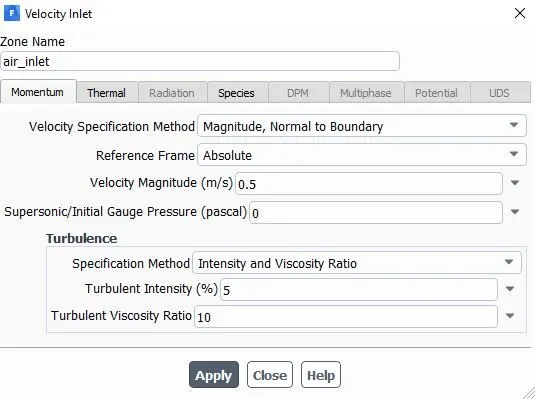
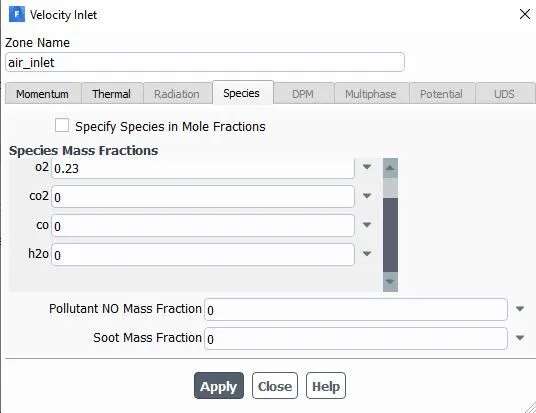
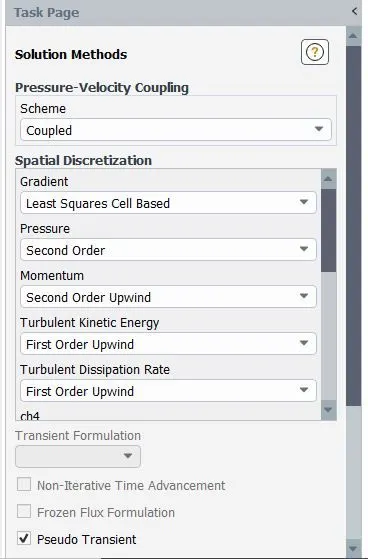
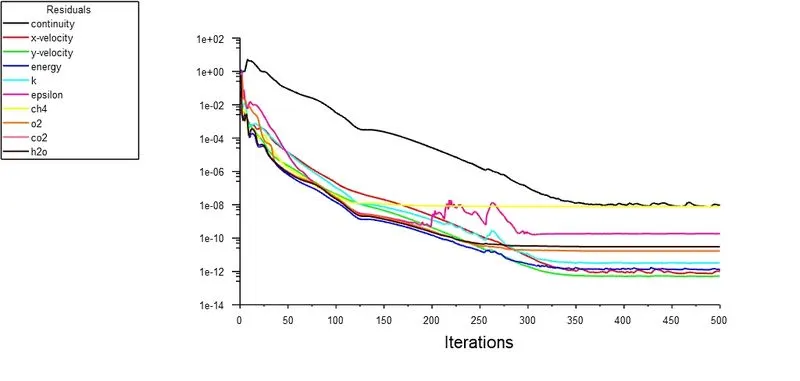
Solving:-Steady-state k epsilon model with Pressure-based solver and coupled scheme was used with axisymmetric model and gravity disabled to solve the simulation. The images are further attached for reference. The species model was enabled and the content of water was varied from 5 % to 30 % (task 2) of the simulation. In order to accomplish it a parametric study was done.
In the task one all the parameters were same as mentioned above and the only change was the material was methane (without water content). The meshing was same in the following task.
Post Processing:-
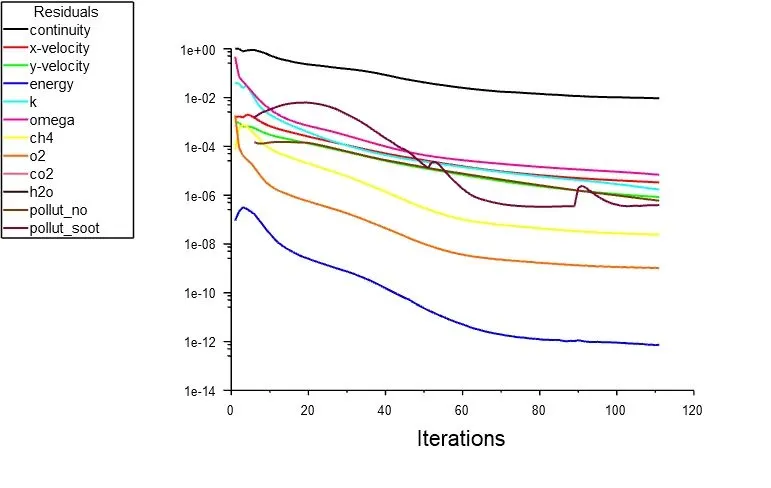
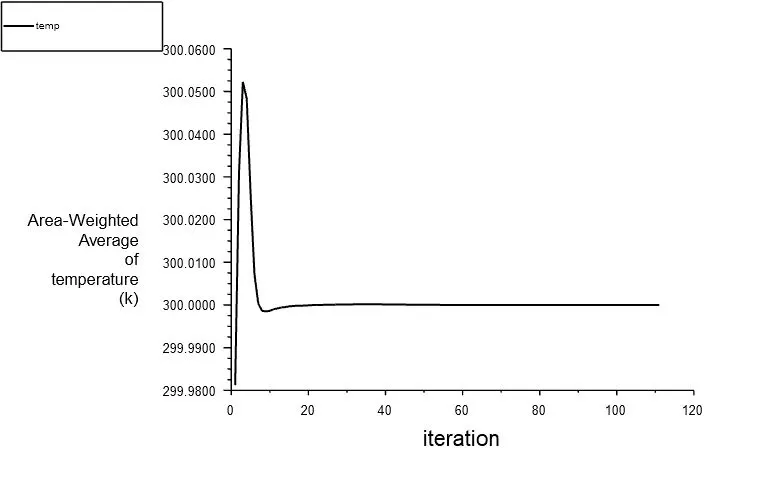
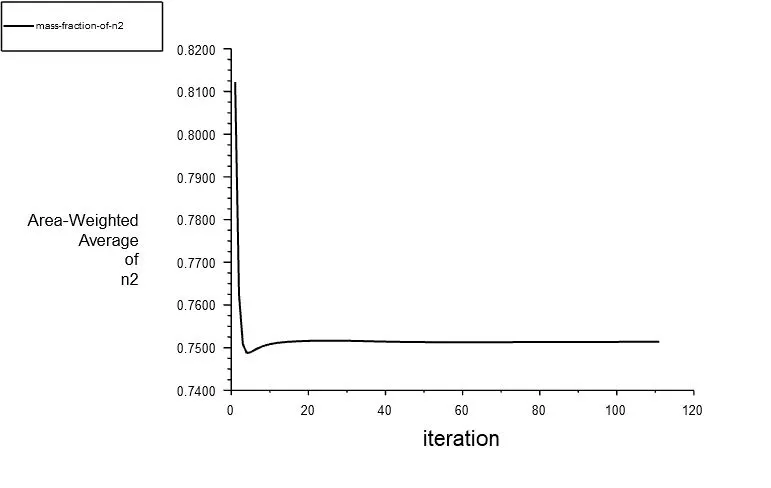
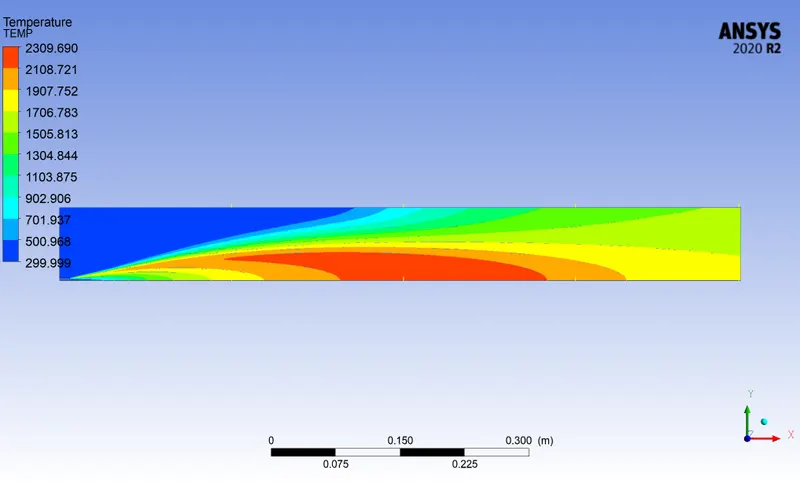
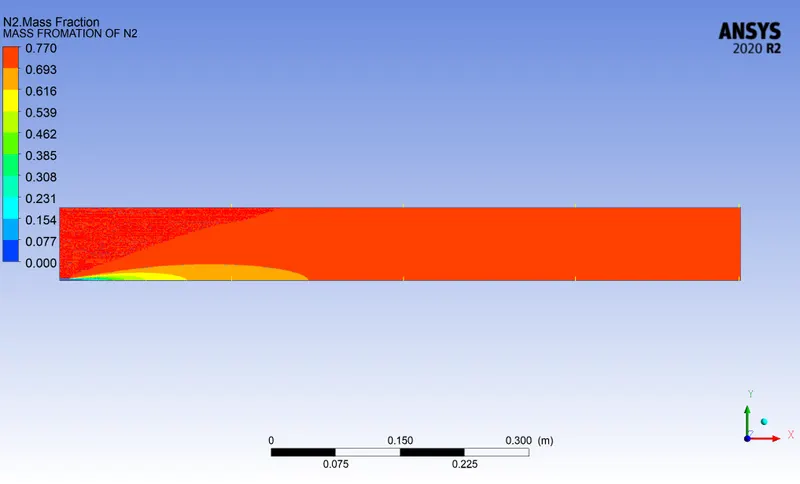
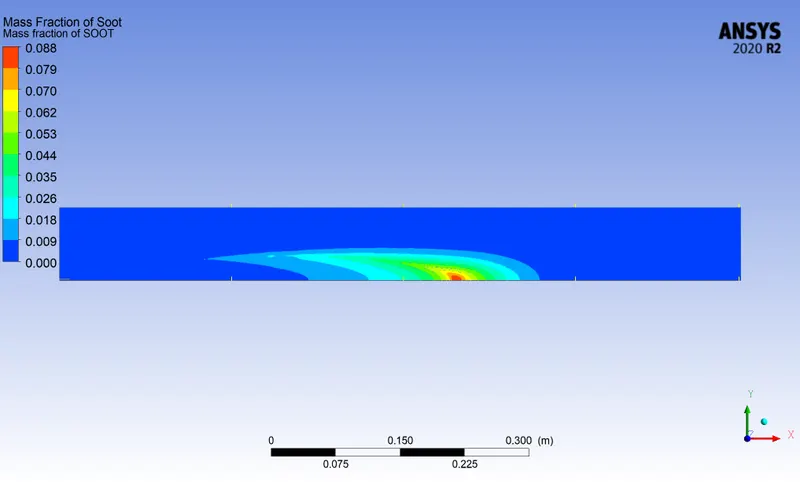
The following results were found
Task 1:- Air + methane (without water).
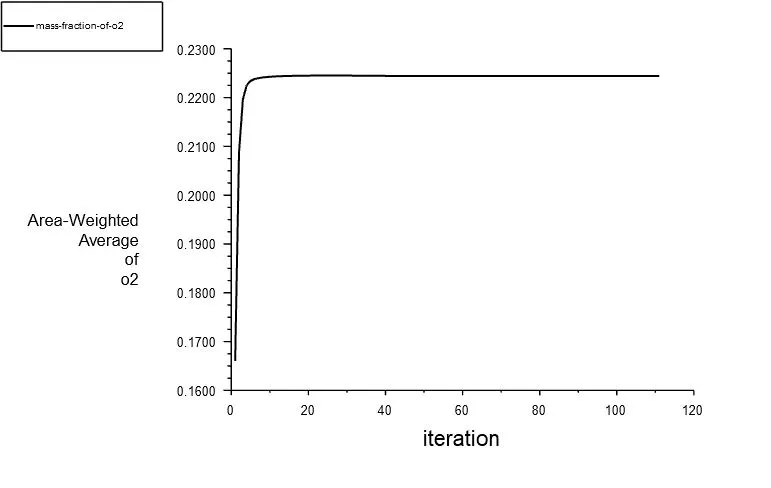
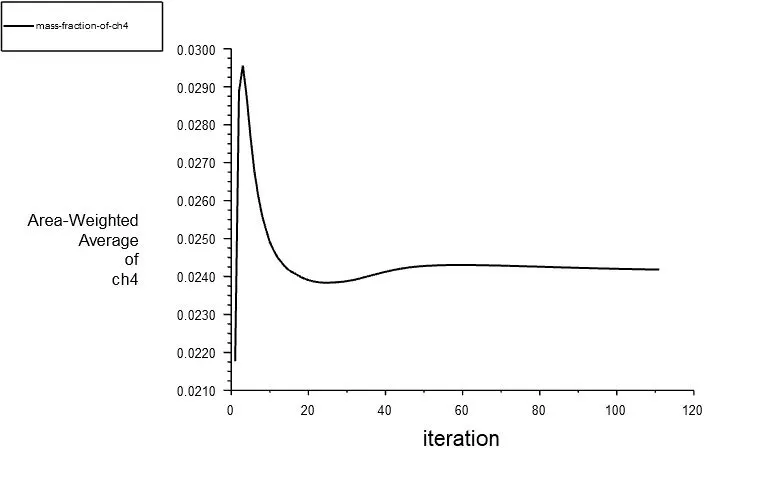
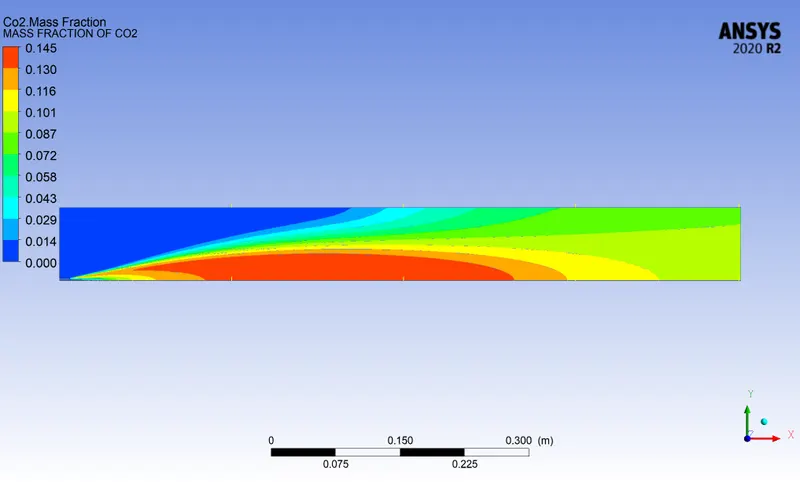
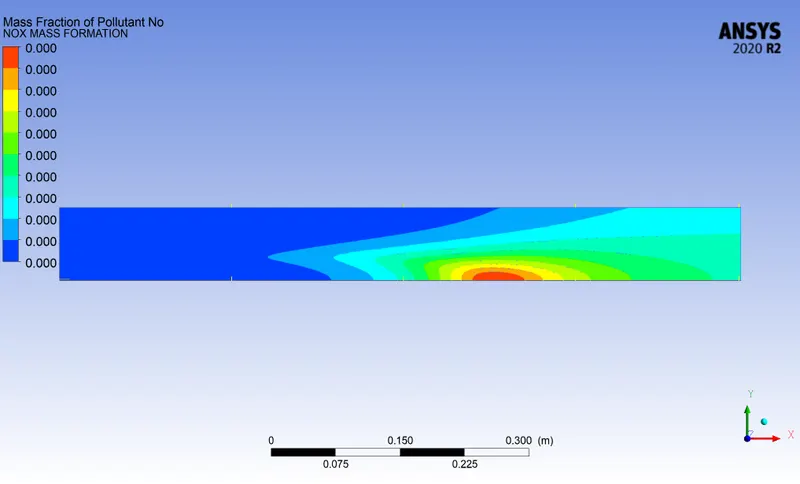
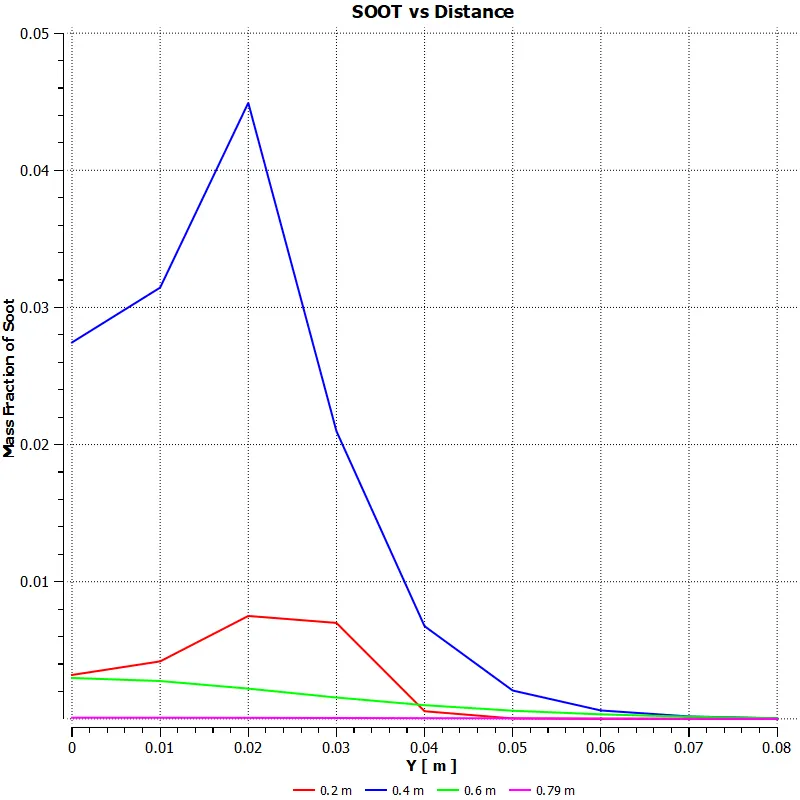
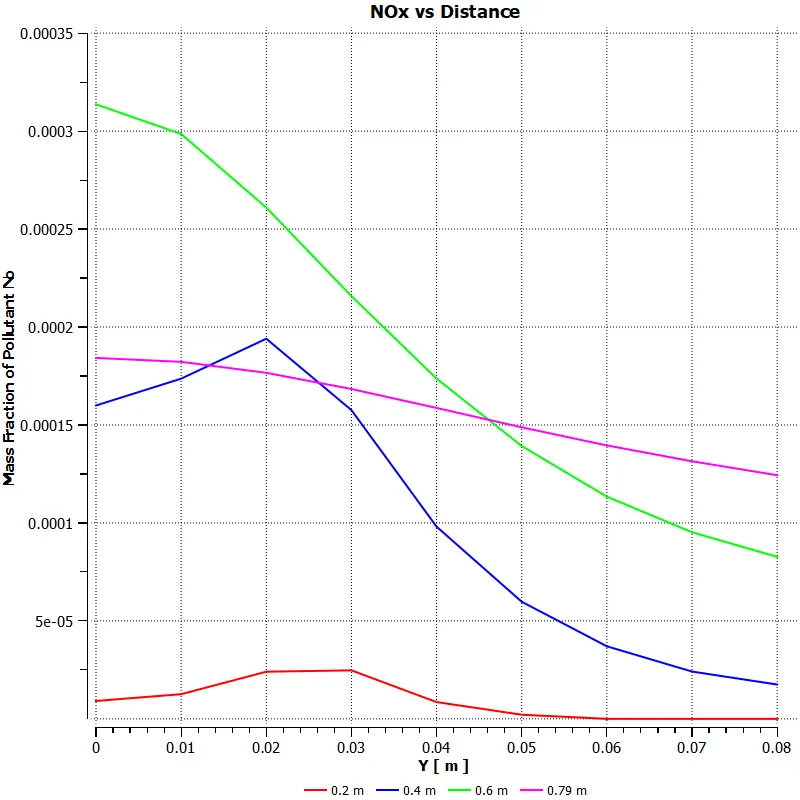
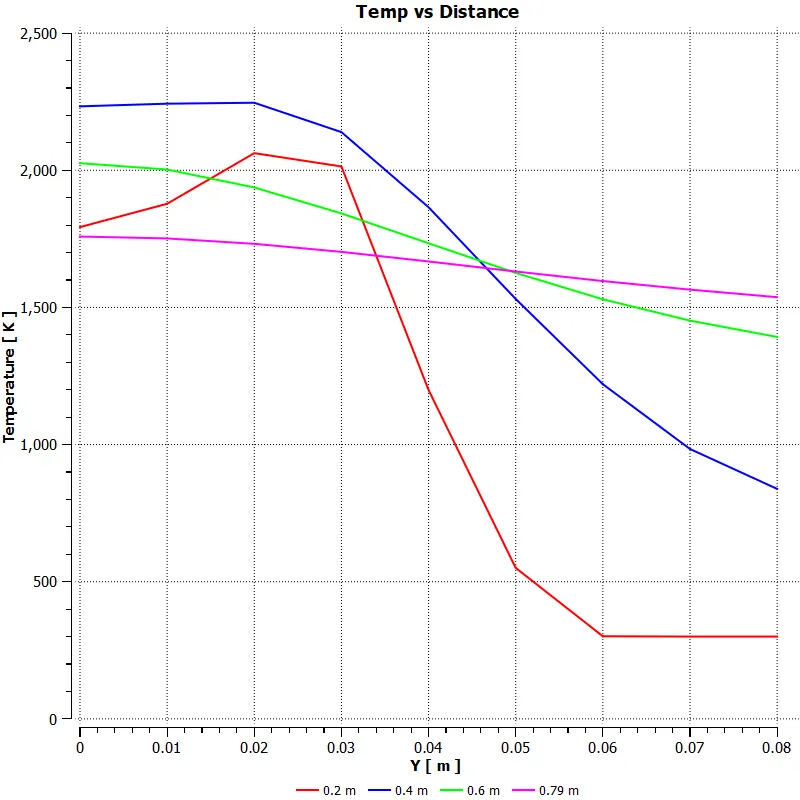
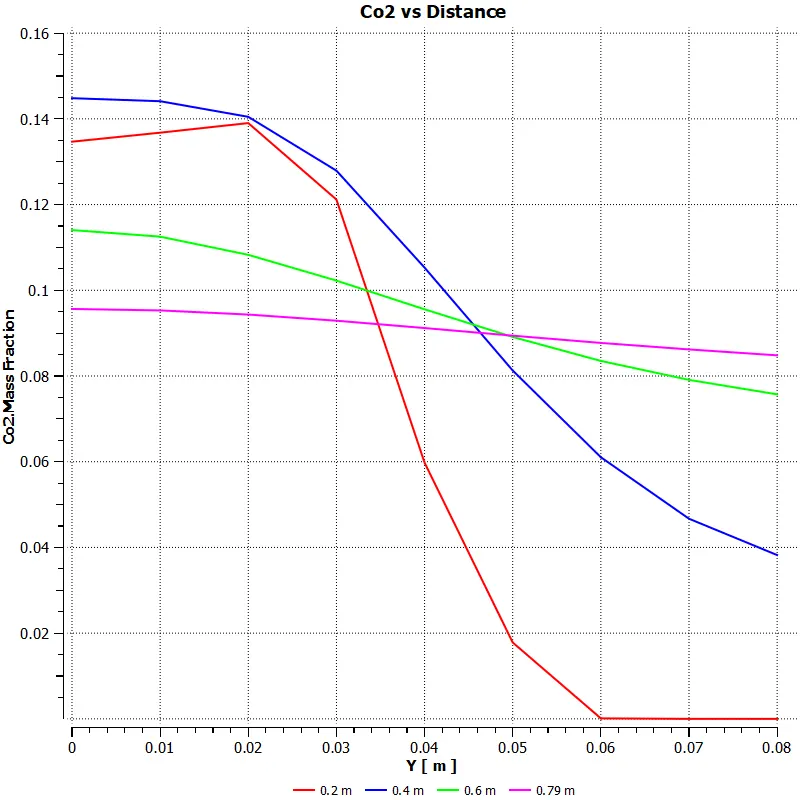
Task 2:- Methane + water
| Name | P7 - ch4 | P8 - h20 | P10 - mass-fraction-o2-op | P11 - mass-fraction-co2-op | P12 - mass-fraction-co-op | P13 - mass-fraction-n2-op | P14 - mass-fraction-water-op | P15 - mass-fraction-methane-op | P16 - temperature-op | Mass fraction of NOX | Mass fraction of SOOT |
| Units | C | ||||||||||
| Task 1 | 1 | 0 | 0.14053795 | 0.057012289 | 0.000714797 | 0.75214867 | 0.000714797 | 0.001991191 | 867.319 | 7.98635e-05 | 0.00357849 |
| Task 2 | 0.95 | 0.05 | 0.14365145 | 0.054963075 | 0.000622131 | 0.75207339 | 0.000622131 | 0.001727634 | 840.1512 | 6.41157e-05 | 0.00264061 |
| Task 2 | 0.9 | 0.1 | 0.14690415 | 0.052805178 | 0.00054113 | 0.75198399 | 0.00054113 | 0.00149848 | 811.3967 | 5.04044e-05 | 0.00204627 |
| Task 2 | 0.85 | 0.15 | 0.15030159 | 0.05054006 | 0.00046629 | 0.75190156 | 0.00046629 | 0.001288252 | 781.0435 | 3.8545e-05 | 0.00152345 |
| Task 2 | 0.8 | 0.2 | 0.1538353 | 0.048174533 | 0.000397752 | 0.75182264 | 0.000397752 | 0.001096619 | 749.1525 | 2.85664e-05 | 0.00111615 |
| Task 2 | 0.75 | 0.25 | 0.15750297 | 0.0457103 | 0.000335498 | 0.75174765 | 0.000335498 | 0.000923272 | 715.70898 | 2.0418e-05 | 0.000807817 |
| Task 2 | 0.7 | 0.3 | 0.16130101 | 0.043149924 | 0.000279487 | 0.75167688 | 0.000279487 | 0.000767809 | 680.70646 | 1.39983e-05 | 0.000591145 |
With addition of water there was dramatic reduction in the SOOT and NOx formation. This also led to reduction in temperature generation which is a critical parameter in combustion.
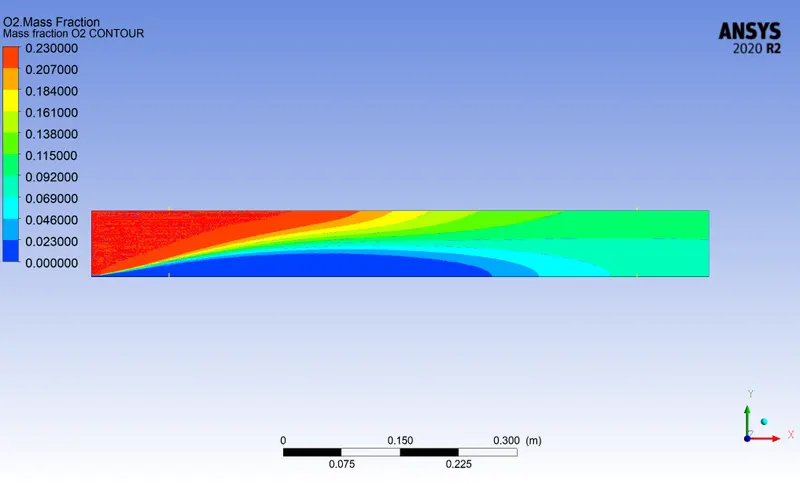
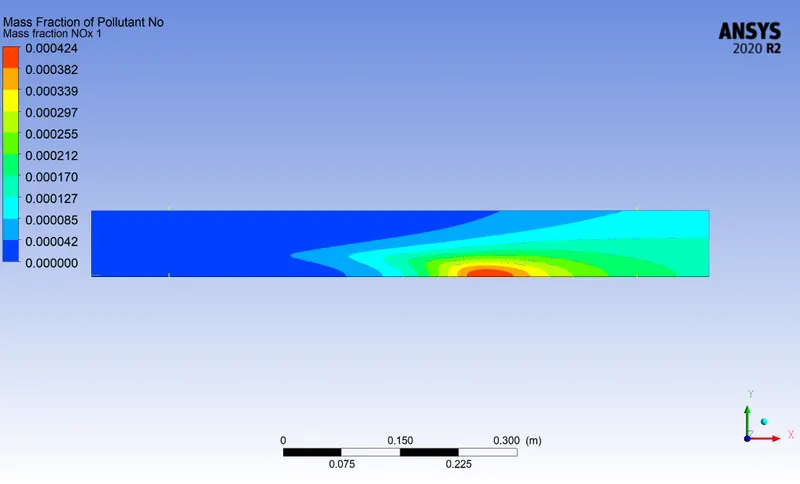
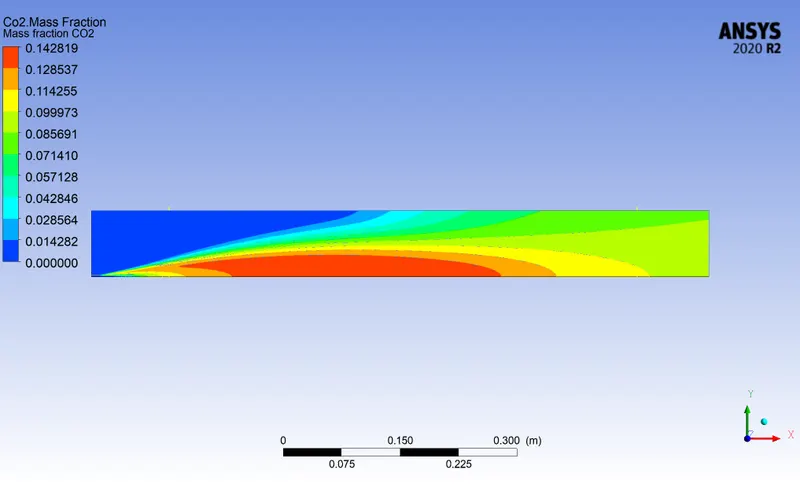
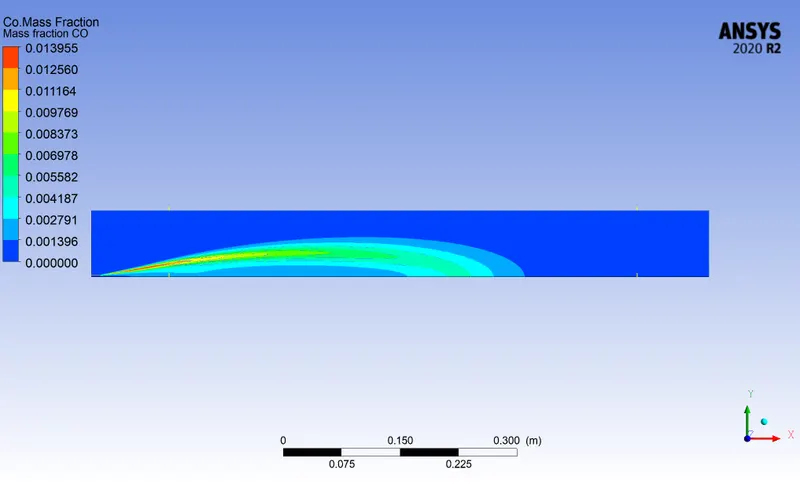
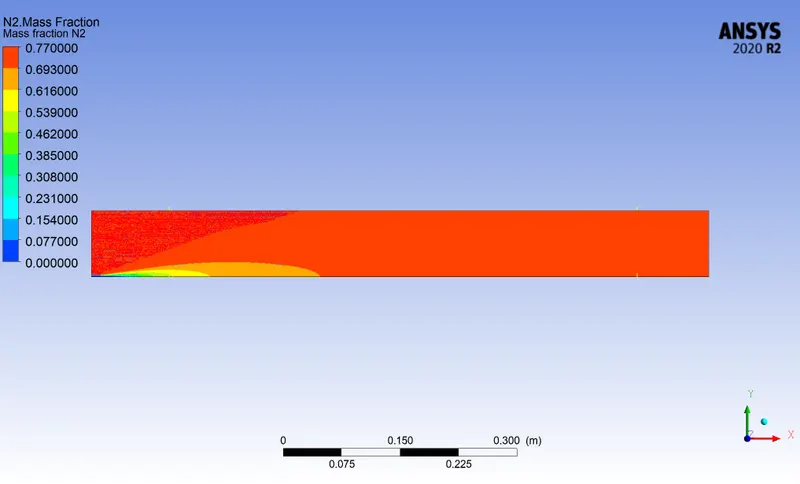
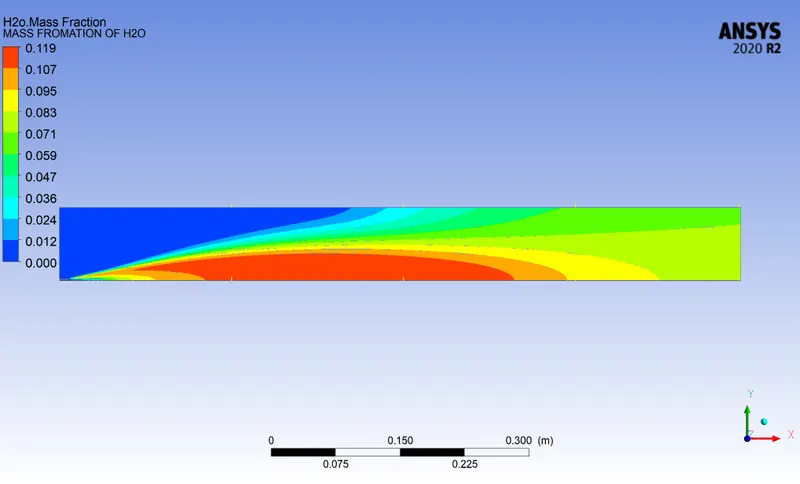
Results and Discussion: It is obvious that with increase in water content there was reduction in the formation of NOx and SOOT but at the same time there was significant drop in the temperature, which can be called as one of the disadvantages.
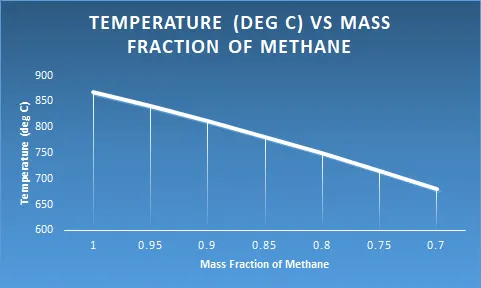
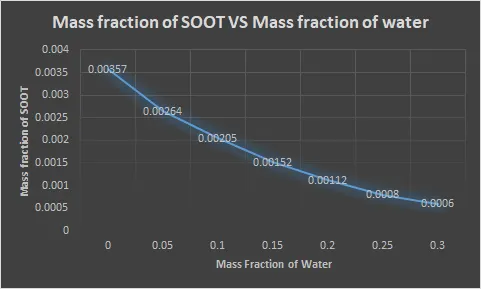
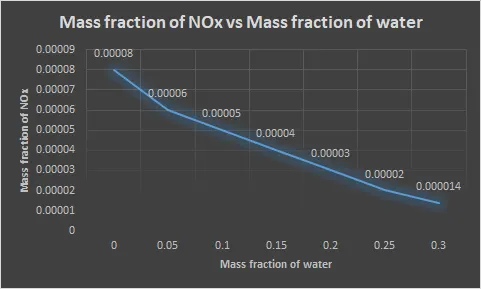
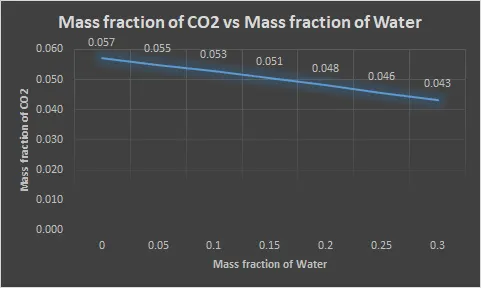
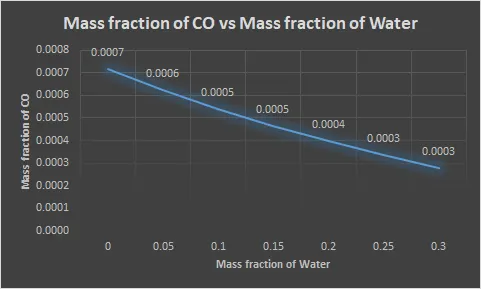
The decreasing trend indicates the reduction in SOOT and NOX formation with increase in mass fraction of water. However the rate at which the reduction takes place for each gas is different, it is least for CO2 whereas for other gases it is almost the same. Alternatively with increase in water content all the flue gases (Co2, Co etc) were reducing. However the effect of increase in water content on the quality of energy being released needs to be seen which is not covered in this task.