Week 1- Mixing Tee
AIM:
- To set up steady-state simulations to compare the mixing effectiveness when hot inlet temperature is 360C & the Cold inlet is at 190C using k-epsilon and k-omega SST model for the following model.
- Case 1
- Short mixing tee with a hot inlet velocity of 3m/s.
- Momentum ratio of 2, 4.
- Case 2
- Long mixing tee with a hot inlet velocity of 3m/s.
- Momentum ratio of 2, 4.
Momentum ratio = velocity at cold inlet / velocity at hot inlet
Given Inputs:-
Hot inlet temperature = 36 oC
Cold inlet temperature = 19 oC
Hot inlet velocity for both long and short mixing tee = 3 m/sec
Procedure :-
case 1 short mixing tee with Momentum Ratio 2
Generally, we have traditional procedure which I mentioned below for CFD analysis.
- Step1: Pre-processing
- Step2: Soultion
- Step3: Post-proessing
Initailly
- First we took the geometry and we have to clean the body that means we need to convert mechanical body to desirable cad model.
- For this we use spacecliam to make cad model.
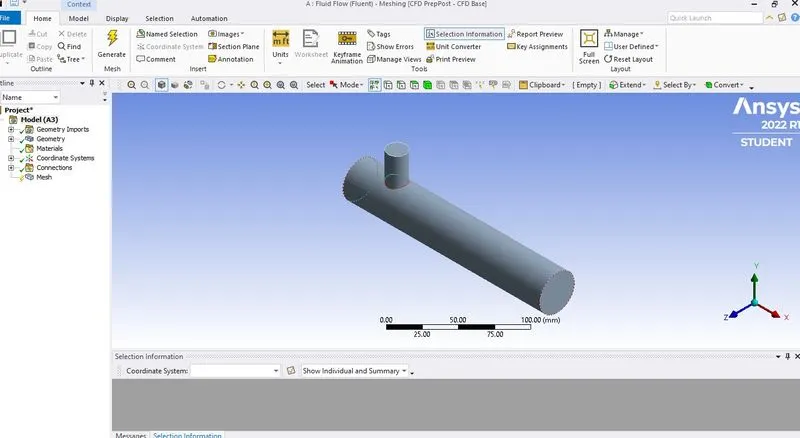
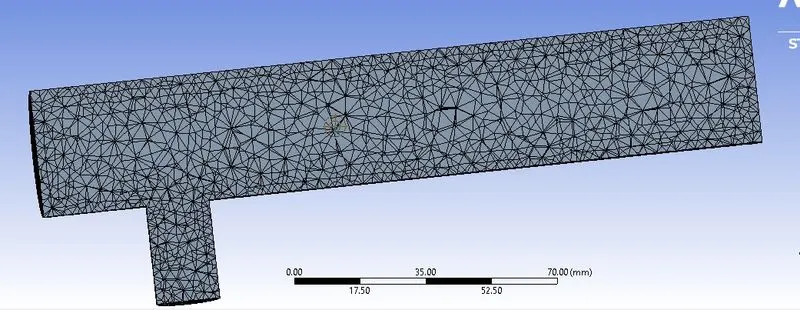
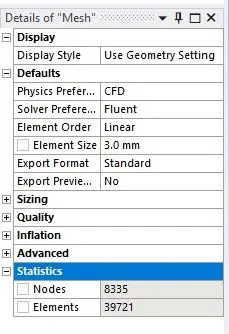
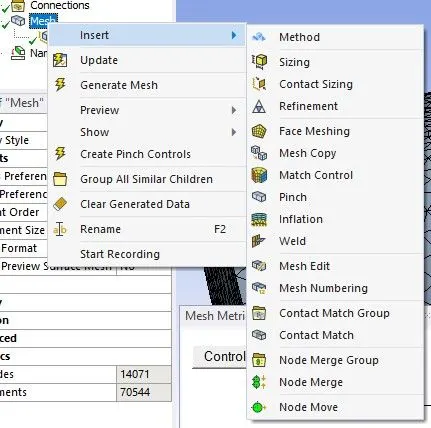
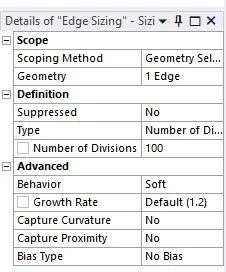
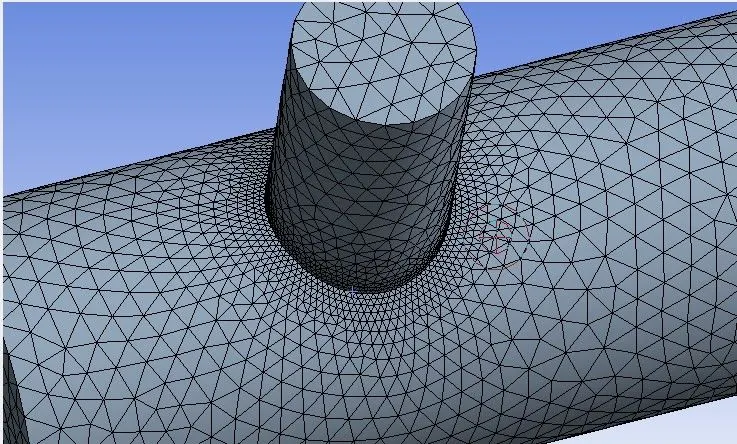
- Then next step is to create mathematical model for cad model that means meshing.
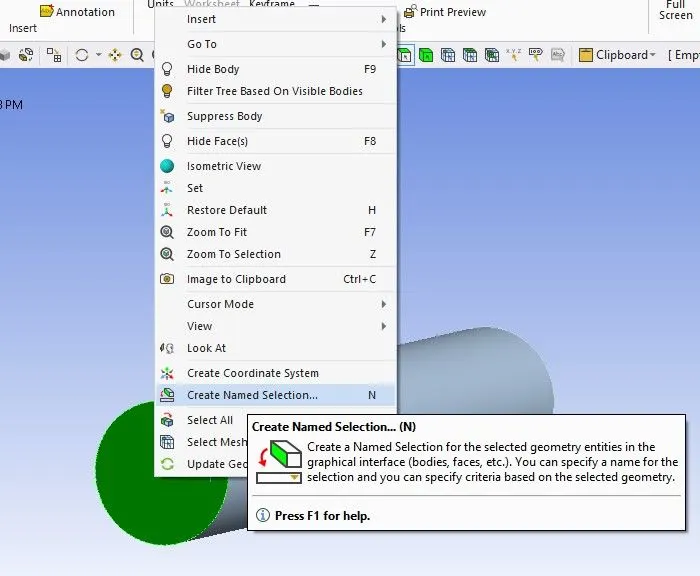
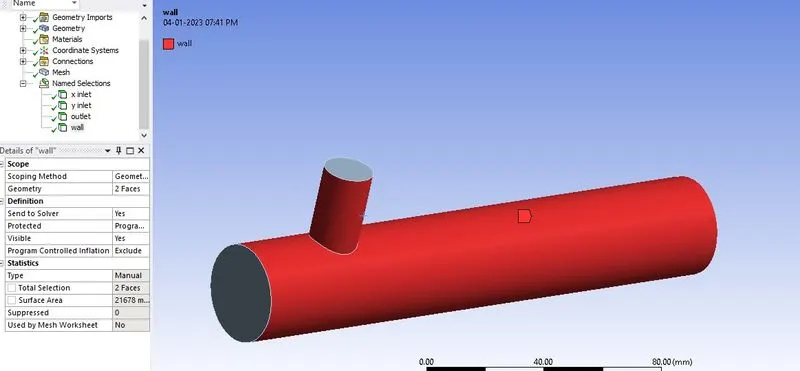
- Before mesh we give boundary conditions to body and we create mesh
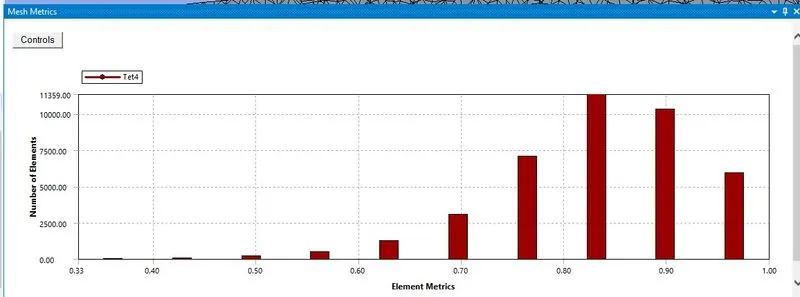
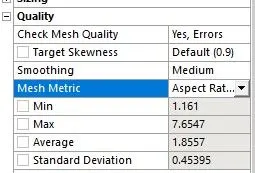
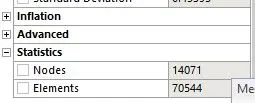
- To get the converged results we need good quality of mesh with good quality of mesh elements.
- Here in below we can see the quality of mesh elements in mesh matric.
- Here more number of elements quality is good and all elements quality is above 30%. So we can use this mesh for further study.
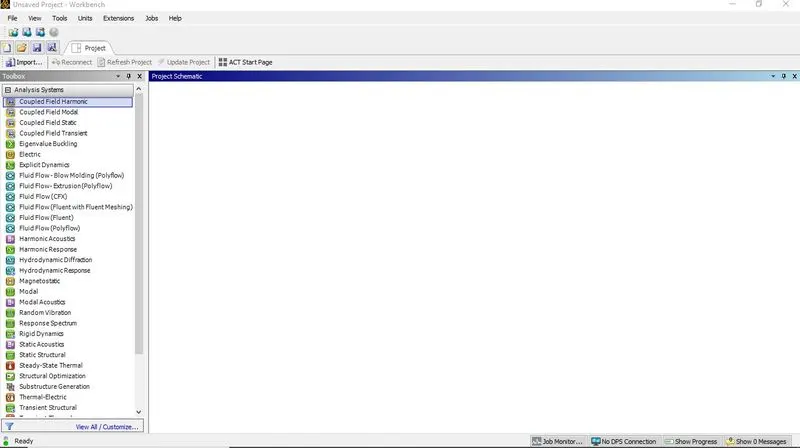
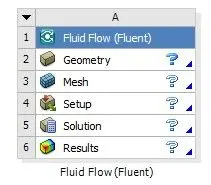
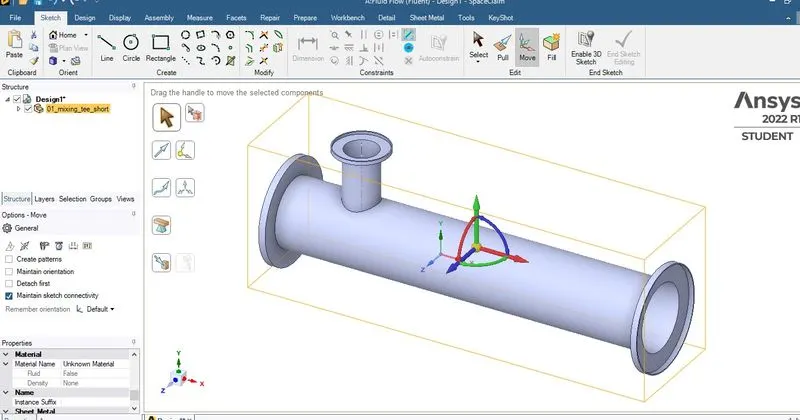
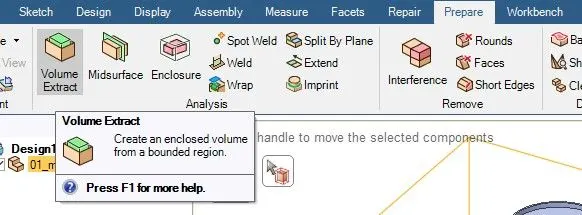
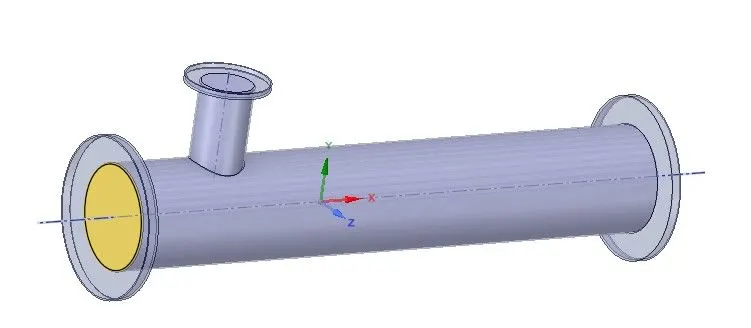
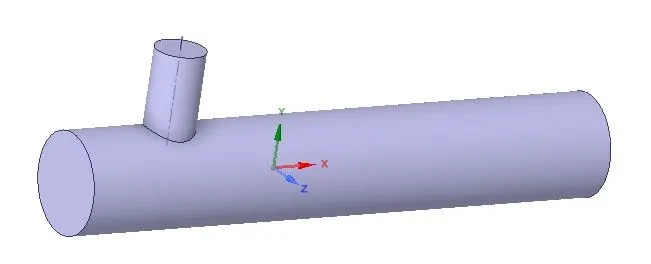
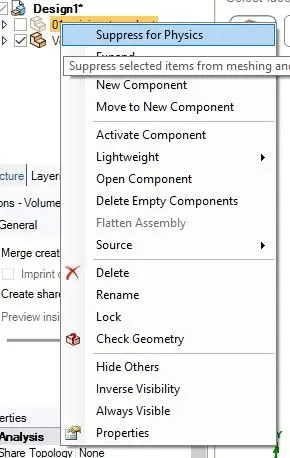
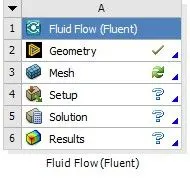
now meshing part
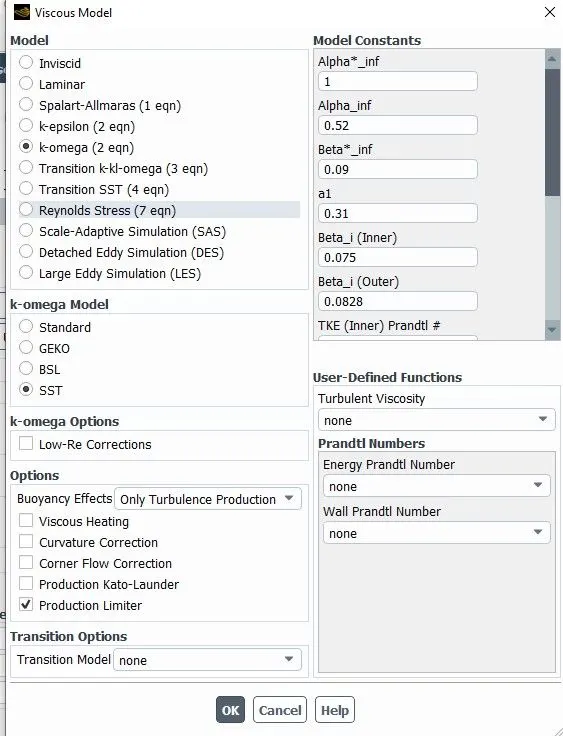
Then next step is setup part but in this we select the rans model k-episillon or k-omega model
- For knowing the suitable turbulence model I took first case means short mixing tee with momentum ratio 2 .
- So, hot inlet temperature is 3 m/sec and cold inlet temperature is 6 m/sec.
- Here we examine in-between k-epsilon and k-w SST turbulence models which model is best for this problem.
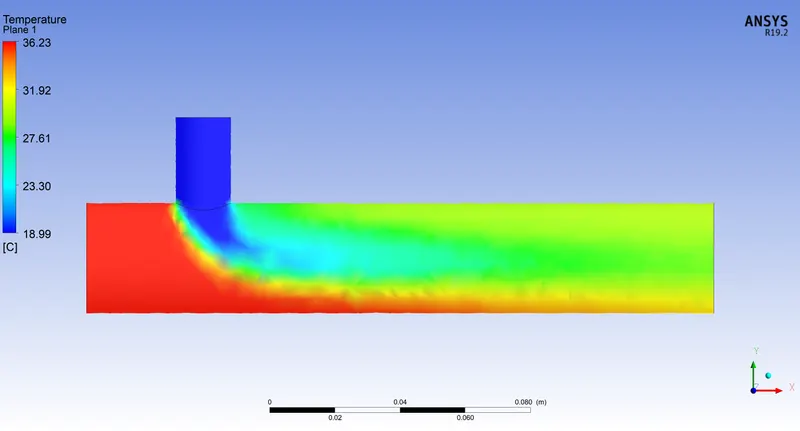
Temperature couture by using K-epsilon model
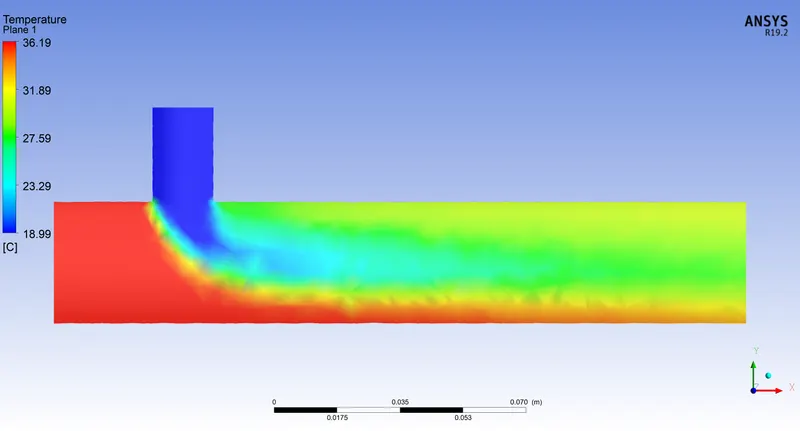
Temperature couture by using K-w SST model
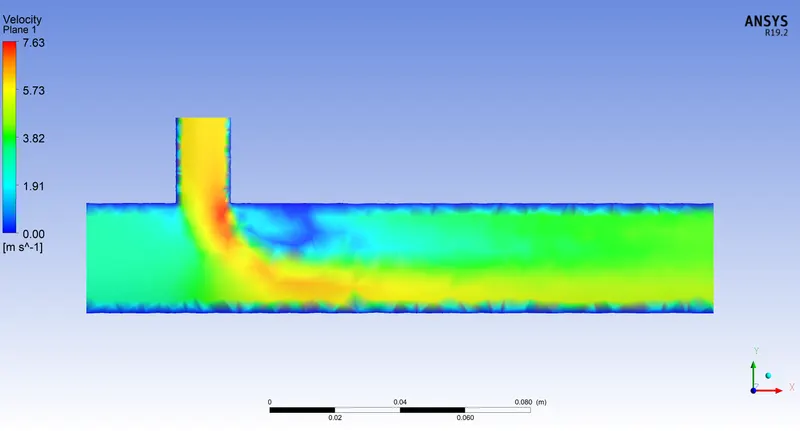
Velocity couture by using K-epsilon model
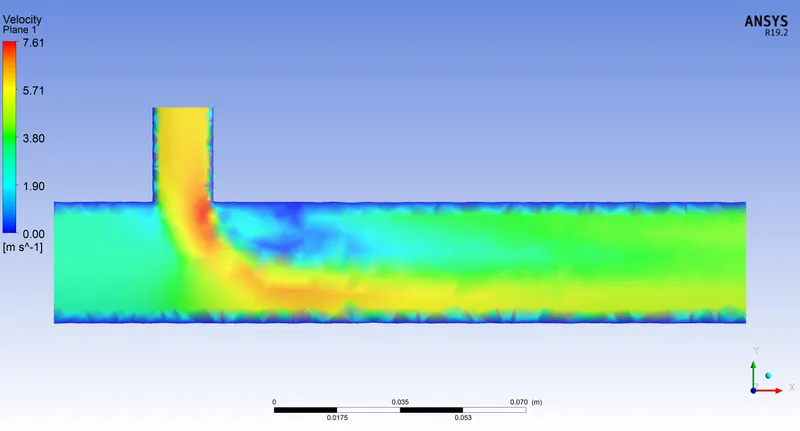
Velocity couture by using K-w SST model
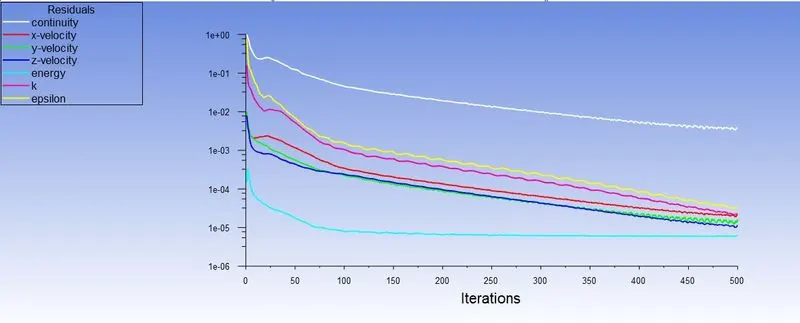
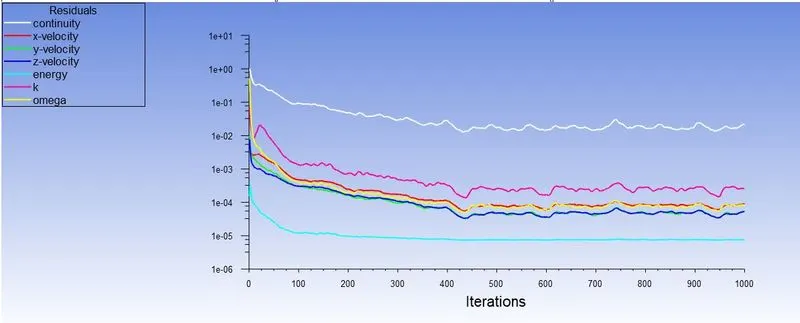
Residuals of governing and transport equations of both k-epsilon and k-w SST models
- By comparing the above couture’s we can say that K-w SST model is extracting model turbulence effect compare with k-epsilon model.
- From figure 5 we can say that for getting converge solutions k-w SST model is taking more time compare with k-epsilon model.
- Finally, we can say that we can use k-w SST turbulence model for further simulations.
NOW we can proceed our case 1 short tee with Momentum raion 2
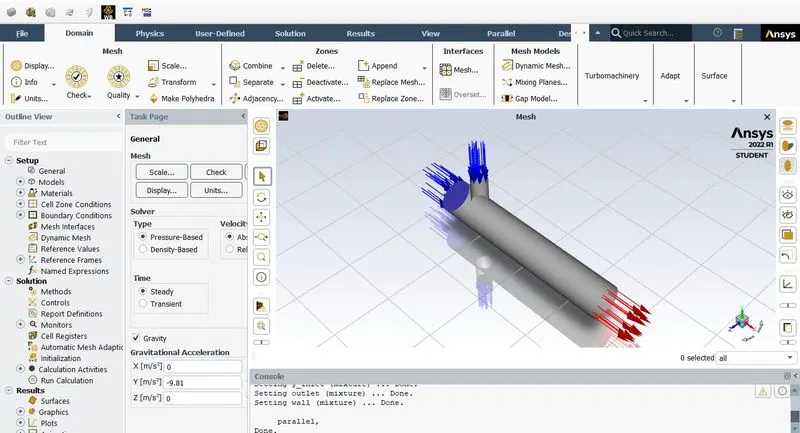
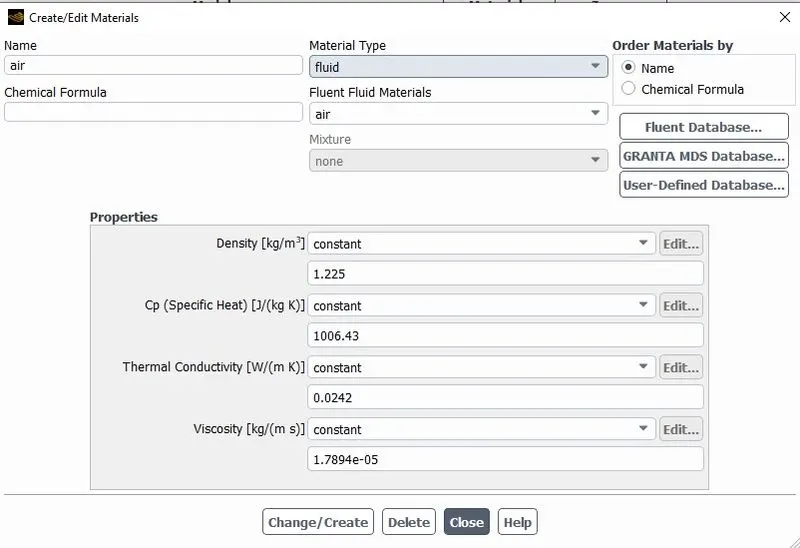
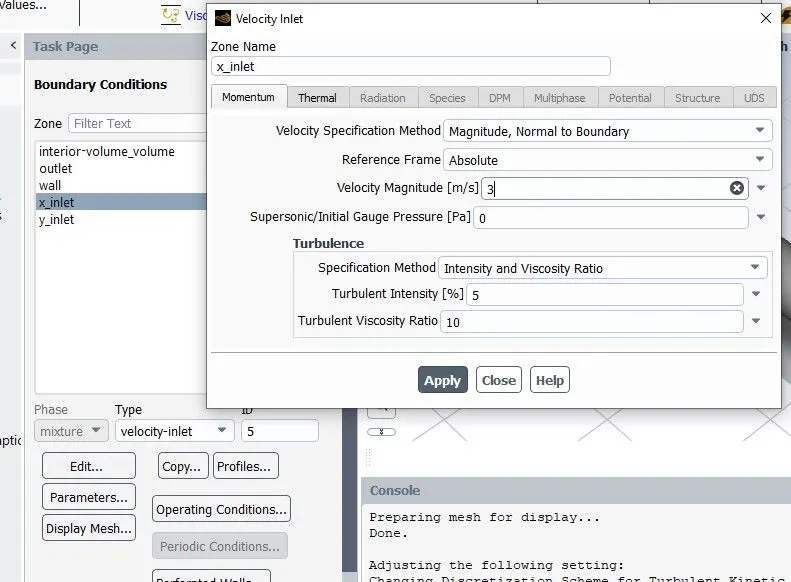
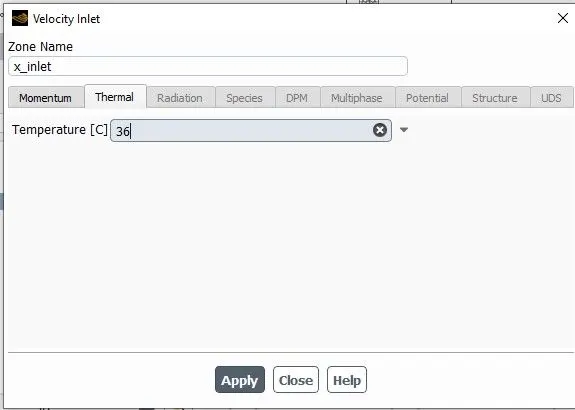
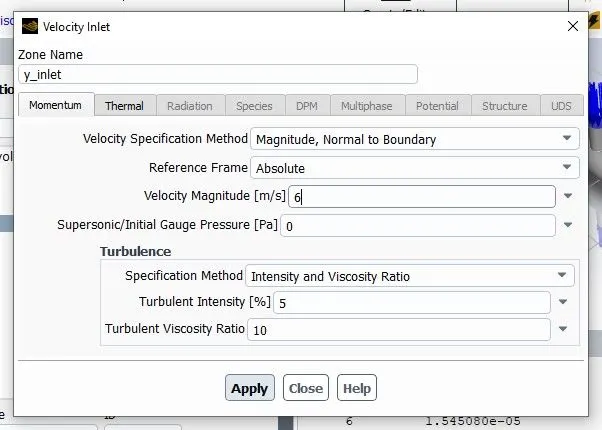
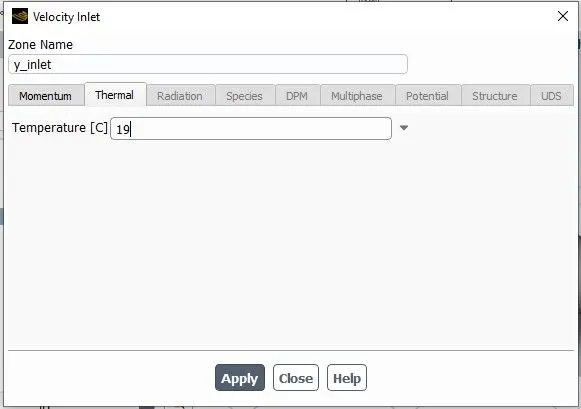
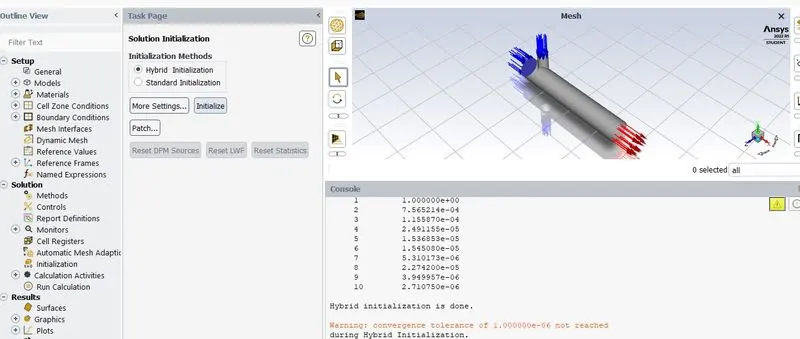
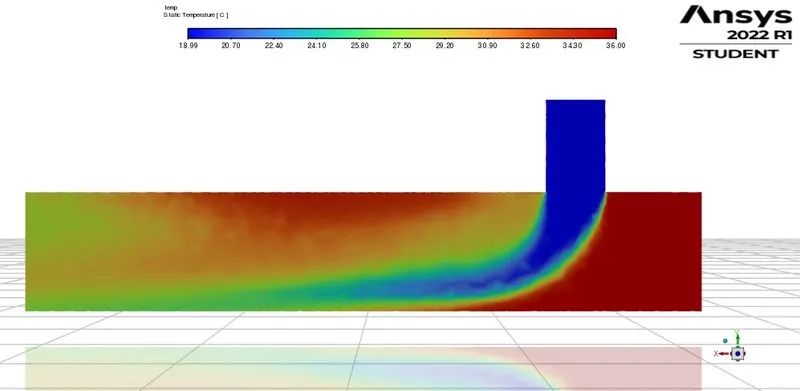
This plot is for the temperature
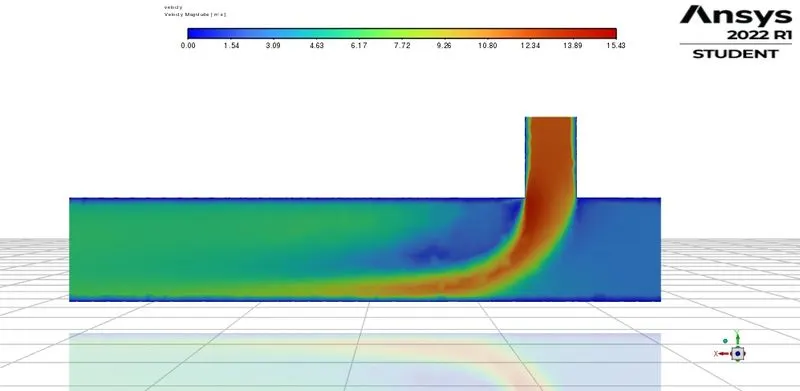
This plot is for the velocity
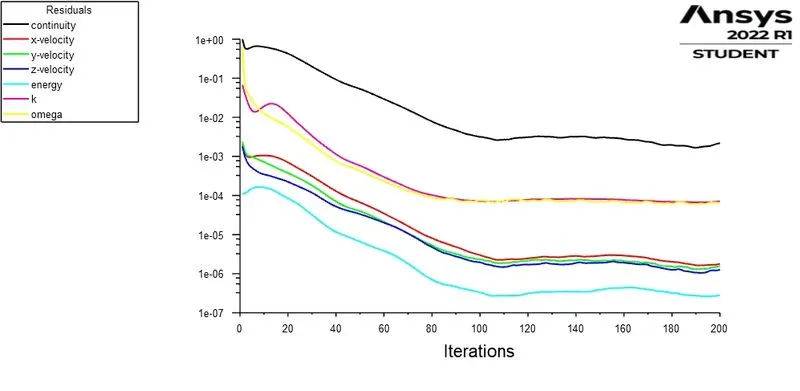
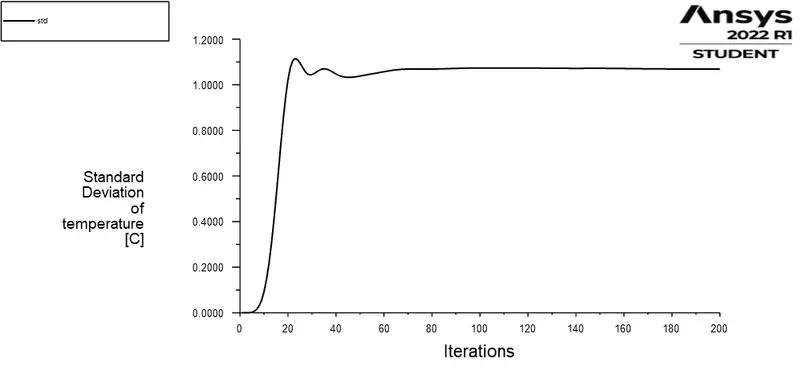
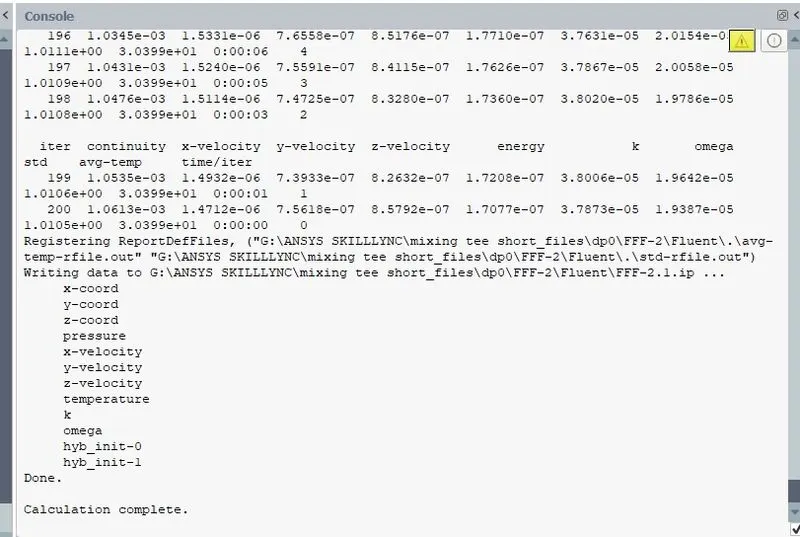
Scaled Residual plot Standard devition plot (std)
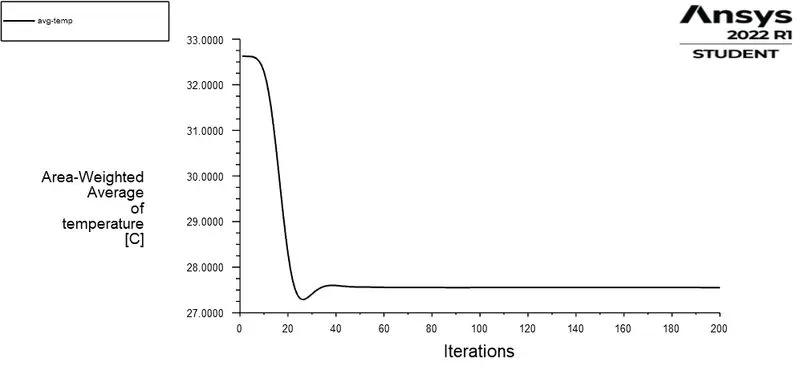
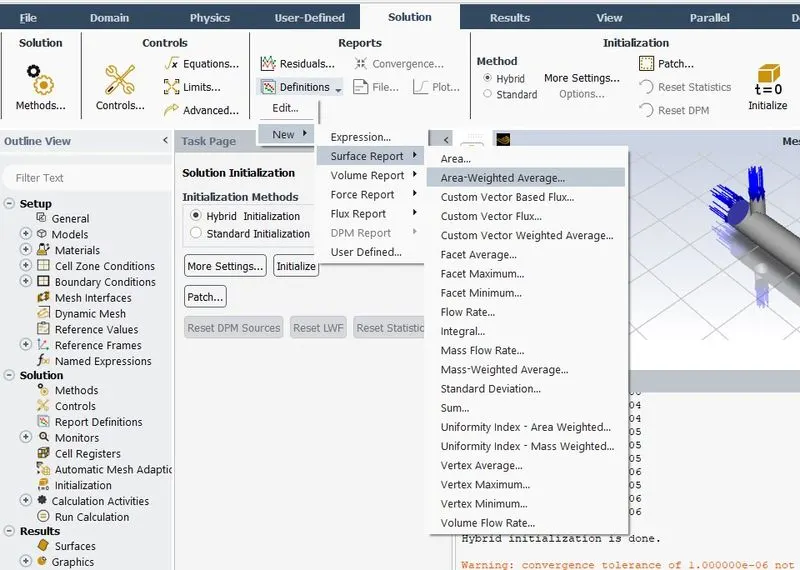
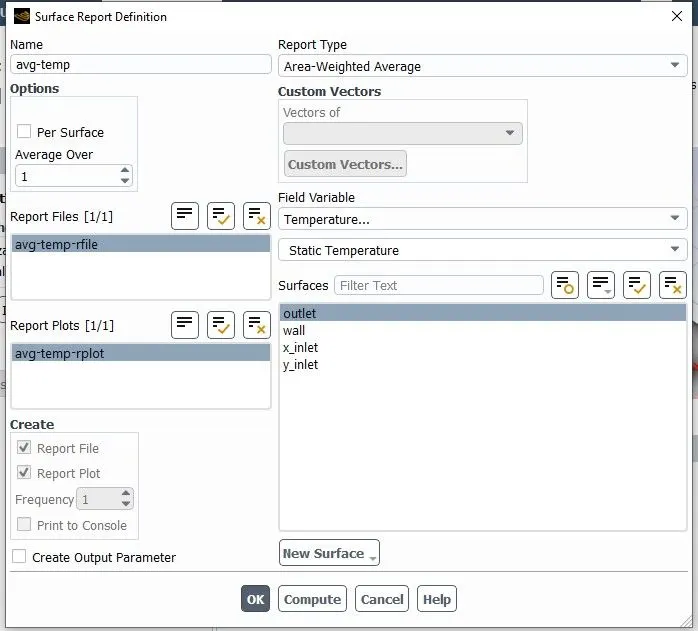
Avg- temperature plot
RESULT PLOTS
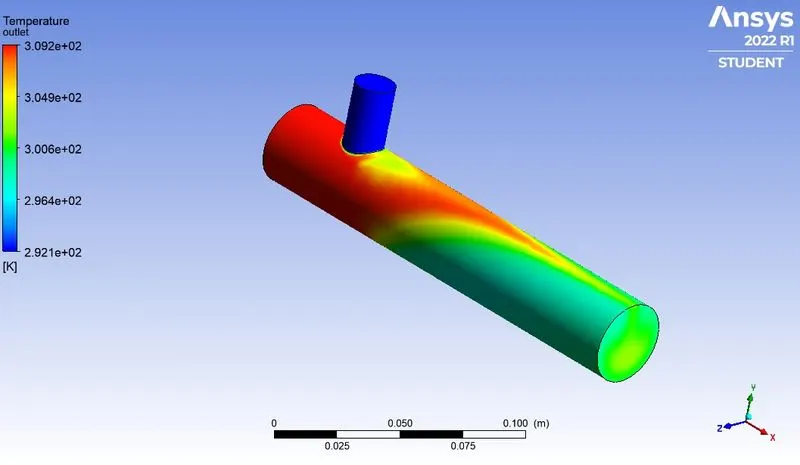
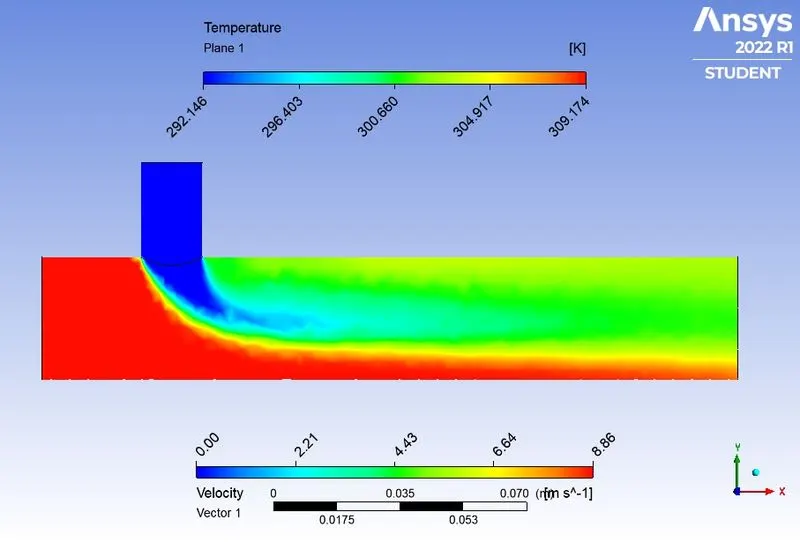
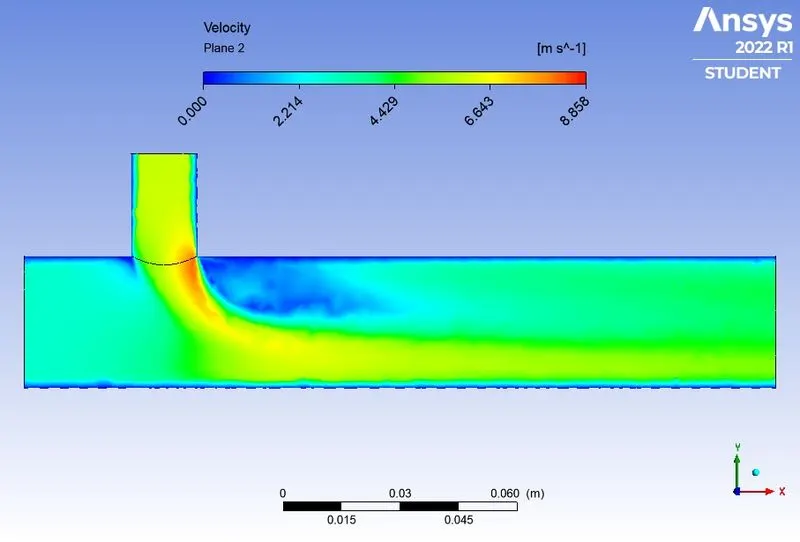
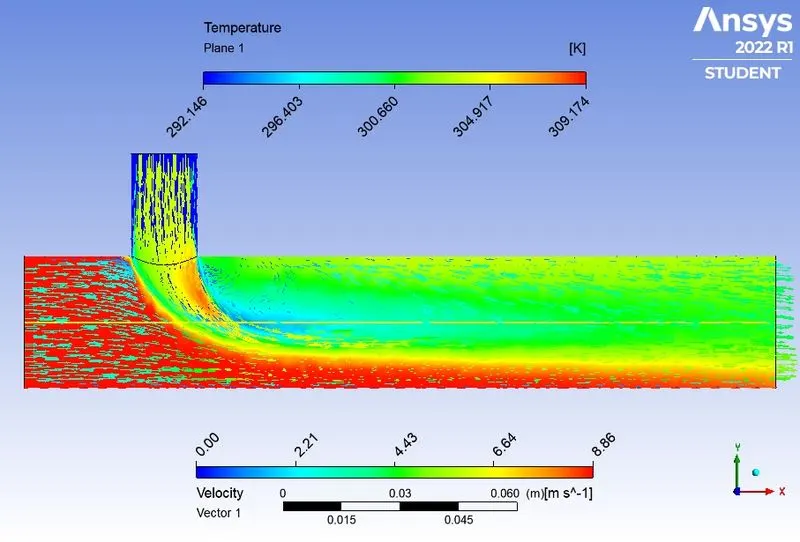
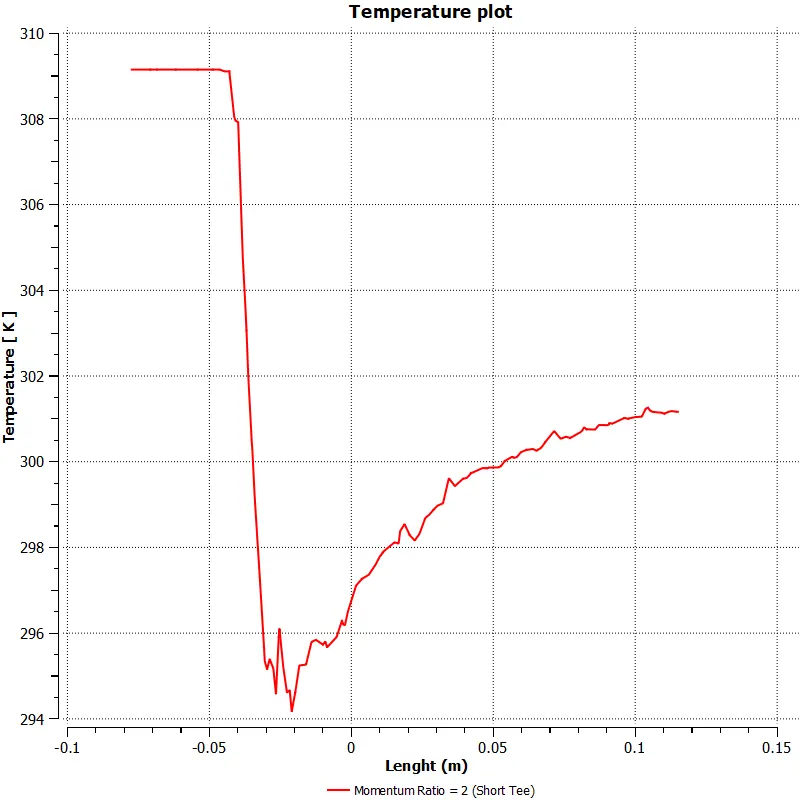
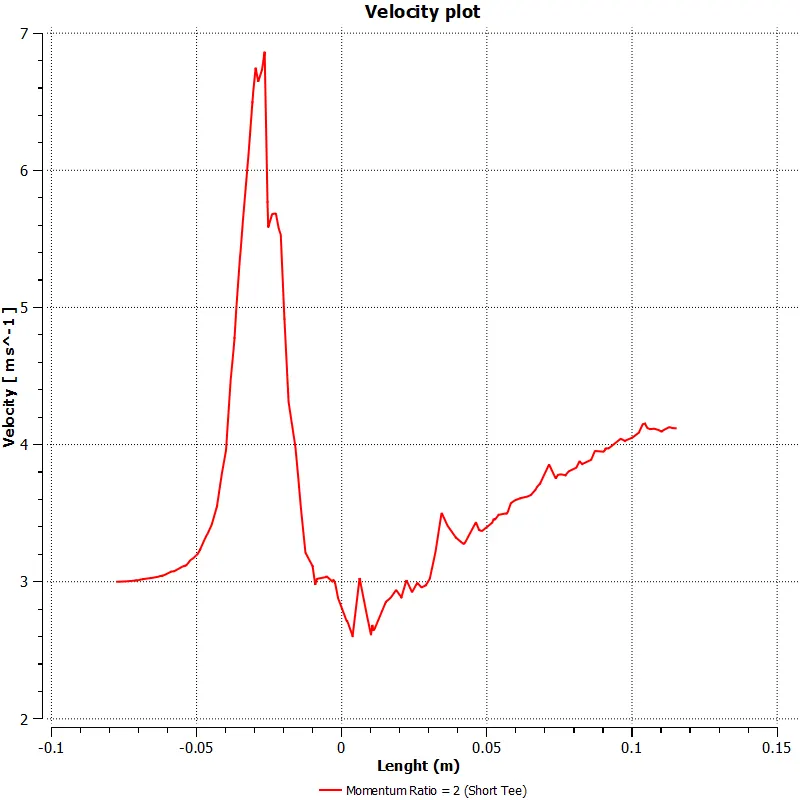
TEMPERATURE PLOT VELOCITY PLOT
NOW WE CAMPARE WITH ANALYTICAL METHOD
WERE HAVE EQUATION FORMULA FOR FIND THIS
This is for short tee MR 2
Analytical formula for Tmix value at outlet is
Tmix = [(mhot * Thot) + (mcold * Tcold)] / (mhot + mcold)
Where, m – mass flow rate = ρ * A*V
Tcold - Temperature at cold inlet = 19oC
Thot - Temperature at hot inlet = 36 oC
Tmix - outlet temperature after mixing
Ahot = 901.3138 mm2, Acold = 225.9823 mm2 , Vhot = 3 m /s , Vcold = 6 m /s
Tmix = 30.322 oC
- By comparing both numerical and analytical solution we can say that % of difference is very less.
case 1 short tee with Momentum ratio 4
as same as Momentum ratio 2 this also same but in y inlet we need change 6 m/s to 12 m/s
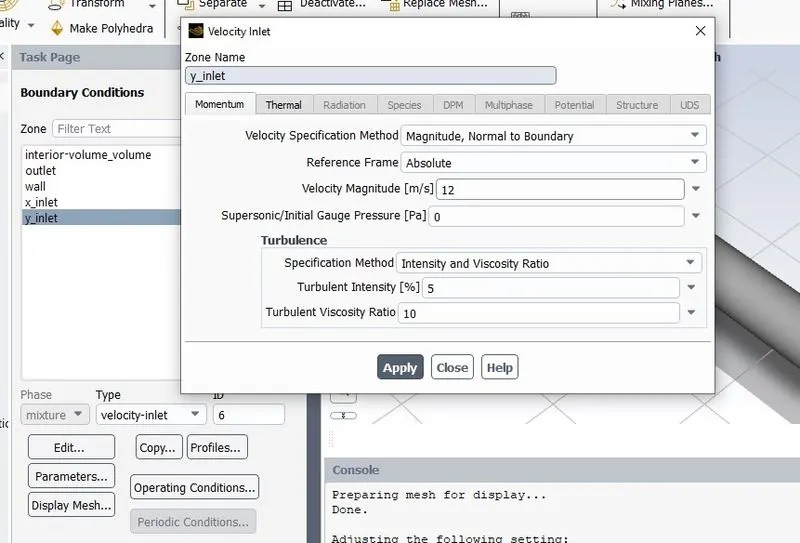
so we can copy the MR 2 and change this alone
RESULT PLOTS
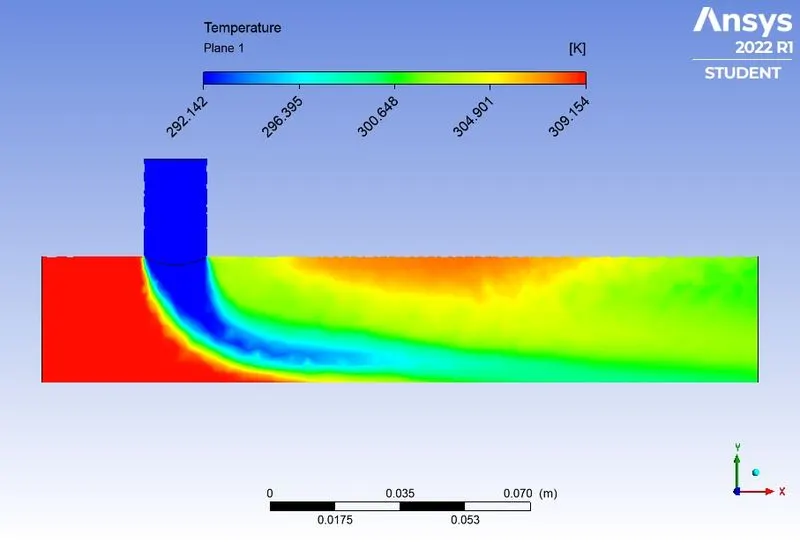
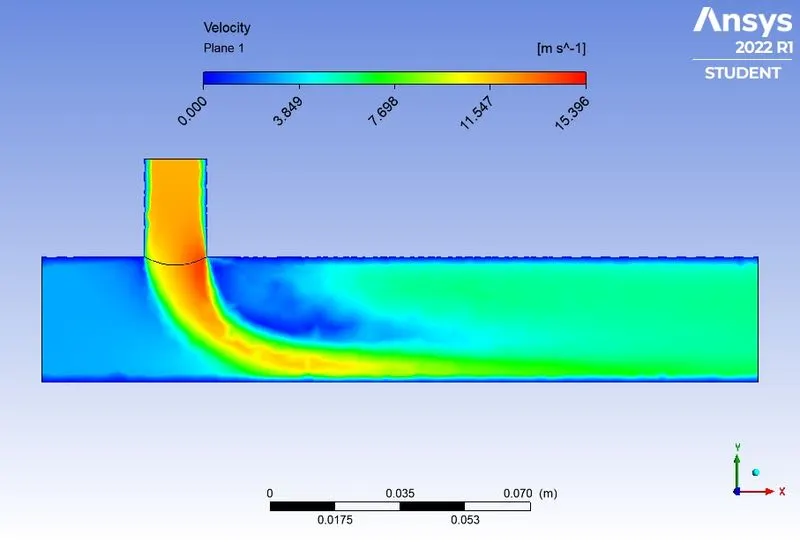
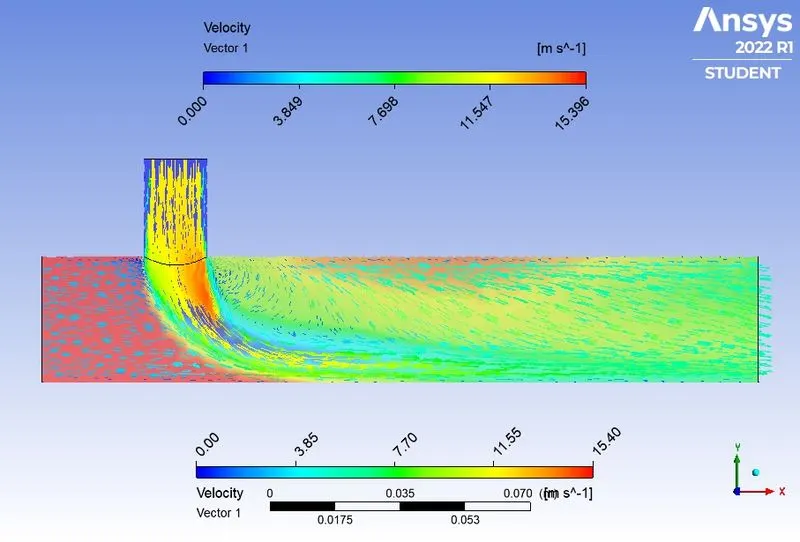
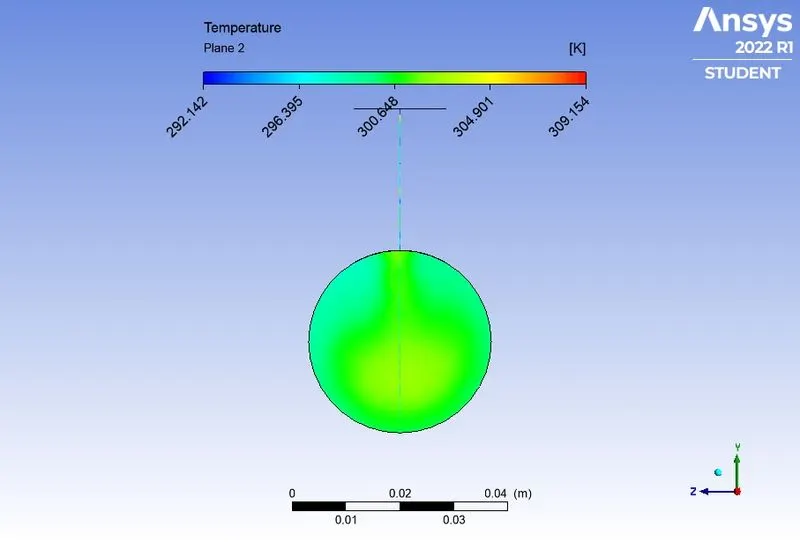
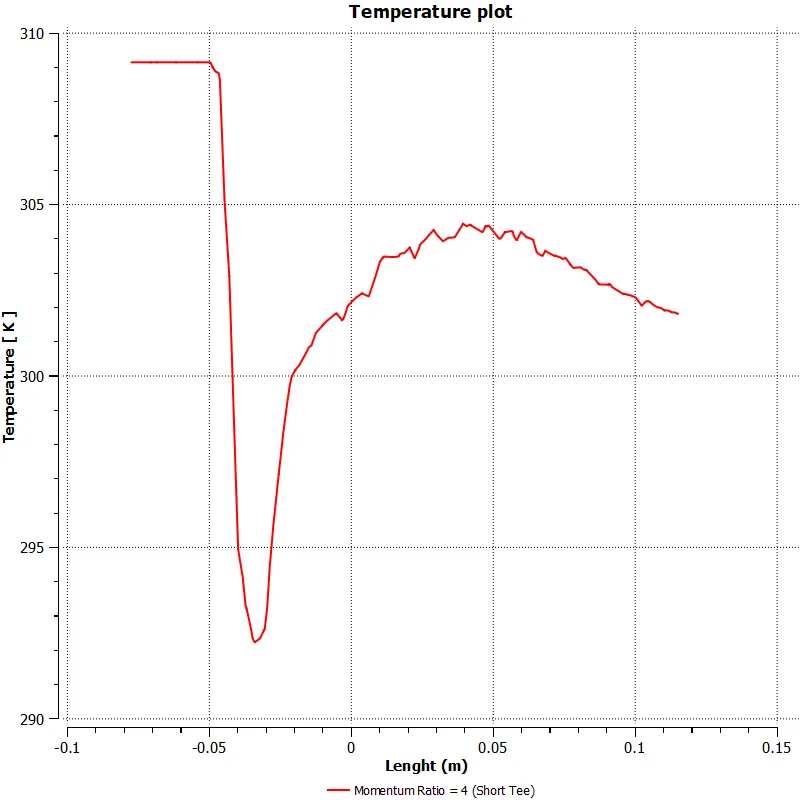
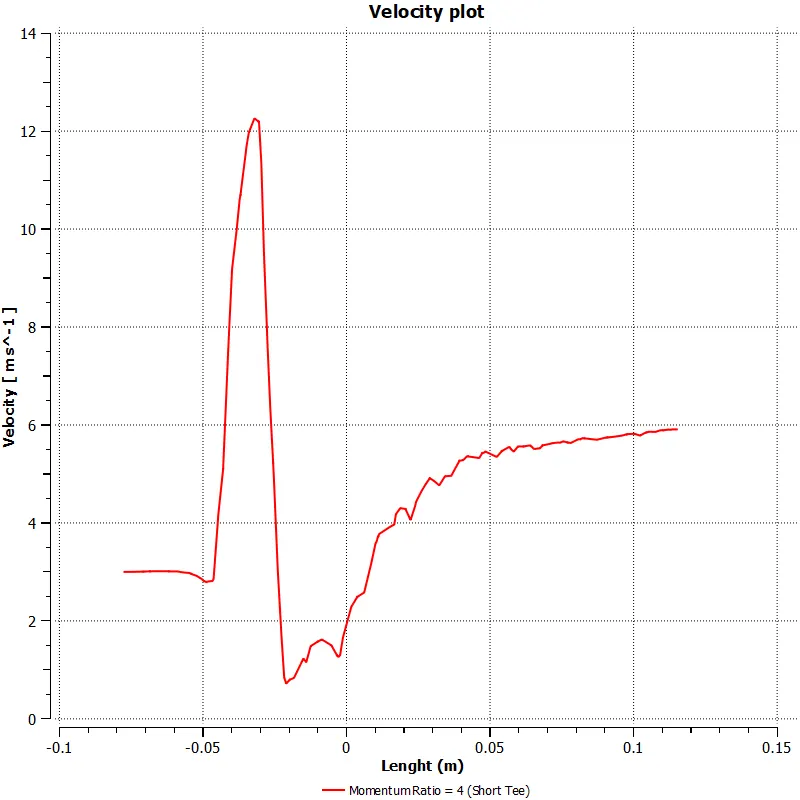
TEMPERATURE PLOT VELOCITY PLOT
NOW WE CAN COMPARE THE MR2 VS MR4
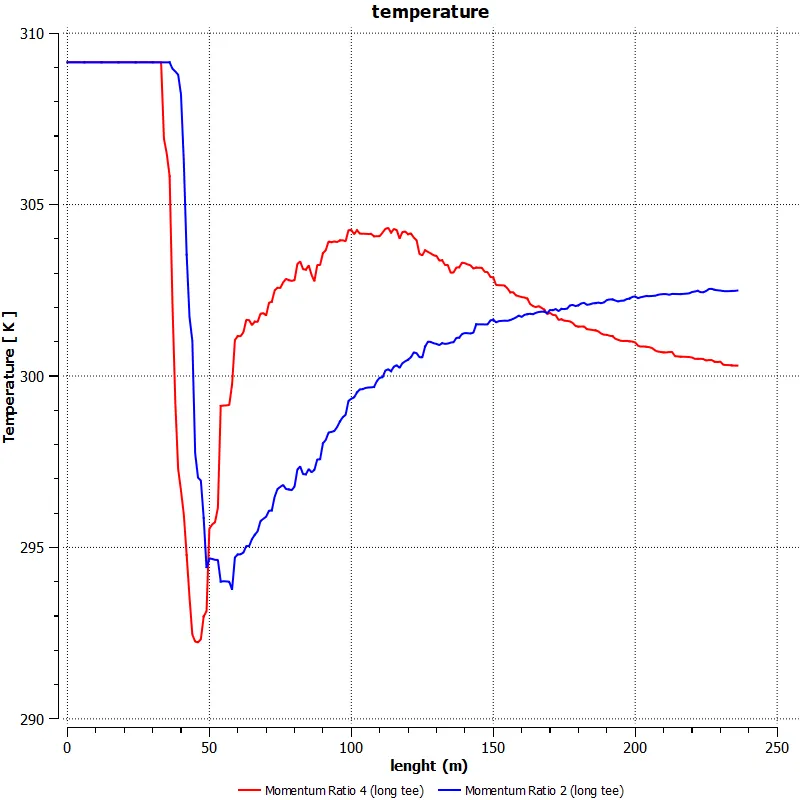
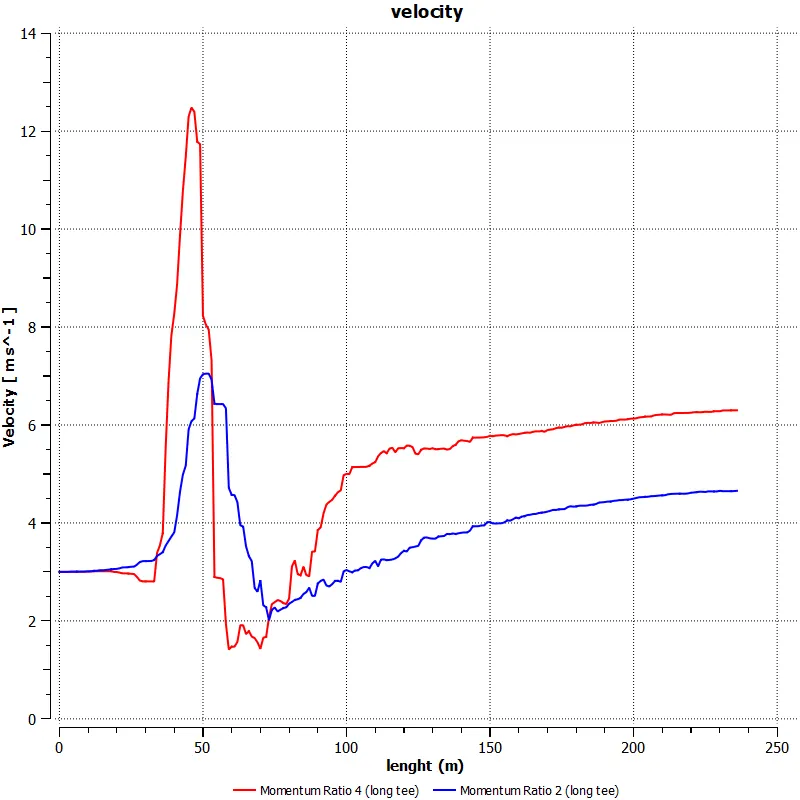
TEMPERATURE PLOT VELOCITY PLOT
SO FROM THE ABOVE COMPARSION THE SHORT TEE WITH MOMENTUM RATIO 4 IS BETTER THAT MOMENTUM RATIO 2
NOW WE CAMPARE WITH ANALYTICAL METHOD
This is for short tee MR 4
- Analytical formula for Tmix value at outlet is
Tmix = [(mhot * Thot) + (mcold * Tcold)] / (mhot + mcold)
Where, m – mass flow rate = ρ * A*V
Tcold - Temperature at cold inlet = 19oC
Thot - Temperature at hot inlet = 36 oC
Tmix - outlet temperature after mixing
Ahot = 901.3138 mm2, Acold = 225.9823 mm2 , Vhot = 3 m /s , Vcold= 12 m /s
Tmix = 27.4877oC
- By comparing both numerical and analytical solution we can say that % of difference is very less
NOW we can proceed our CASE 2 LONG TEE WITH MOMENTUM RATIO 2
IN THIS CASE 2 ALSO SAME AS CASE 1 BUT HERE GEOMETRY IS CASE 2 MIXING TEE LONGER
AS SAME PROCEDURE IS FOLLOWED FOR THE CASE 2 WITH MOMENTUM RATIO 2
IN SETUP PART THE Y INLET 6 M/S IS GIVEN
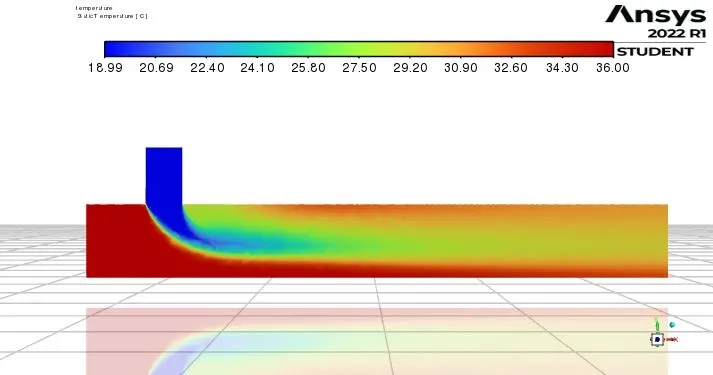
THIS SETUP TEMPERATURE PLOT
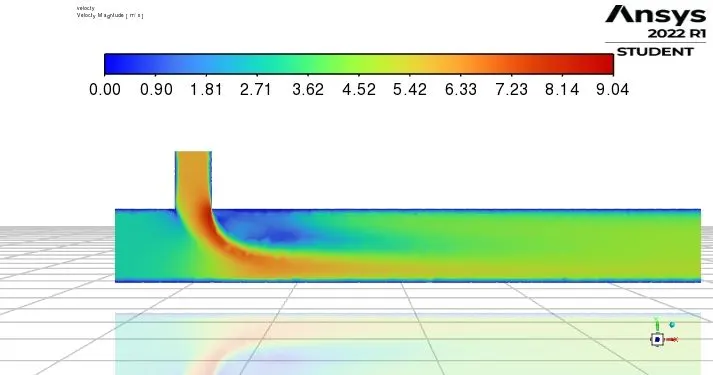
THIS SETUP VELOCITY PLOT
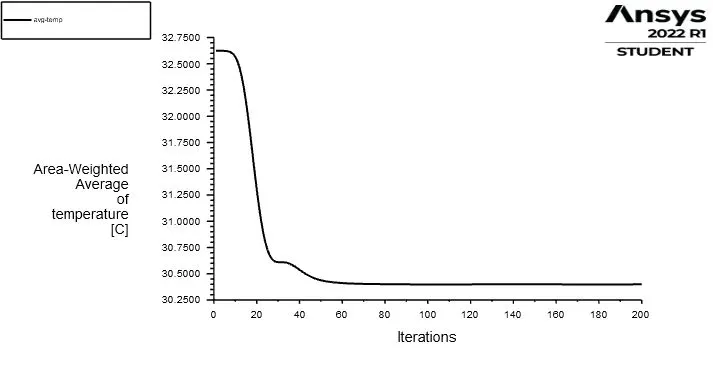
Avg- temperature plot
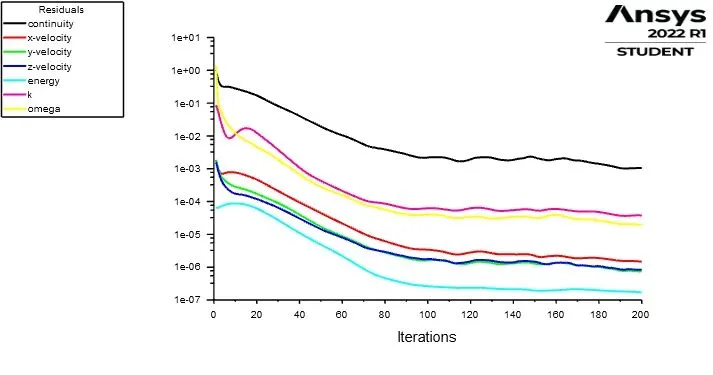
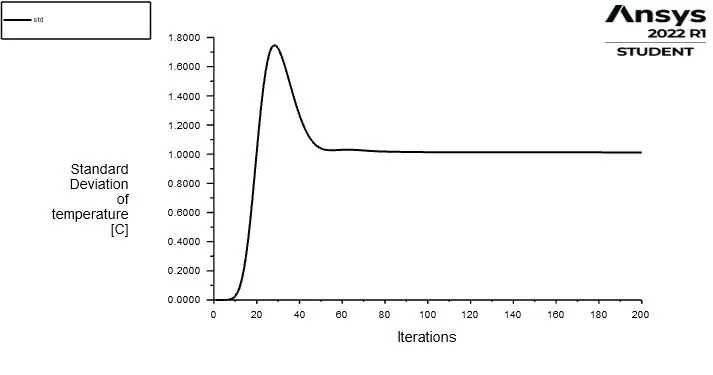
Scaled Residual plot Standard devition plot (std)
RESULT PLOTS
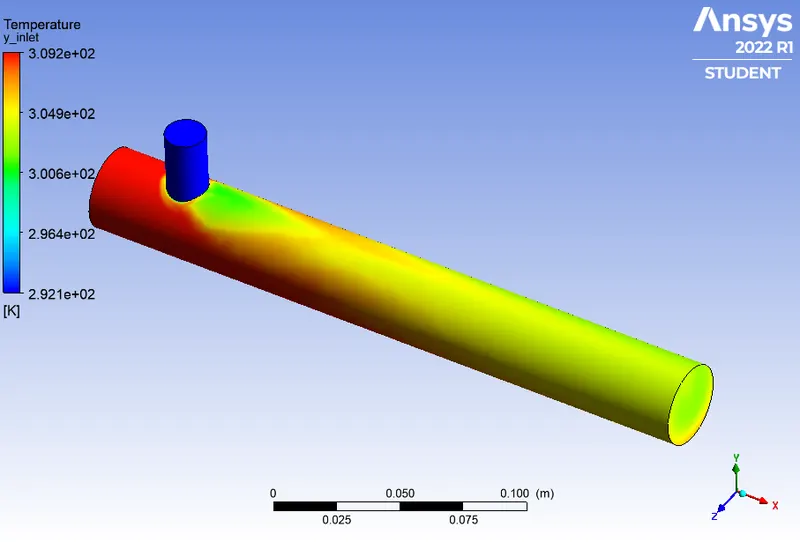
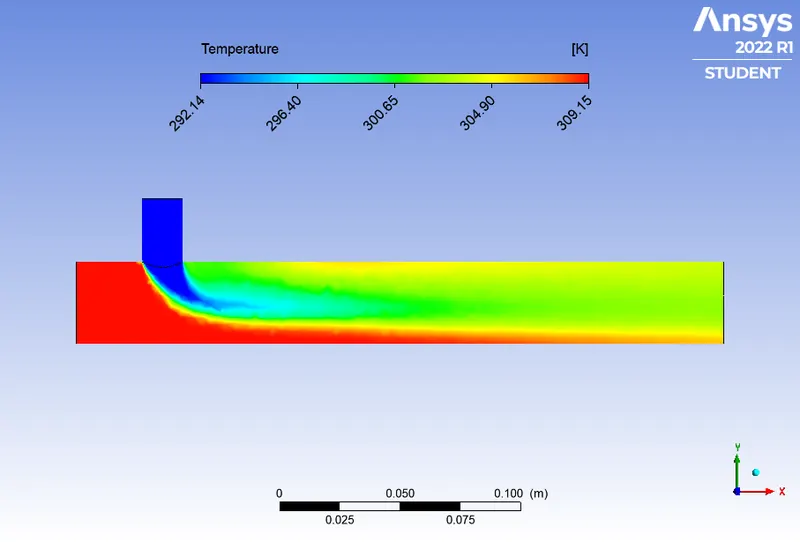
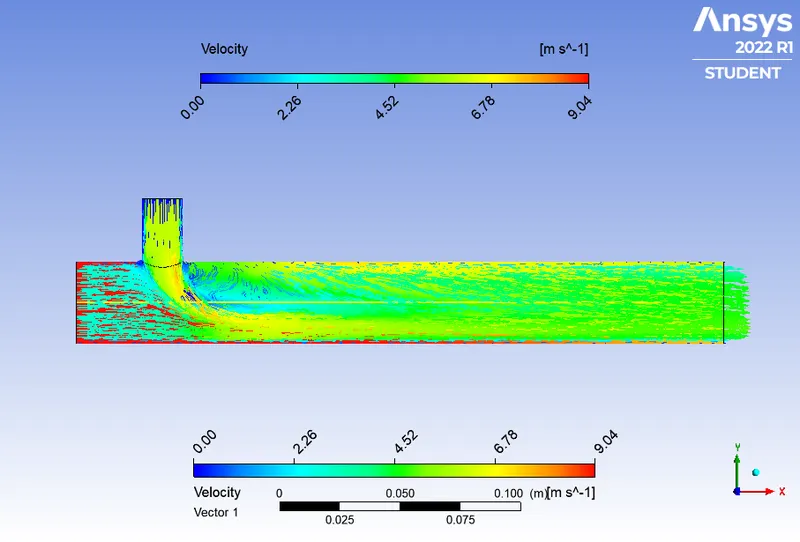
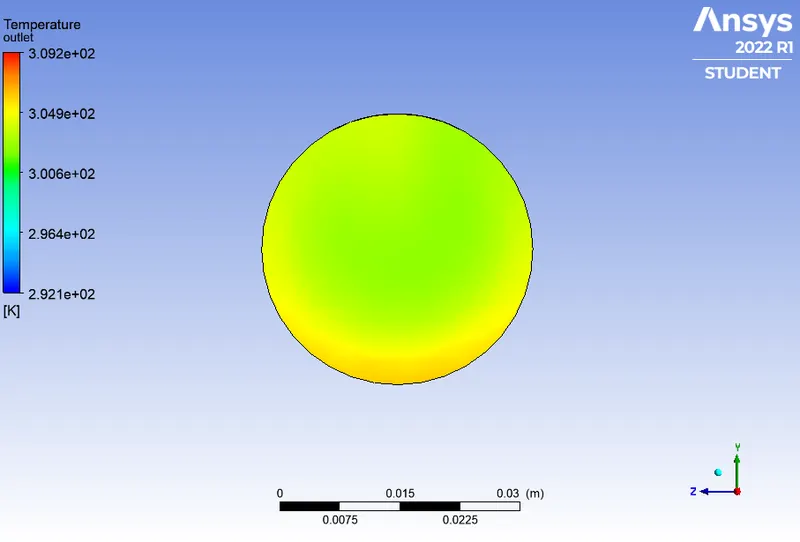
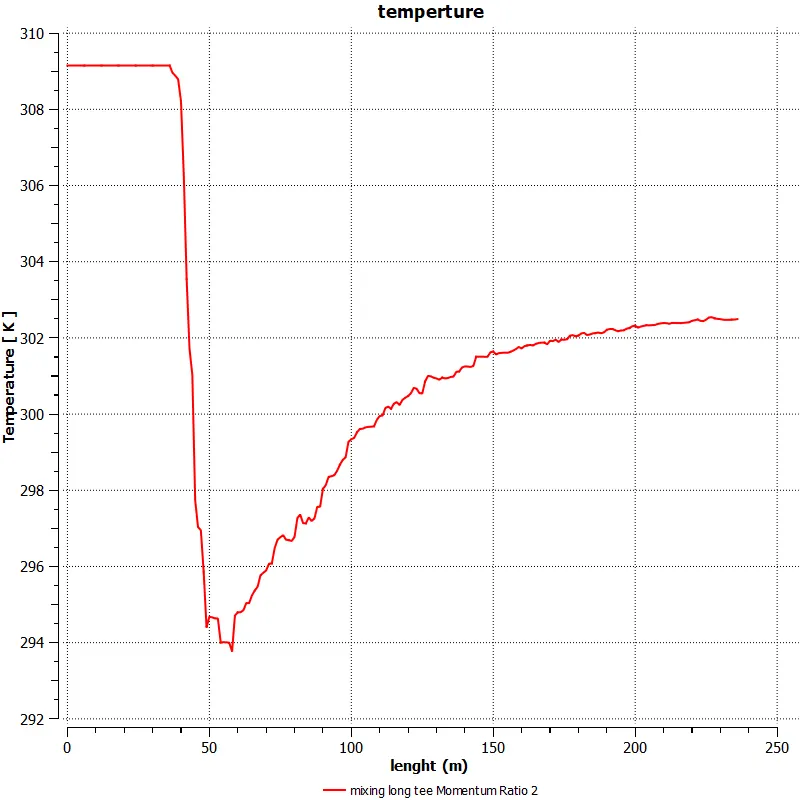
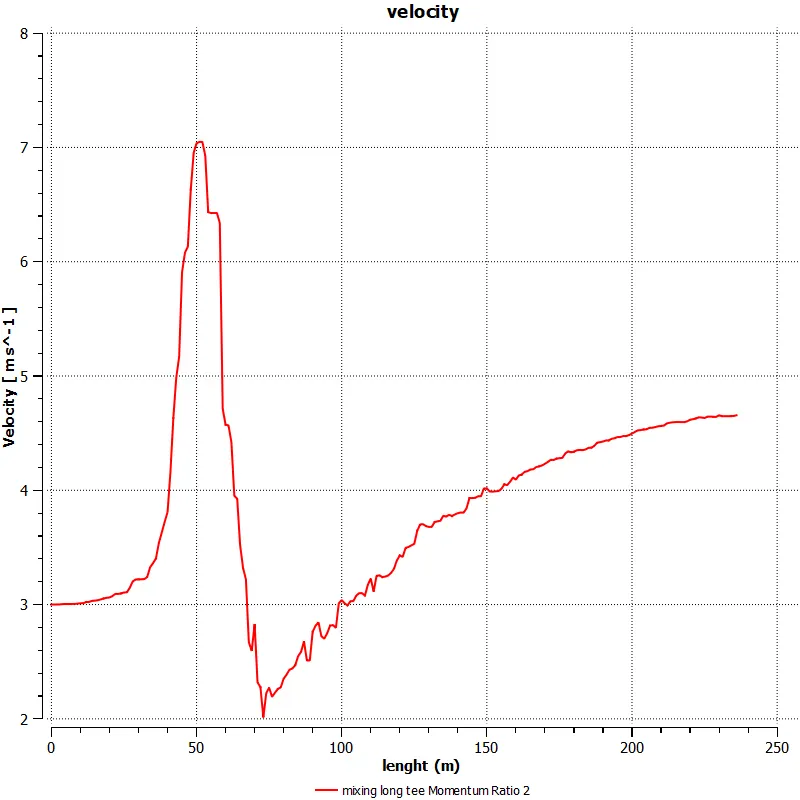
TEMPERATURE PLOT VELOCITY PLOT
WE CAMPARE WITH ANALYTICAL METHOD
This is for long tee MR 2
- Analytical formula for Tmix value at outlet is
Tmix = [(mhot * Thot) + (mcold * Tcold)] / (mhot + mcold)
Where, m – mass flow rate = ρ * A*V
Tcold - Temperature at cold inlet = 19oC
Thot - Temperature at hot inlet = 36 oC
Tmix - outlet temperature after mixing
Ahot = 901.3138 mm2, Acold = 225.9823 mm2 , Vhot = 3 m /s , Vcold = 6 m /s
Tmix = 30.322 oC
- By comparing both numerical and analytical solution we can say that % of difference is very less
NOW WE DO THE SAME FROM CASE2 MOMENTUM RATIO 4
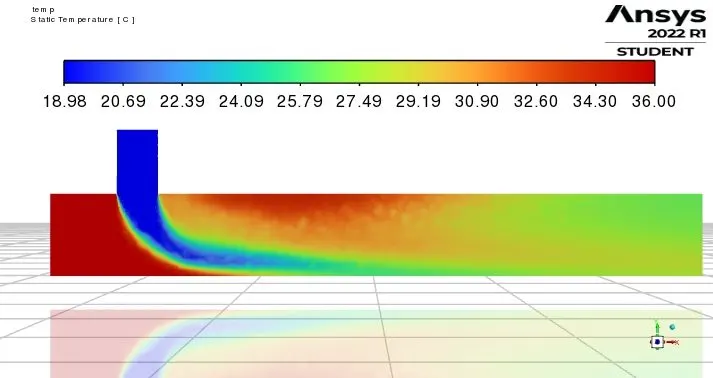
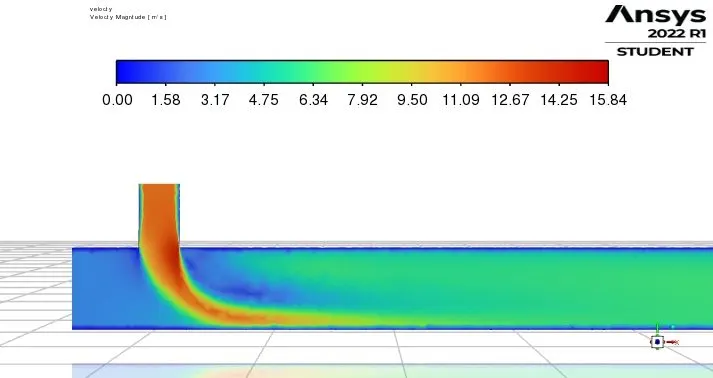
case 1 LONG tee with Momentum ratio 4
as same as Momentum ratio 2 this also same but in y inlet we need change 6 m/s to 12 m/s
so we can copy the MR 2 and change this alone
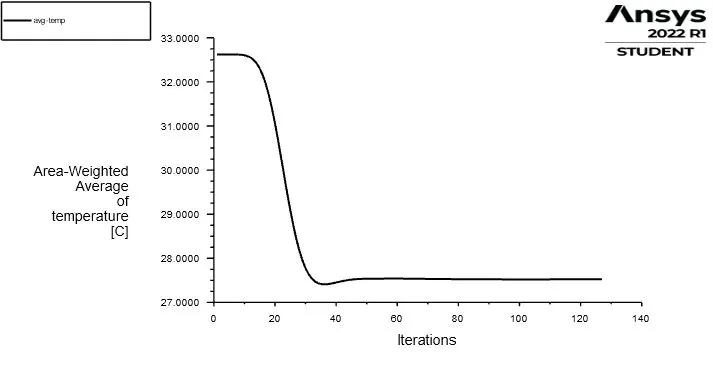
Avg- temperature plot
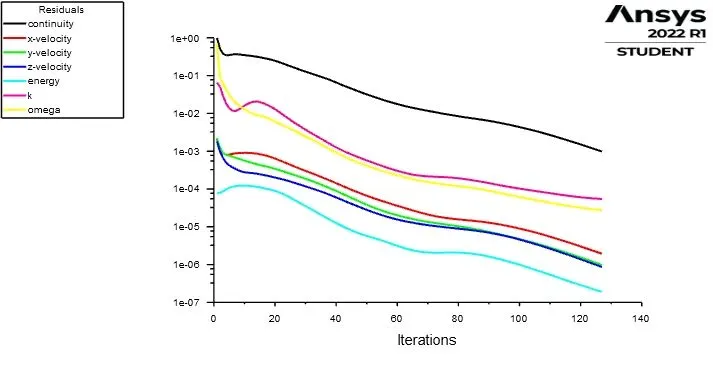
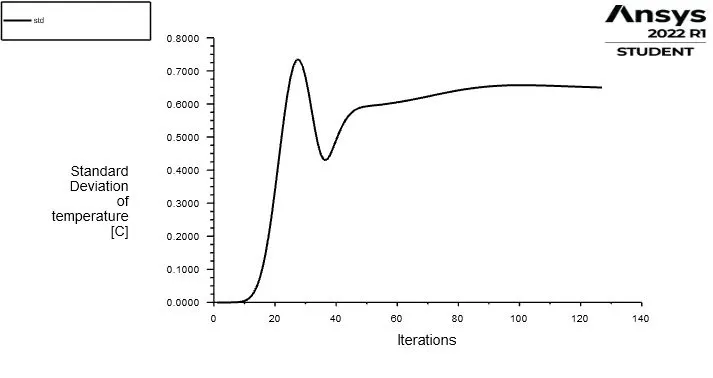
Scaled Residual plot Standard devition plot (std)
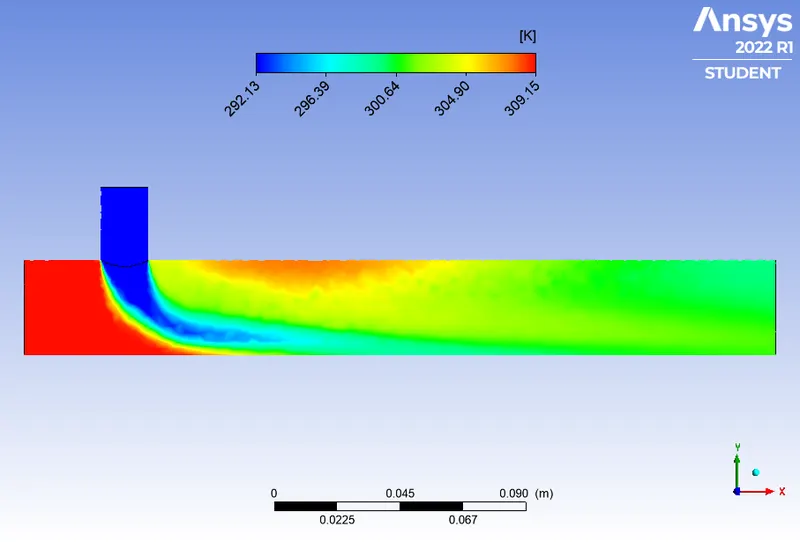
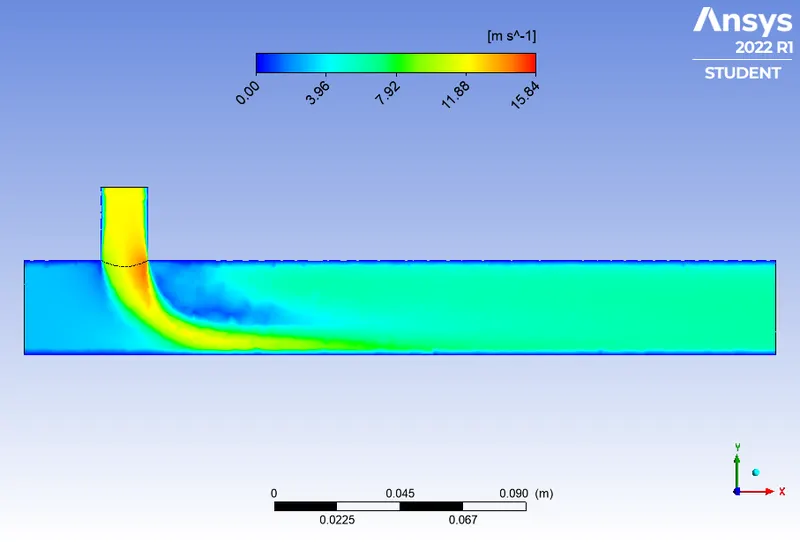
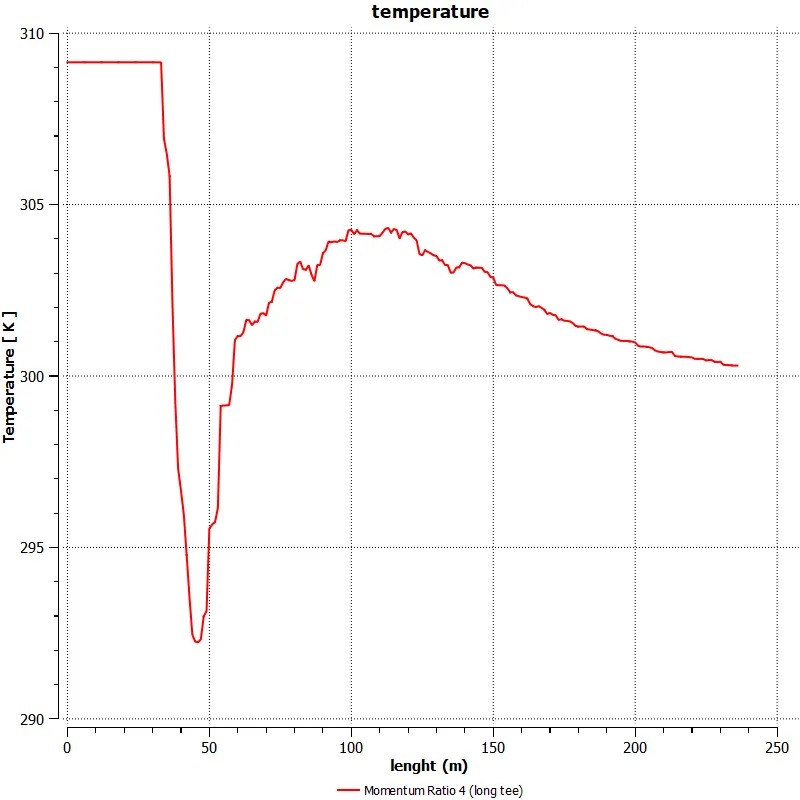
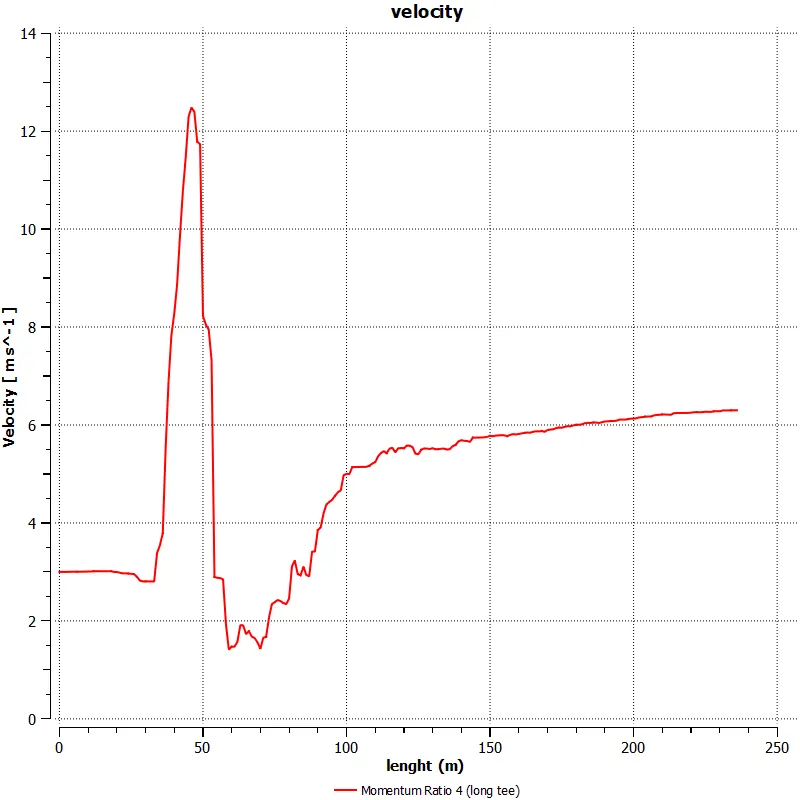
TEMPERATURE PLOT VELOCITY PLOT
WE CAMPARE WITH ANALYTICAL METHOD
This is for long tee MR 4
- Analytical formula for Tmix value at outlet is
Tmix = [(mhot * Thot) + (mcold * Tcold)] / (mhot + mcold)
Where, m – mass flow rate = ρ * A*V
Tcold - Temperature at cold inlet = 19oC
Thot - Temperature at hot inlet = 36 oC
Tmix - outlet temperature after mixing
Ahot = 901.3138 mm2, Acold = 225.9823 mm2 , Vhot = 3 m /s , Vcold= 12 m /s
Tmix = 27.4877oC
- By comparing both numerical and analytical solution we can say that % of difference is very less
NOW WE CAN COMPARE THE LONG TEE MR 2 VS MR 4
TEMPERATURE PLOT VELOCITY PLOT
SO FROM THE ABOVE COMPARSION THE LONG TEE WITH MOMENTUM RATIO 4 IS BETTER THAT MOMENTUM RATIO 2
NOW WE CAN COMPARE SHORT TEE AMD LONG TEE
- Cell count
- Average outlet temperature
- Number of iterations for convergence
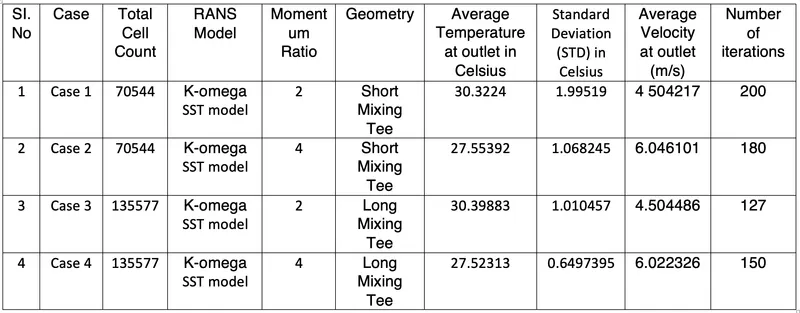
FROM THE ABOVE TABLE THE WE CAN SAY THAT LONG MIXING TEE WITH MOMENTUM RATIO 4 BETTER WITH COMPARED SHORT TEE AND OTHER MOMENTUM RATIOS
Mesh independent study for any one case
- Here I took short mixing tee momentum ratio 2 case.
| SL.NO | No: elements | Average Outlet Temperature in Celsius |
| 1 | 13014 | 30.256 |
| 2 | 14453 | 30.211 |
| 3 | 39951 | 30.272 |
- From above table we can say that our mesh is independent that means there is no large changes in outlet temperature by increasing the number of elements.
- So we can prefer less number of elements mesh also for simulations.
- The main advantage of this study is to decrease the computational time for solving.
Effect of length and momentum ratio on results: -
- From above comparsion table results we can say that outlet temperature is independent of length of the mixing tee.
- Momentum ratio effects the outlet temperature. By increasing the momentum ratio outlet temperature is dropping.
- From above validation of numerical and analytical values we can say that numerical simulation values are matching with analytical values.
Conclusion:
- The flow in a mixing tee geometry was simulated successfully using Ansys Fluent Software.
- The flow in a mixing tee geometry was also calculated analytically for the comparison with the computational results.
- The wet region (fluid flowing region) was extracted and the regions are named successfully. Once the naming is done the geometry is meshed under certain parameters and finally the case is setup.
- The first case is setup with K-epsilon and k-omega SST models to choose which have the most effectiveness with the analytically calculated value.
- By comparing the computational results with the analytical results, k-omega SST model is more suitable for this type of simulation.
- The study of flow in short mixing tee and long mixing tee have no difference in the outlet velocity and temperature. This means that, the change in the length of the pipe should not affect the mixing of the flow.
- The cold stream velocity from the inlet-y creates an impact on the outlet temperature. If the velocity is increased in the inlet-y the temperature decreases significantly.
- From the mesh independent study we could observe that if we use a coarse mesh, the computational time is getting lower but when we compare the results with the finer mesh and analytical value we could observe a lot of change in the value.