Week 1- Mixing Tee
In this challenge we are supposed to simulate the mixing of air, in a mixing tee of different lengths, air entering the system has different temperatures and momentum ratios. We are to observe the changes in temperature at the outlet, how it is affected by these parameters.
Also, we need to notice the changes when we use different turbulent models, in this case, k-epsilon and k-omega SST.
Here below are the pictures of the mesh, mesh metrics, residuals, and simulation results for different cases.
SHORT TEE:
LONG TEE:
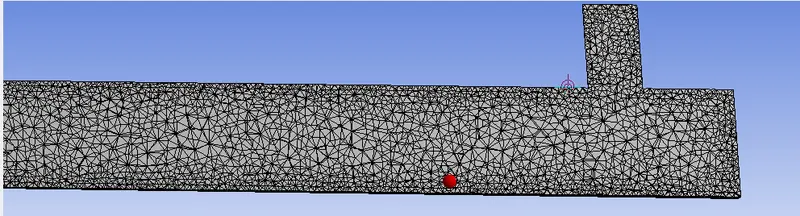
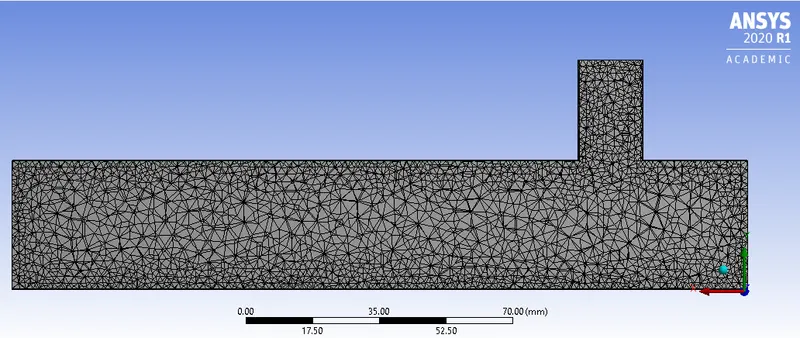
The pictures above show the mesh which had been used for simulation, it's evident that the mesh is an unstructured mesh with tetrahedral elements, the size of the mesh used here for both cases is 2mm, for faster mesh generation and convergence in results. The other mesh settings were left at default, only changes in mesh quality were made. Corresponding name selections were also made namely the inlet, outlet, and walls.
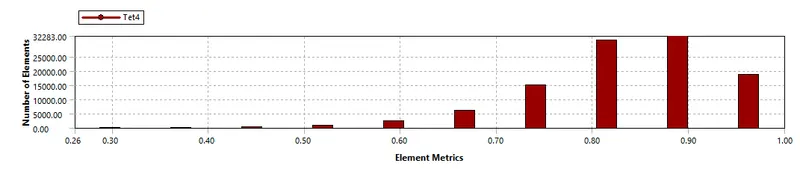
The mesh metric for both cases is uploaded here:
SHORT TEE:
LONG TEE:
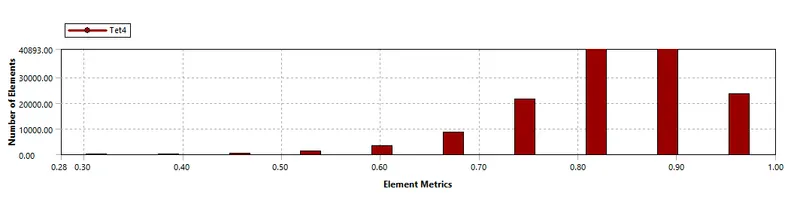
As we can evidently see the mesh quality is well above 5% for both cases hence the mesh can be used for simulation.
The cases for simulations with elements and nodes are provided in the table.
| INLET VELOCITY | ELEMENTS | NODES | TEMPERATURE | |
| LONG TEE | 6 M/S AND 12 M/S | 139627 | 28201 |
At hot inlet: 36 At cold inlet:19 |
| SHORT TEE | 6 M/S AND 12 M/S | 105857 | 21330 |
At hot inlet: 36 At cold inlet:19 |
Post the meshing we proceed towards setting up the different aspects of the simulation in fluent, the following setup was followed:
1. Pressure solver ( Speeds are low, compressibility effects can be neglected)
2. Turbulence models: k- epsilon & k-omega SST.
3. Energy equation turned on to get the temperature.
4. Materials in simulation specified as air, with standard properties.
5. The inlets are velocity inlets, with outlets as pressure outlets with gauge pressure zero.
6. Residuals are set to 1e-3 to 1e-4.
7. Create report definitions with a temperature average distribution at the outlet ( Surface weighted average).
8. Hybrid initialization with 250 iterations to be run.
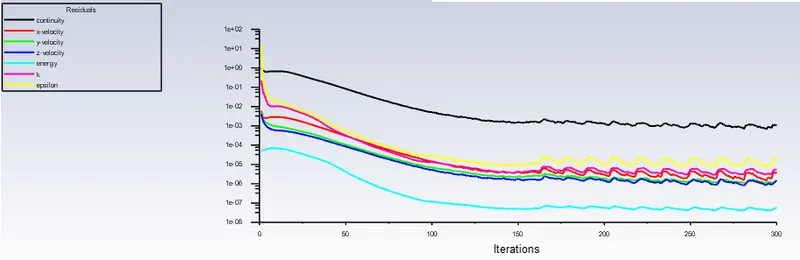
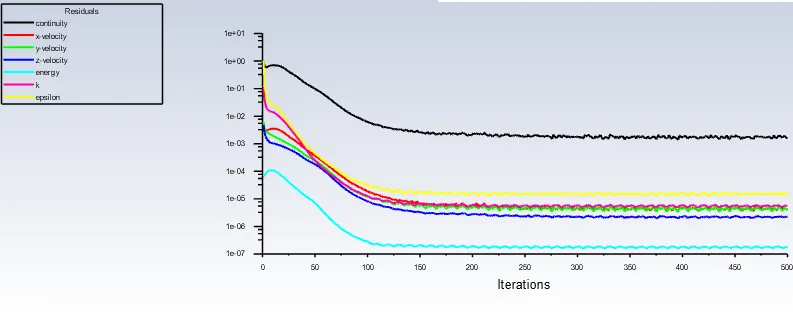
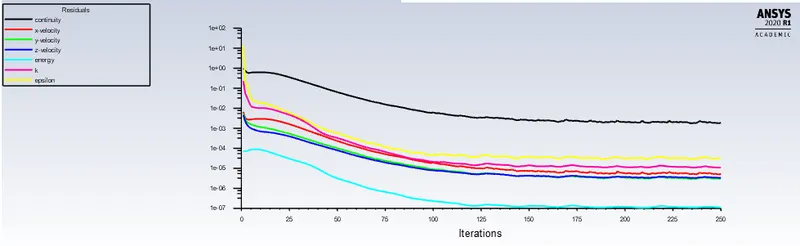
The residuals for the different cases are shown below:
LONG TEE MOMENTUM RATIO 2
LONG TEE MOMENTUM RATIO 4
SHORT TEE MOMENTUM RATIO 2
SHORT TEE MOMENTUM RATIO 4
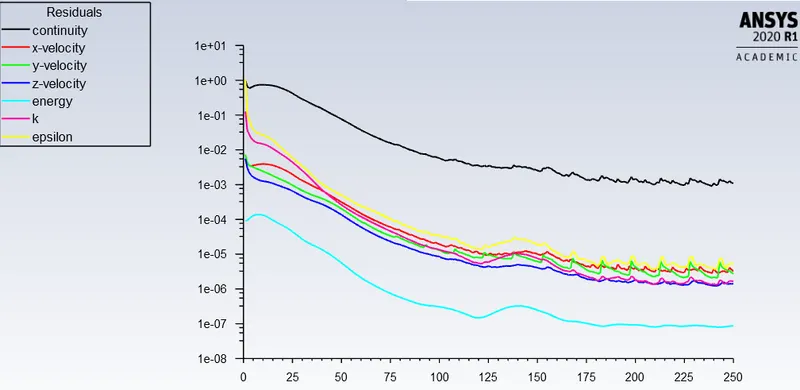
The different simulation cases with the number of iterations for convergence is shown below:
| MOMENTUM RATIO | ITERATION FOR CONVERGENCE | |
| LONG TEE | 2 | 175 |
| LONG TEE | 4 | 135 |
| SHORT TEE | 2 | 160 |
| SHORT TEE | 4 | 160 |
The condition for convergence observed here is that the plot shows the same trend.
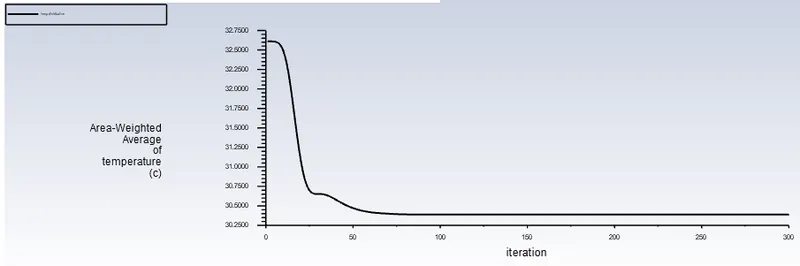
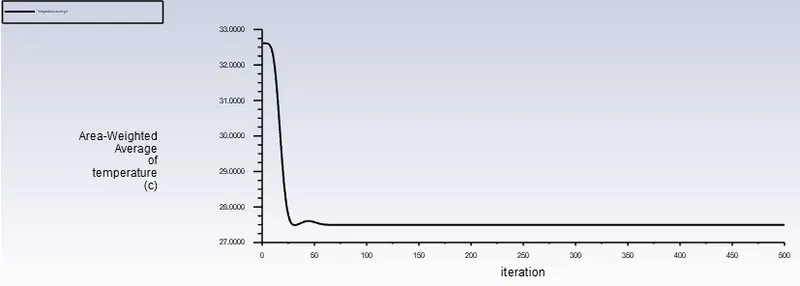
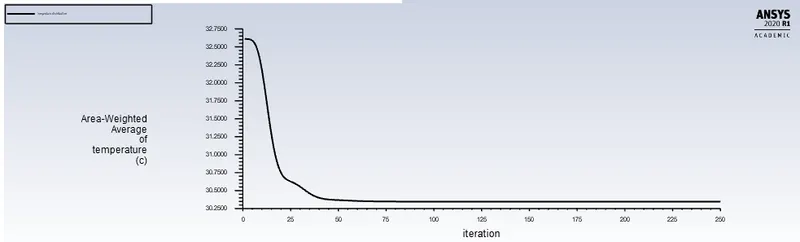
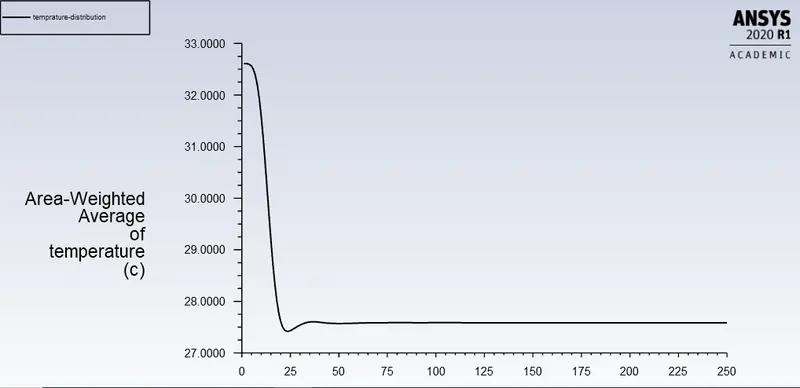
The plots obtained, i.e the average temperature distribution at the outlet for the simulated cases are:
LONG TEE MOMENTUM 2:
LONG TEE MOMENTUM 4:
SHORT TEE MOMENTUM 2:
SHORT TEE MOMENTUM 4:
The average temperature and deviations can be inferred as:
| AVERAGE TEMPERATURE DISTRIBUTION | STANDARD DEVIATIONS | |
| LONG TEE (M-2) |
30.388 |
1.181 |
| SHORT TEE (M-2) | 30.52 | 1.773 |
| LONG TEE (M-4) | 27.49 | 0.646 |
| SHORT TEE (M-4) | 27.586 | 1.5229 |
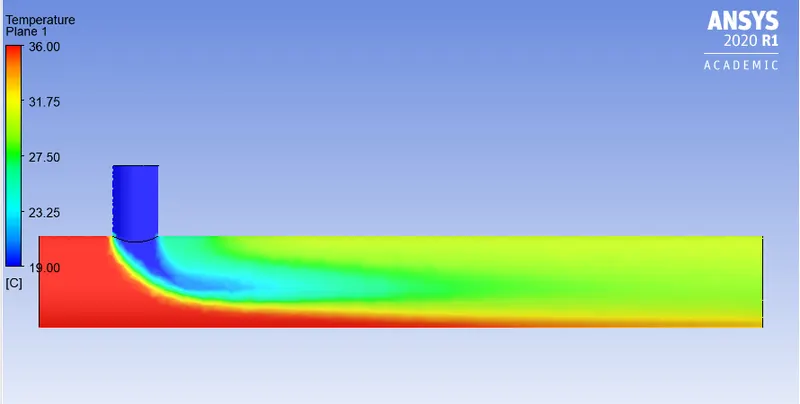
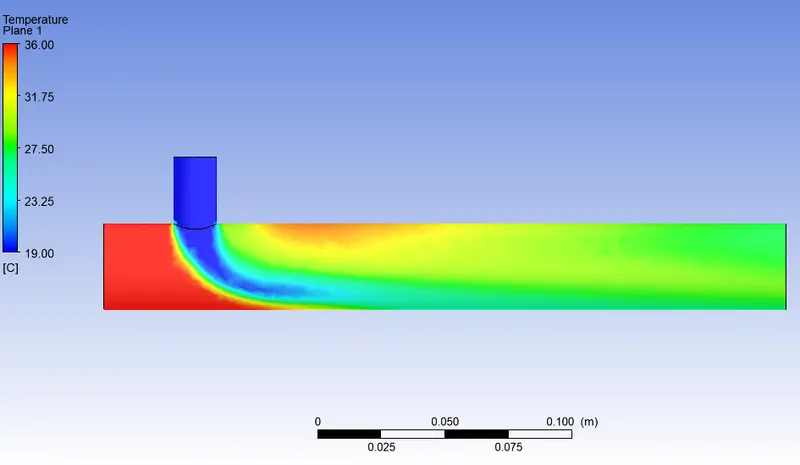
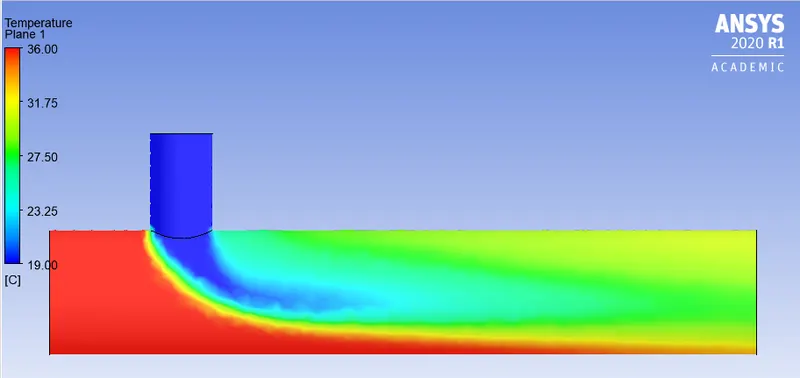
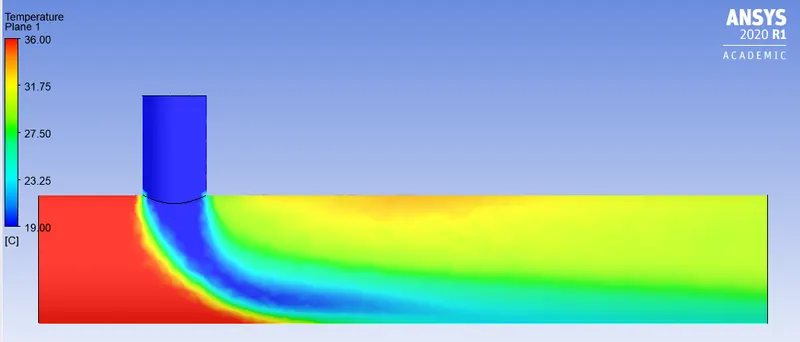
The temperature contours for the different cases are shown as below:
LONG TEE (M-2)
LONG TEE (M-4)
 SHORT TEE (M-2)
SHORT TEE (M-4)
CONCLUSIONS:
1. It is very evident from the plots, data, and contours that lower average temperatures are achieved when the momentum ratio is higher, i.e higher velocity of the cold inlet will result in lower average temperatures.
2. Momentum ratios do not play a vital role in the uniformity of the outlet temperature distribution.
3. The length of the tee does not affect the average temperature at the outlet, but yes we do observe that the standard deviation in temperature for a shorter tee is higher, irrespective of the momentum ratio, i.e temperature distribution at the outlet is not uniform, for the shorter tee.
4. Regarding the turbulence models k-epsilon is preferred due to two reasons:
a. It is evident from contours that the mixing occurs away from the walls, hence k-epsilon gives better results reason being k-omega SST gives better results for interactions at the walls or close to them.
b. On performing simulations with k-omega & epsilon it was noticed that epsilon has lower standard deviation in temperature, hence preferred.