Simple Crank Mechanism for different cases using HYPERWORKS
AIM #1: To simulate the simple crank mechanism using cylinders (diameter = 2m) in a 2D plane (XY) as shown in the figure below.
In the case shown above, Revolute joints are located at P0 and P1.
What type of joint must be given at P2 (Joint C) so that the system doesn't have redundancy issues?
NOTE: Joint C is a type of joint that will perform translational motion only along the X-axis (Basically Joint C is the slider of the crank-slider mechanism)
Also, prove why the joint you have selected will be the ideal joint for the system using DOF calculations, also, what type of joint is this?
Ideally, after you have selected the perfect joint for Joint C to reproduce the desired motion, what will be the final DOF of this system? also, validate with calculations.
SOLUTION #1:
Software: HyperWorks Desktop
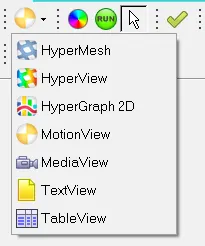
STEP 1: Select MotionView from the list of the dialogue box.
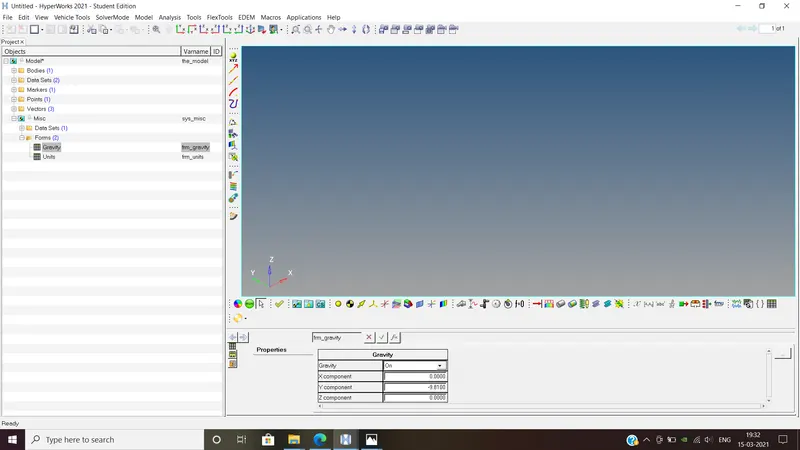
STEP 2: Check whether the gravity effect is enabled and set it to -9.81 m/s2 (negative Y-direction).
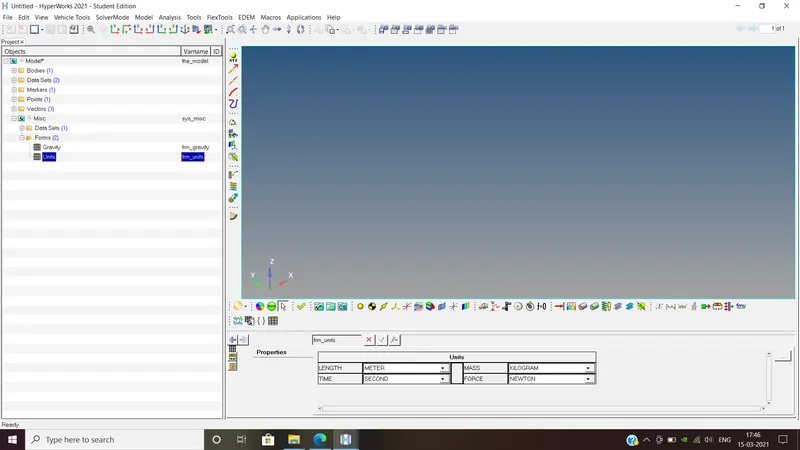
STEP 3: Set up the units for simulation from millimeter to meter as directed in the question.
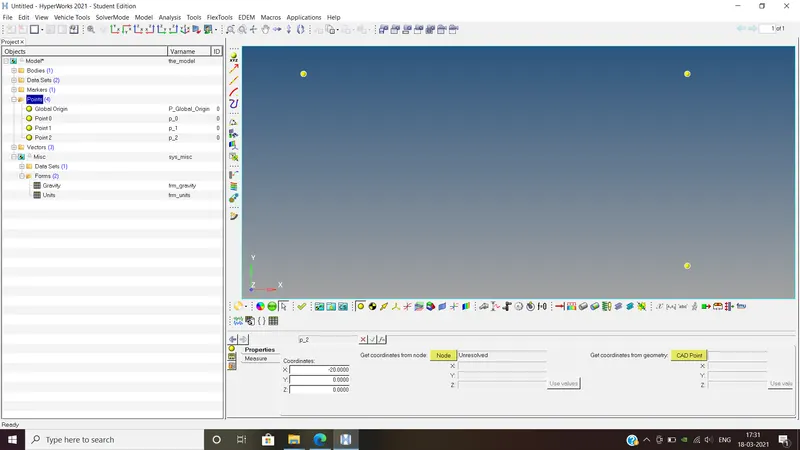
STEP 4: Select the Add Point option as shown and create points Point 0 (0,0,0), Point 1 (0,-10,0) and Point 2 (-20,0,0).
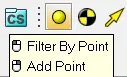
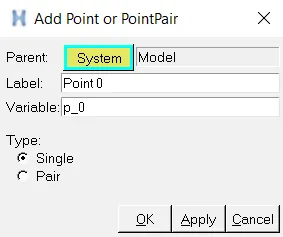
The points are created in the graphic window as shown below. (Click on the screen and press F to fit the screen)
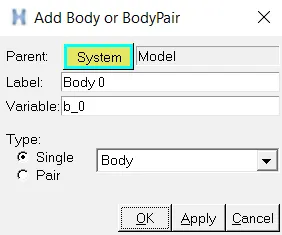
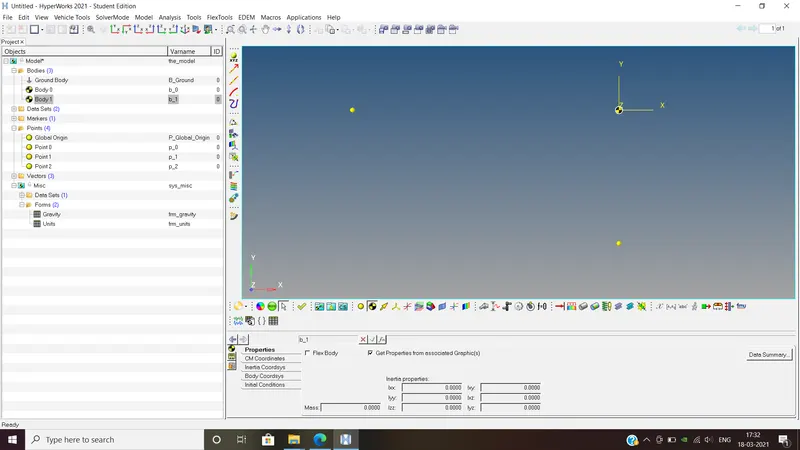
STEP 5: Select the Add Body option as shown and create bodies Body 0 and Body 1. Also tick the Get Properties from associated Graphic(s) to obtain meaningful mass and inertia values.
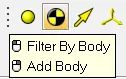
The bodies are created in the graphic window as shown below.
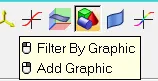
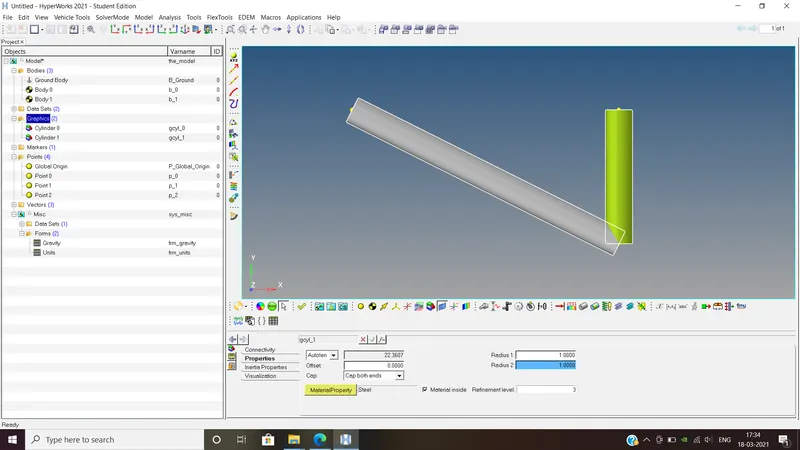
STEP 6: Select the Add Graphics option and add cylinders Cylinder 0 and Cylinder 1.
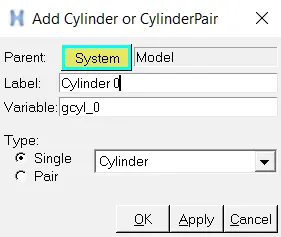
From Connectivity, Cylinder 0 was given Body 0 as parent body with origin as Point 0 and direction as Point 1.
Cylinder 1 was given Body 1 as parent body with origin as Point 1 and direction as Point 2.
From Properties, the radius of the cylinder was set to 1m (since diameter = 2m).
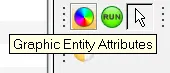
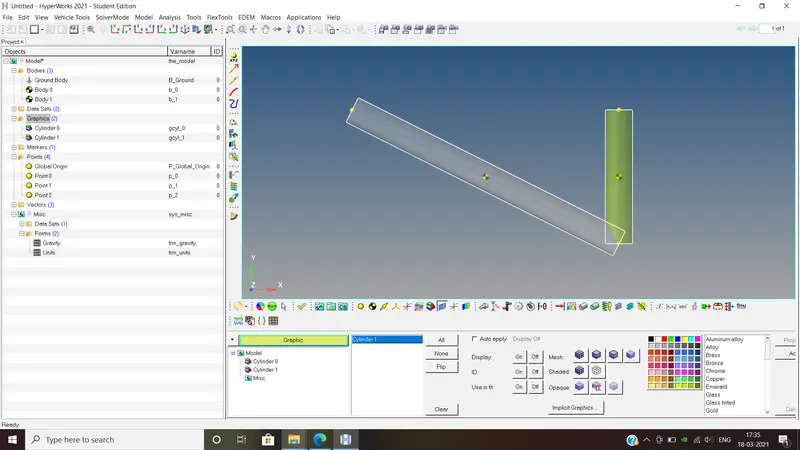
STEP 7: Select the Graphic Entity Attributes option and tick Opaque - Transparent for better visibility.
STEP 8: Select the Add Joint option and add revolute joints Joint 0 and Joint 1.
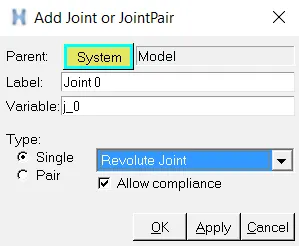
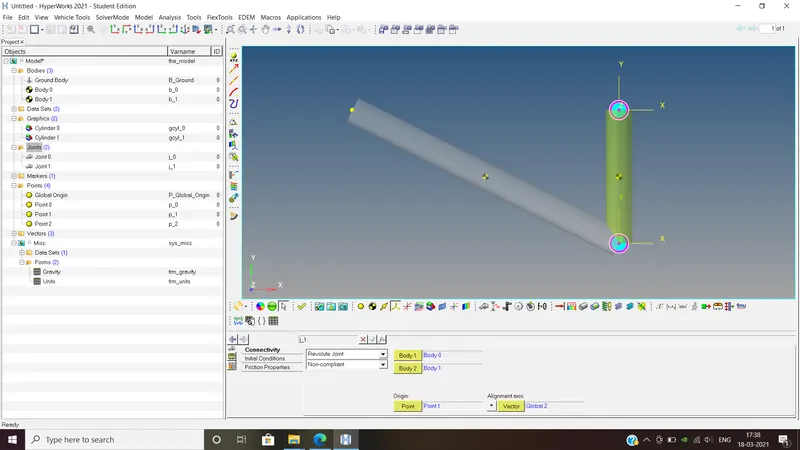
From Connectivity, Joint 0 was given Body 1 as Ground Body and Body 2 as Body 0 with origin being Point 0 and alignment axis vector as Global Z.
Joint 1 was given Body 1 as Body 1 and Body 2 as Body 2 with origin being Point 1 and alignment axis vector as Global Z.
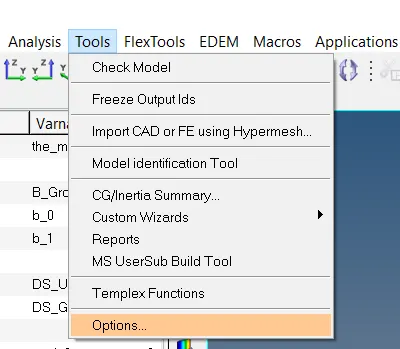
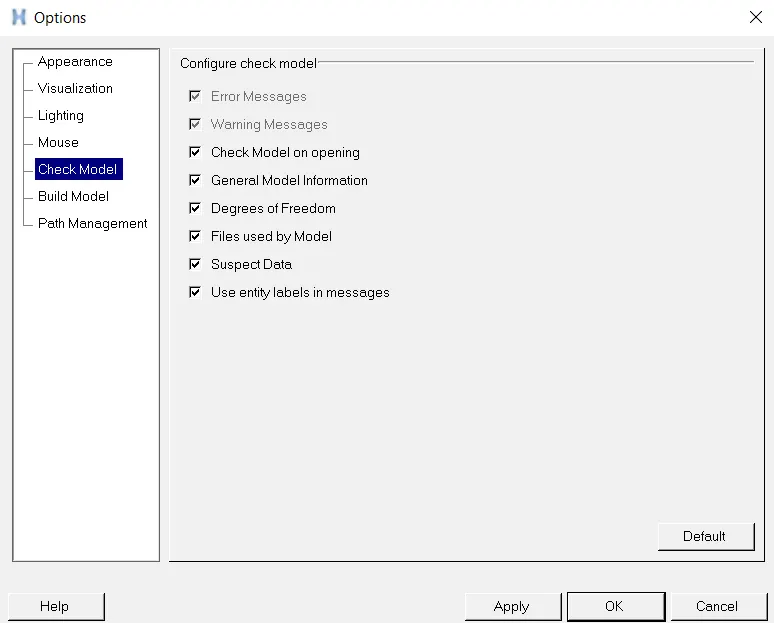
STEP 9: Select Tools - Options - Check Model and tick all the boxes as shown below.
Again go to Tools - Check Model - DOF to check the details of our model.
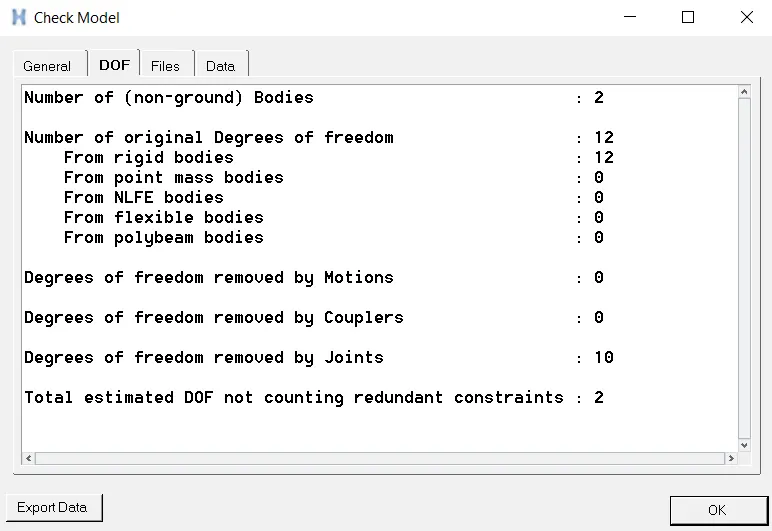
What type of joint must be given at P2 (Joint C) so that the system doesn't have redundancy issues?
Also, prove why the joint you have selected will be the ideal joint for the system using DOF calculations, also, what type of joint is this?
Ideally, after you have selected the perfect joint for Joint C to reproduce the desired motion, what will be the final DOF of this system? also, validate with calculations.
- The inline joint (DOF = 2) restricts the motion in only translation directions thus giving the net DOF of the system as 0. Thus, the system will not have any redundancy issues.
For instance, if we select a revolute joint:
DOF of one rigid body = 6
DOF of two rigid bodies = 6 x 2 = 12 ... (1)
DOF removed by one revolute joint = 5
DOF removed by three revolute joints = 5 x 3 = 15 ... (2)
DOF of the system = (1) - (2) = 12 - 15 = -3
Now, if we select an inline joint:
DOF of one rigid body = 6
DOF of two rigid bodies = 6 x 2 = 12 ... (1)
DOF removed by two revolute joints = 5 x 2 = 10
DOF removed by one inline joint = 2
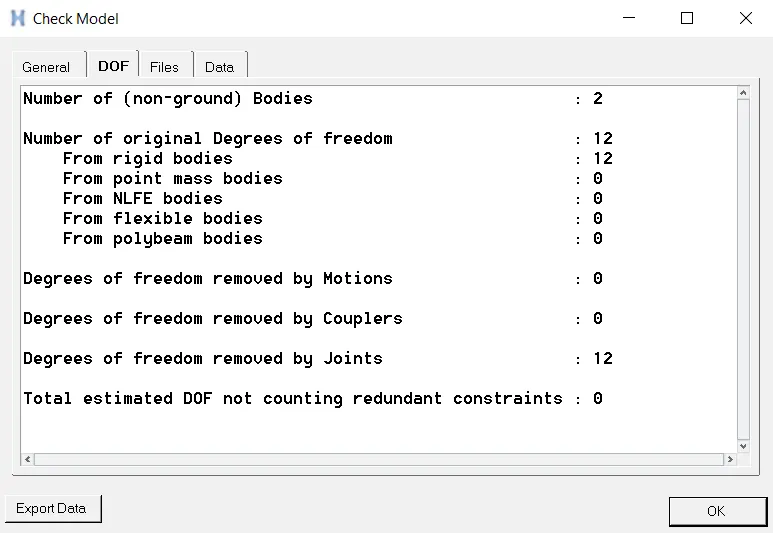
DOF removed by all joints = 10 + 2 = 12 ... (2)
DOF of the system = (1) - (2) = 12 - 12 = 0
Thus, the inline joint selected will be ideal for the system.
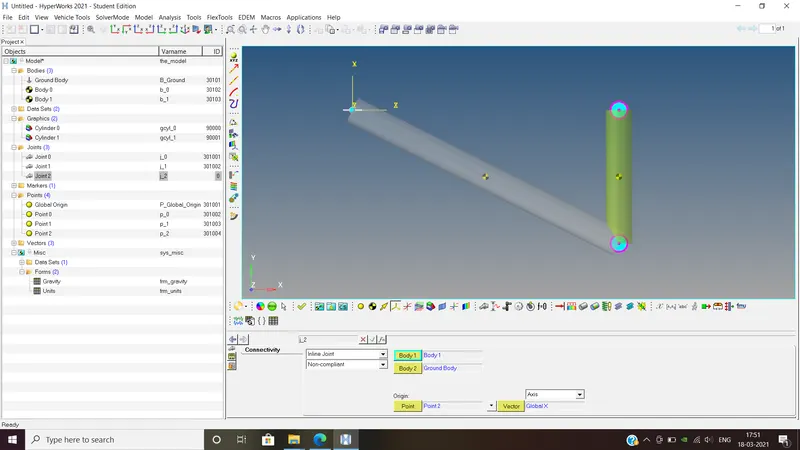
The same is validated with calculations. Go to Tools - Check Model - DOF to check the details of our model.
-------------------------------------------------------------------------------------------------------------------------------------------------
AIM #2: After selecting joint C, simulate the following mechanism with an initial angular velocity at the joint in P0 as 0.5 rad/sec (for mass and inertial properties obtain from associated geometry)
- Now, plot a graph for velocity vs time on Joint C or Point P2 w.r.t the ground.
- Find the maximum velocity of Point P2 w.r.t the ground.
- What is the DOF of the system now and why?
SOLUTION #2:
Software: HyperWorks Desktop
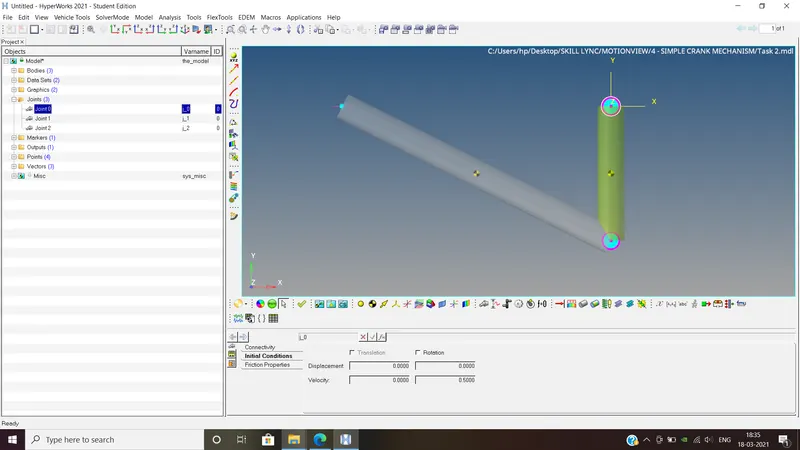
STEP 1: Go to initial conditions of Joint 0 and select rotation and give velocity as 0.5 rad/sec
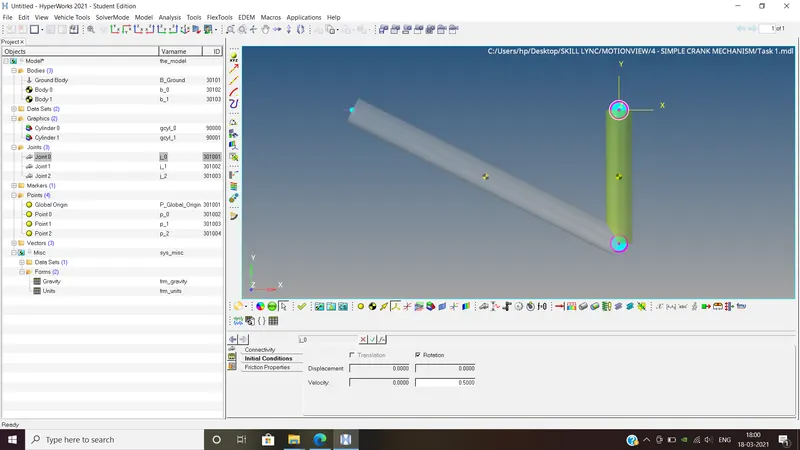
STEP 2: Select the Add Output option and add outputs Output 0 and Output 1.
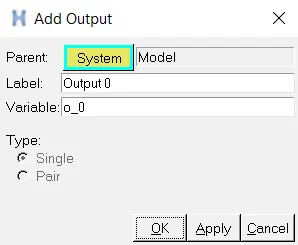
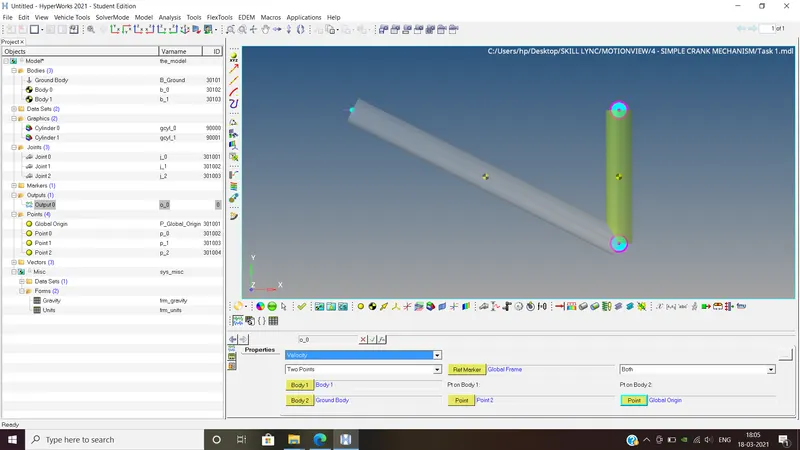
Output 0 was selected as Velocity and given Body 1 as Body 1 and Body 2 as Ground Body with point on Body 1 being Point 2 and point on Body 2 being Global Origin. (as trace of point 2 was to be plotted)
STEP 3: Go to the Run Solver option, set the simulation time as 10 sec. Save the model and then click Run.

STEP 4: The processor MotionSolve runs in the background as follows.
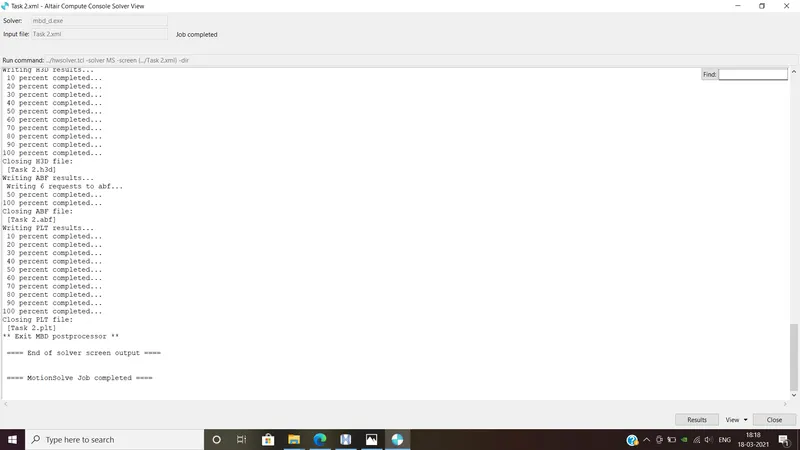
STEP 5: Click the Plot and Animate button and select appropriate parameters to visualize the graphs and simulation.
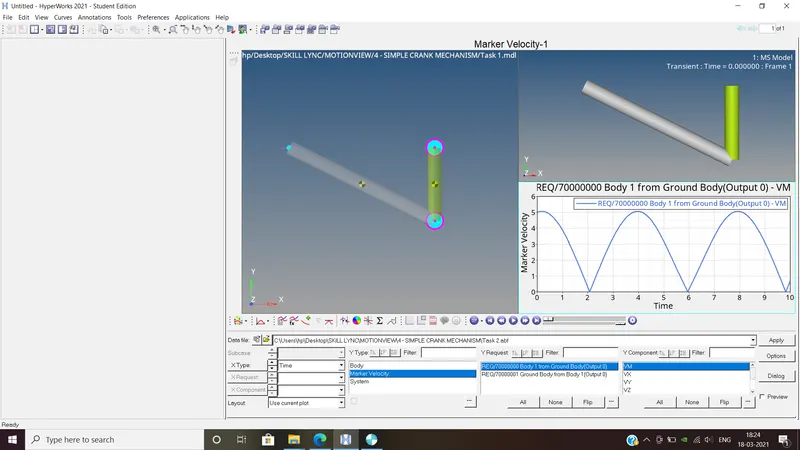
Output: The results are simulated using postprocessors HyperView (top right) and HyperGraph 2D (bottom) as shown below.
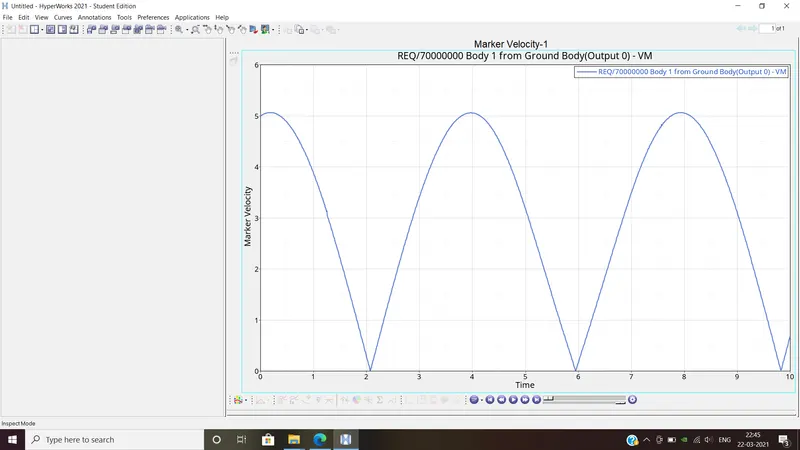
Now, plot a graph for velocity vs time on Joint C or Point P2 w.r.t the ground.
Plot: The plot for velocity vs time on Joint C or Point P2 with respect to the ground is shown below.
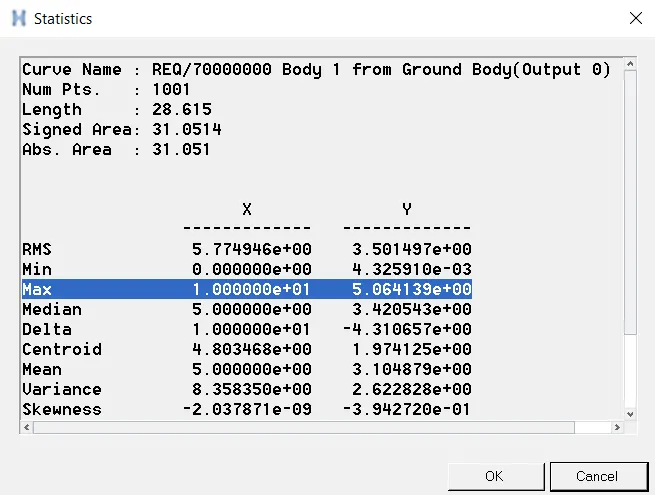
Find the maximum velocity of Point P2 w.r.t the ground.
- Max value is 5.0641 m/sec. To obtain this, go to statistics option to view the details.
What is the DOF of the system now and why?
- The DOF of the systems remains unchanged (i.e. 0) as it depends on the alterations in motions, couplers or joints. By inducing a velocity, the DOF of the system will not get affected.
The same is validated below. Go to Tools - Check Model - DOF to check the details of our model.
-------------------------------------------------------------------------------------------------------------------------------------------------
AIM #3: Now, suppress the initial angular velocity, and apply a load of 1000 KN on P1 and simulate and answer the following questions.
- Now, plot a graph for the reaction torque vs time at P0 and explain your results.
- Compare the range of motion of the crank mechanism between this case and the previous case and explain the reason for the difference if any.
SOLUTION #3:
Software: HyperWorks Desktop
STEP 1: Suppress the initial angular velocity by unticking Rotation from Initial Conditions.
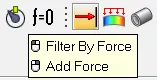
STEP 2: Select the Add Force option as shown and create Force 0.
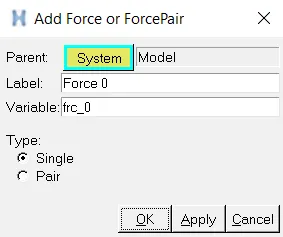
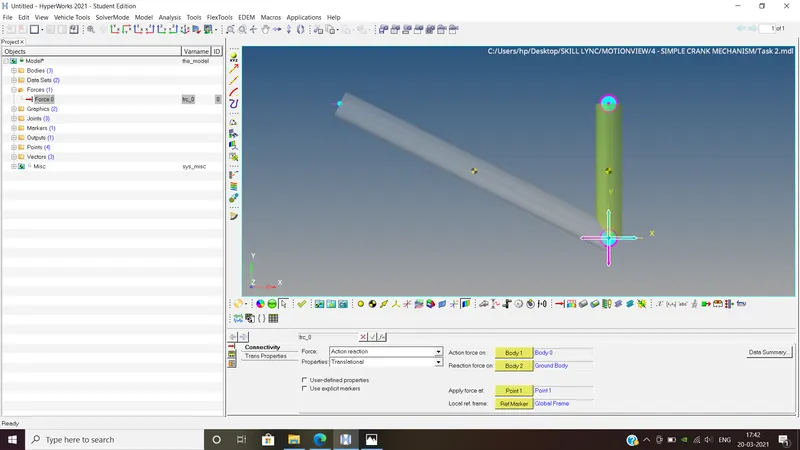
From Connectivity, select force as Action reaction and properties as Translational with Action force on Body 0 while Reaction force on Ground Body, Apply force at Point 1 and Local reference frame as Global Frame.
From Trans Properties, select Fx as Linear and enter 1000 kN i.e. -1.0000e+06 (since the force is applied in negative X direction)
STEP 3: Select the Add Output option and add Output 1.
The VTORQ function returns the component comp of force in VTORQUE/id in the coordinate system of marker rm.
Format: VTORQ (id, jflag, comp, rm)
Arguments:
id: An integer specifying the identification number of the VTORQ.
jflag: An integer flag specifying the VTORQ connectivity marker at which the forces and torques are computed.
0 = forces and moments at the I marker
1 = forces and moment at the J marker
comp: An integer value that specifies the component of the VTORQ force to be returned.
1 = Magnitude of the force (which is zero for a VTORQUE)
2 = x component of the force (which is zero for a VTORQUE)
3 = y component of the force (which is zero for a VTORQUE)
4 = z component of the force (which is zero for a VTORQUE)
5 = Magnitude of the torque
6 = x component of the torque
7 = y component of the torque
8 = z component of the torque
rm: The coordinate system in which the results are expressed. Set rm = 0 if you want the results returned in the global coordinate system.
Output 1 was selected as Expressions and F2 was given as VTORQ({j_1.joint_i.idstring},{0},{5},{0})
Go to Expression Builder (`f_x`) - Force - VTORQ. Then Properties - Joint 1 - Marker I - idstring. Other 3 arguments are 0 (for forces and moments at the I marker), 5 (for magnitude of the torque) and 0 (for global coordinate system)
\
STEP 4: Go to the Run Solver option, set the simulation time as 10 sec. Save the model and then click Run.
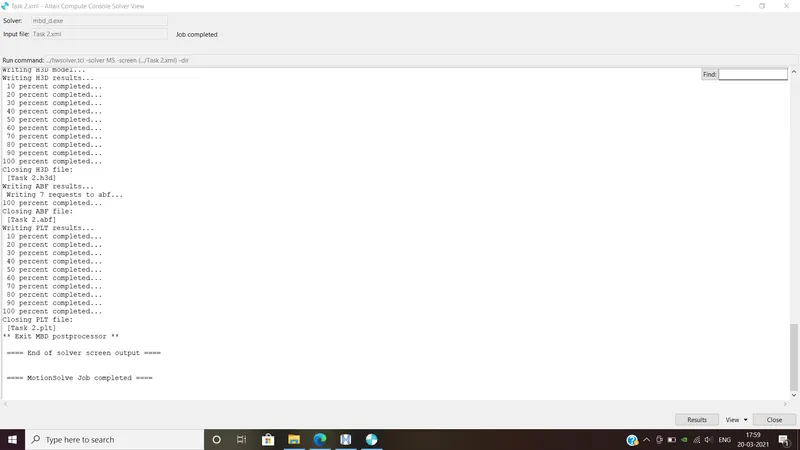
STEP 5: The processor MotionSolve runs in the background as follows.
STEP 6: Click the Plot and Animate button and select appropriate parameters to visualize the graphs and simulation.
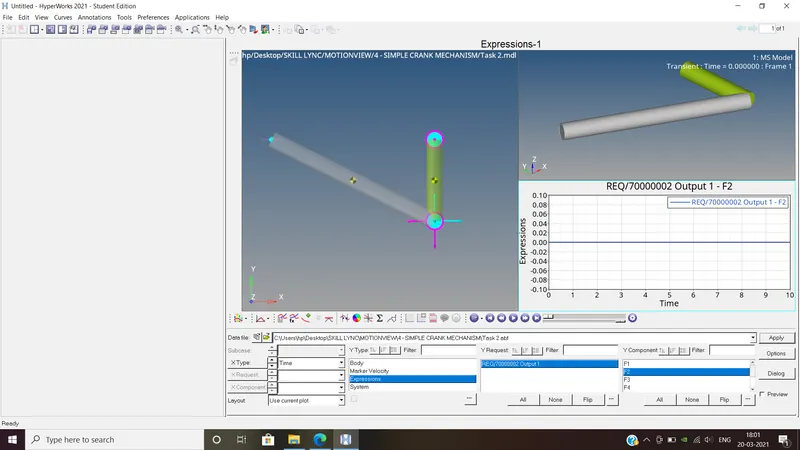
Output: The results are simulated using postprocessors HyperView (top right) and HyperGraph 2D (bottom) as shown below.
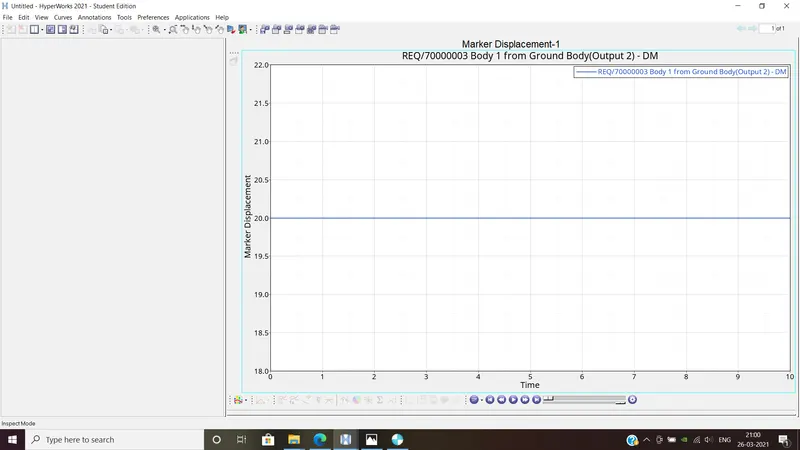
Now, plot a graph for the reaction torque vs time at P0 and explain your results.
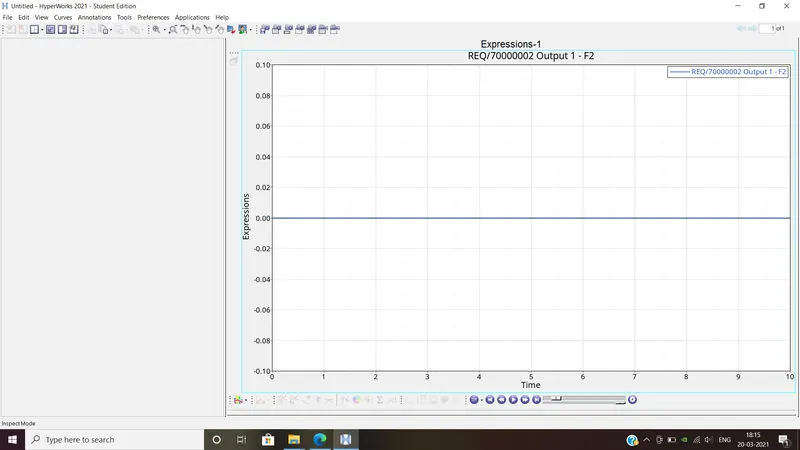
Plot: The plot for reaction torque vs time at P0 is shown below. As there is no action (i.e. torque) acting on P0, no reaction (i.e. opposing torque) is present and thus, we get a flat line.
Compare the range of motion of the crank mechanism between this case and the previous case and explain the reason for the difference if any.
-
CASE 2
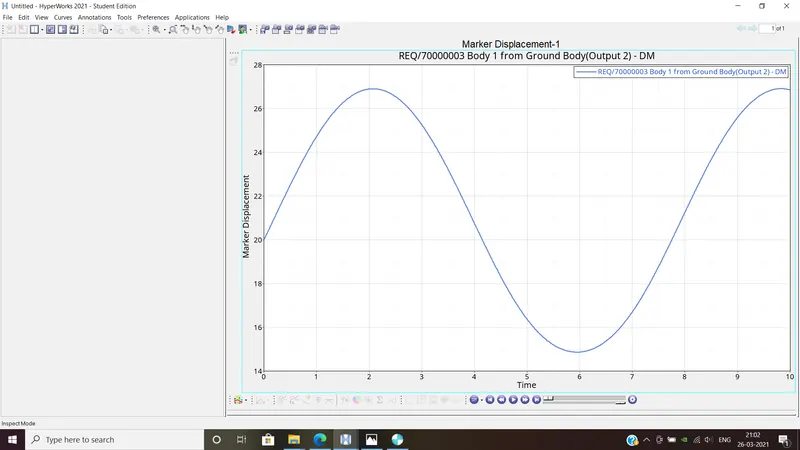
CASE 3
-------------------------------------------------------------------------------------------------------------------------------------------------
AIM #4: Now, in the same case as Question 3 create a BISTOP function at point P0 with range (-10,0) degrees.
Now, again, plot a graph for the reaction torque vs time at P0 and explain your results.
A screenshot of the entire interface must be attached with the plot for all the simulated cases.
SOLUTION #4:
Software: HyperWorks Desktop
STEP 1:
Select the Add Force option as shown and create a force Force 1.
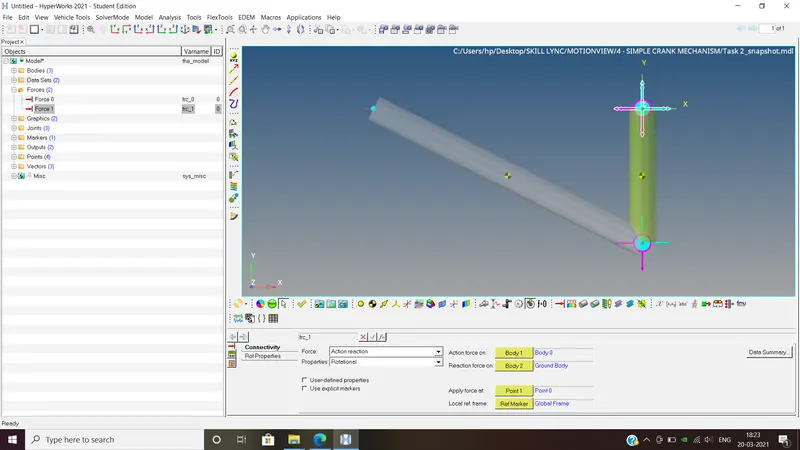
From Connectivity, select force as Action reaction and properties as Rotational with Action force on Body 0 while Reaction force on Ground Body, Apply force at Point 0 and Local reference frame as Global Frame.
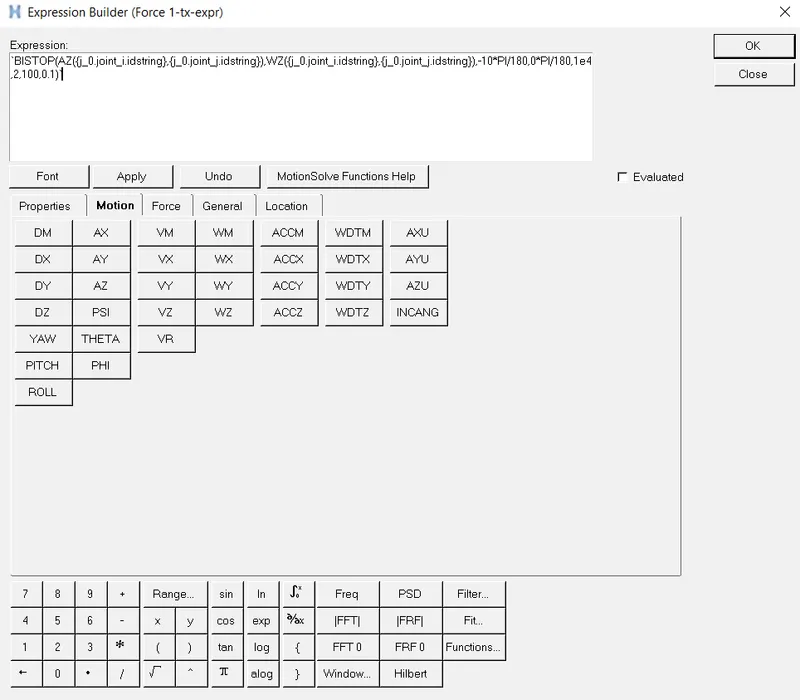
From Rot Properties, select Tx as Expression and F2 was given as BISTOP(AZ({j_0.joint_i.idstring},{j_0.joint_j.idstring}),WZ({j_0.joint_i.idstring},{j_0.joint_j.idstring}),-10*PI/180,0*PI/180,1e4,2,100,0.1)
Go to Expression Builder (`f_x`) - General - BISTOP. Then Motion - AZ and WZ.
Properties - Joint 1 - Marker I - idstring.
Other 3 arguments are 0 (for forces and moments at the I marker), 5 (for magnitude of the torque) and 0 (for global coordinate system)
BISTOP Syntax
BISTOP(AZ({j_0.joint_i.idstring},{j_0.joint_j.idstring}),WZ({j_0.joint_i.idstring},{j_0.joint_j.idstring}),-10*PI/180,0*PI/180,1e4,2,100,0.1)
STEP 2: Select the Add Output option and add Output 1.
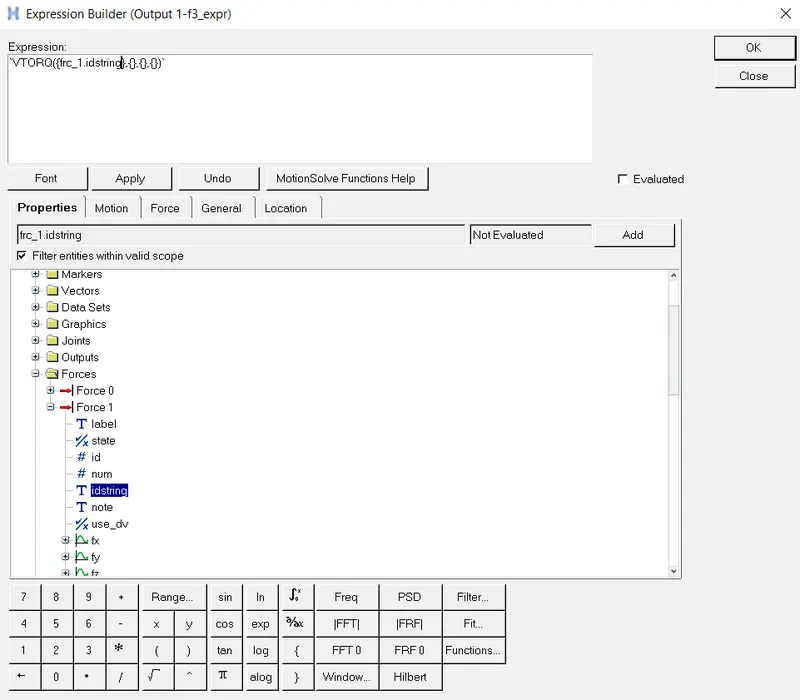
Output 1 was selected as Expressions and F2 was given as VTORQ({frc_1.idstring},{0},{5},{0})
Go to Expression Builder (`f_x`) - Force - VTORQ. Then Properties - Forces - Force 1 - idstring. Other 3 arguments are 0 (for forces and moments at the I marker), 5 (for magnitude of the torque) and 0 (for global coordinate system)
STEP 3: Go to the Run Solver option, set the simulation time as 10 sec. Save the model and then click Run.
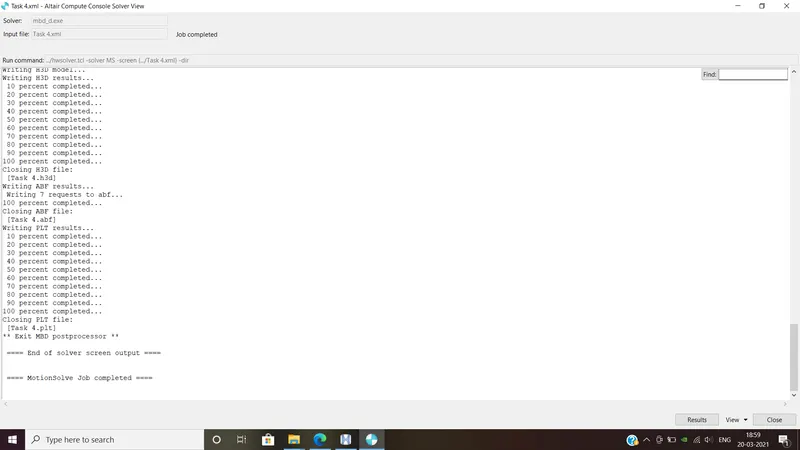
STEP 4: The processor MotionSolve runs in the background as follows.
STEP 5: Click the Plot and Animate button and select appropriate parameters to visualize the graphs and simulation.
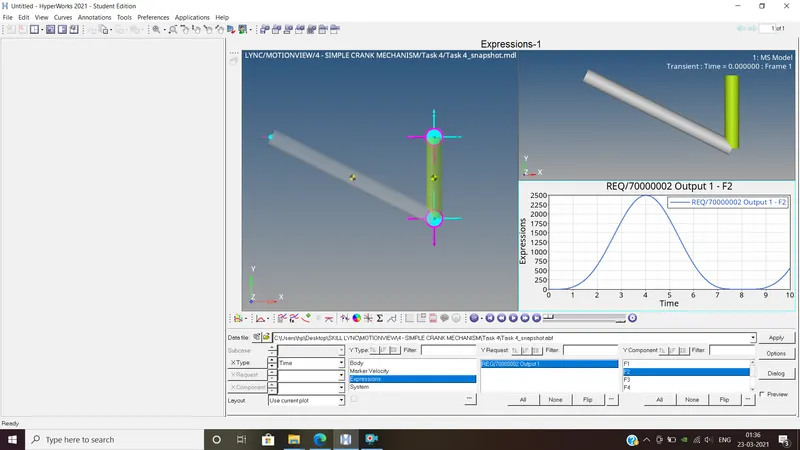
Output: The results are simulated using postprocessors HyperView (top right) and HyperGraph 2D (bottom) as shown below.
Now, again, plot a graph for the reaction torque vs time at P0 and explain your results.
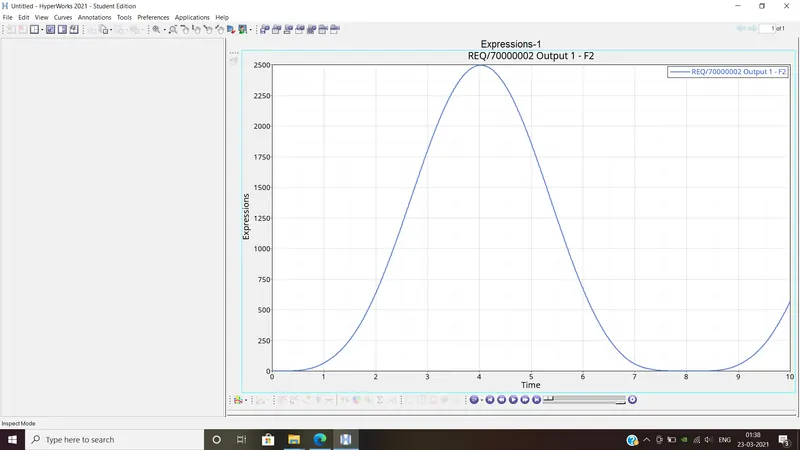
Plot: The plot for reaction torque vs time at P0 is shown below. The reaction torque that occurred due to the BISTOP torque is 2500 N.m at 4 sec.