Week 1: Channel flow simulation using CONVERGE CFD
Aim: Channel flow simulation using CONVERGE CFD
Objective:
The simulation is executed for the three different mesh sizes, and the results are compared for each of them.
Contents to be shown in the report:
1. Velocity and pressure contours for all the 3 base mesh sizes
2. Show mesh (i.e surface with edges) for the 3 base mesh sizes
3. Plots for velocity, pressure, mass flow rate, and total cell count for all 3 base mesh sizes.
4. Explain the plots and write a detailed report on your project.
5. Upload an animation to youtube and attach the link here using the add media option. Explain the development of the flow using the animation.
Introduction
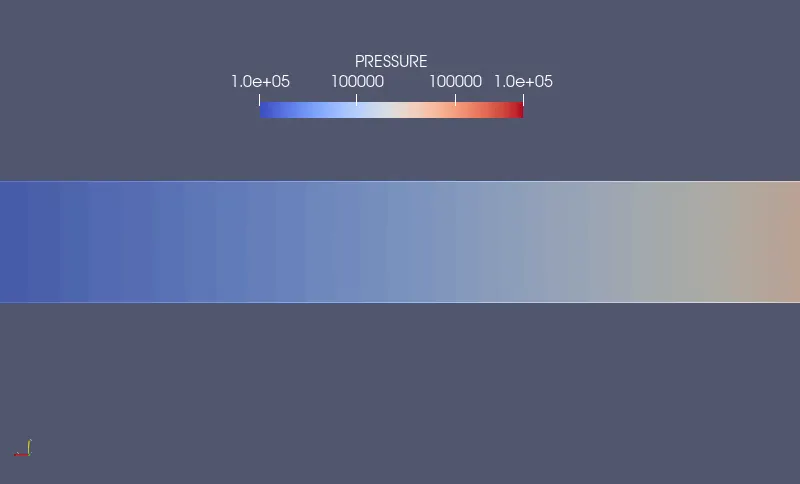
Fluid flow is characterized as internal or external depending on whether the fluid is forced to flow over the surface or in a conduit or duct. The internal flow is driven primarily by the pressure difference calculated between the inlet and outlet of the geometry. The fluid flow is forced to flow through a pump or fan. The pressure difference thus obtained is used for calculating pumping requirements.
The terms pipes, ducts, and conduits are used interchangeably depending upon the type of fluid. The pipe is used when the fluid involved is water, the duct is used when the fluid involved is air. The fluid velocity near the wall is zero and maximum at the center owing to the no-slip condition prevalent near the wall.
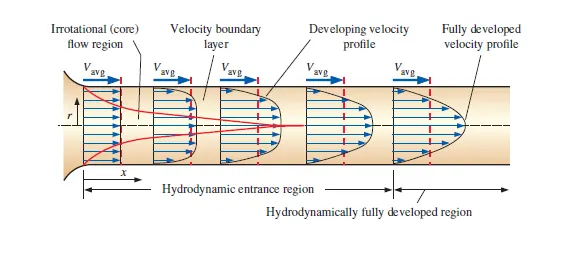
The figure above demonstrating the development of a boundary layer in an internal flow.
Application
They are mainly encountered in propulsion systems, fluid machinery (compressors, turbines, and pumps), heating ventilation, and refrigeration industries.
Case-setup
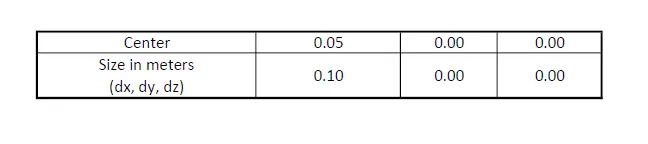
- The model is created by using the converge-CFD software. The dimension and the model are represented as follows
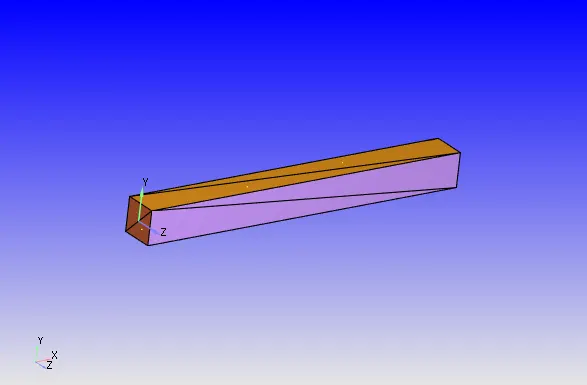
The "Normal Toggle" is selected from the ribbon, upon selecting the normal toggle it was observed that the normal is pointing outside the volume, technically the normal should point inside the volume where the fluid is flowing. Therefore in the geometry dock, the "Transform" option is clicked. The "Normal" tab is selected from the geometry dock and one of the triangles containing the normal pointing outward is selected. The "Apply" option is selected for removing the normals.
The diagnosis dock is selected from the "View" option and the "Find" option is selected. It is found that there is no problem observed in the geometry ("Intersections(0)","Nonmanifold Problems(0)","Open Edges(0)", "Overlapping Tris(0)","Normal Orientation(0)","Isolated tris (0)".
The "Case Setup Dock" is selected from the "View" and "Begin Case Setup" is executed.
The "Time" based "Application" type is selected. The "Material" is selected and the predefined mixture is selected as air. The "Reactant mechanism" is checked off because it is not a combustion problem. The species is selected and the "Apply" is clicked. Under "Gas simulation" the Equation of state is selected as "Redlich Kwong", the critical temperature is 133K and the critical pressure is 3770000Pa. The Turbulent Prandtl number is 0.9 and the Turbulent Schmidt number is 0.78 under Global Transport parameters. The `O_2` and the `N_2` are selected as species. Under "Run parameters" the "Steady-state solver" is selected. The "Temporal type" is locked for the steady-state. The "simulation mode" is selected as "Full Hydrodynamic" because the geometry is simple so while creating the mesh inside the geometry it solves the NS equation as well, but if the geometry is complex "No hydrodynamic solver" is selected as such if there is an error it will point out immediately while creating the mesh, otherwise if the hydrodynamic solver is selected then it will be very tedious to identify the error in the simulation case set up.
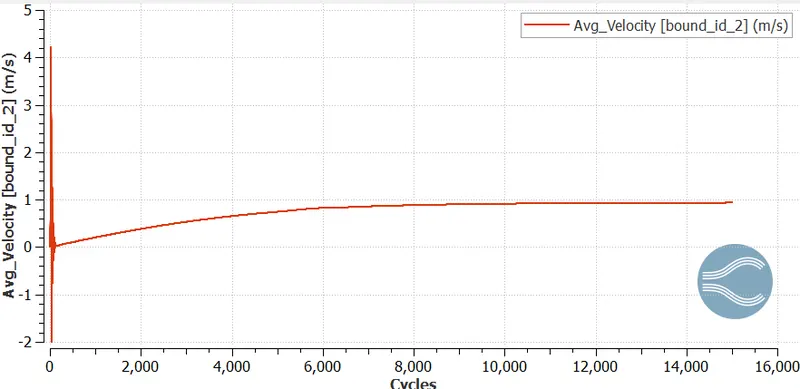
Under "Simulation time parameters" end time is chosen as 15000 cycles (steady-state). The initial and minimum time step is 1e-09 s. The maximum time step is 1s, and the maximum convection CFL limit is 1 and the rest are default values.
The "Pressure" "Equation" is selected under the "Solver parameter" and the "Preconditioner" is selected to "None". The "Maximum convection CFL limit (final stage)" is set to 0.5.
Boundary conditions
The boundary conditions for the different named selection are tabulated below
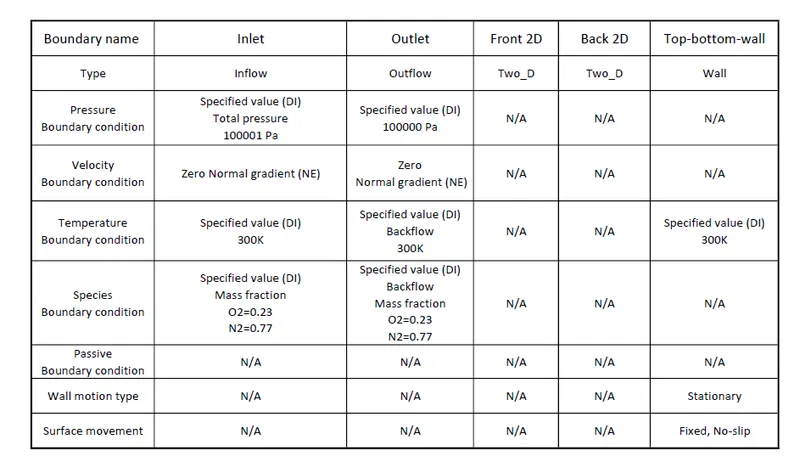
In the "Region and Initialization" the mass fraction of `O_2` and `N_2` were reversed and it was named as "Volumetric Region User Defined" and the same is updated in the boundary condition region name. These are the initial condition and will be washed out after the solution has converged.
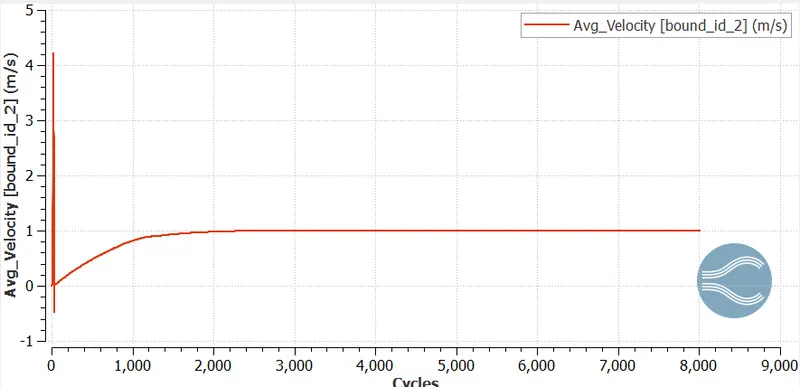
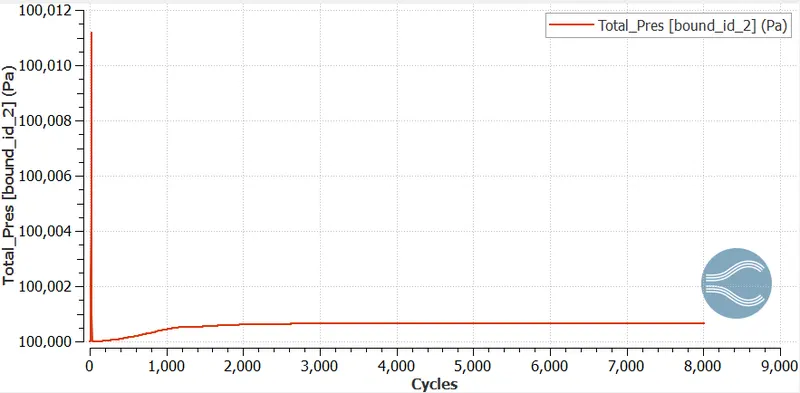
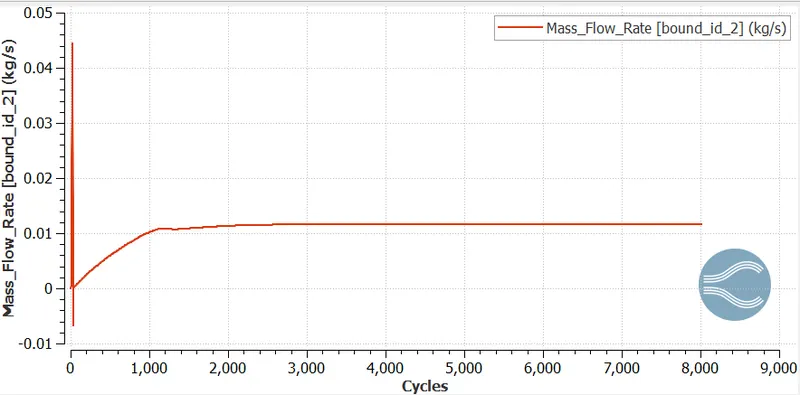
The monitor variables are added in the "Steady-state monitor". Avg Velocity, Total Pressure, Mass flow rate has been added and the target area is selected as output. The minimum number of cycles to be executed for the steady-state solver is 5000 which signifies that the solver will run for a minimum of 5000 cycles if the solution reaches convergence value before 5000, then the simulation will stop at 5000, but if the solution reaches a convergence value after 5000 then it will terminate at that moment. The solver checks the difference in the value of two consecutive sample sizes (1000) and matches it with the tolerance value to stop the solution. The converge-CFD software saves a lot of time and computational energy by tracking the solution when it reaches a steady-state.
The turbulence model is checked off because the flow is laminar.
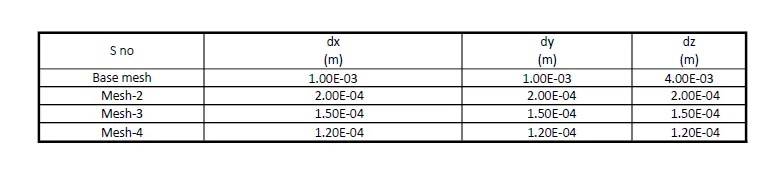
The following values will be computed for the base grid depending on the computational power and the license
The post variable selection involves the selection of "Density", "Temperature", "Mesh Quality", "Velocity" and the Region ID is selected as the location and under species, the mass fraction of `O_2` and `N_2` is selected.
The time interval for writing 3D output data files is 100 cycles which means 150 data files will be produced, and the time interval for writing restarting output is 100.
The folder is created with the specific name to load the input files and mpiexec.exe is copy-pasted into the folder.
The post-processing files are generated by using the command prompt terminal known as "Cygwin".
Important commands used in Cygwin for post-processing the output files
The "cd" command is used for changing the directory. Once the command "cd" is utilized for navigating in the required directory. The simulation is performed by converge executable file, using a parallel processor (2) by using mpiexec.exe which is mpiexec.exe -n 2 "C:\ProgramFiles\Convergent_Science\CONVERGE\3.0.16\bin\intelmpi\converge.exe" restricted </dev/null> logfile &.
The ampersand is used for dumping the output file into the logfile.
In order to print the last ten lines of the output file "tail" command is used
tail -10 logfile.
The output folder contains the files which need to be post-converted by using post_convert_30_msmpi_64 which creates a .vtm group of files which is used for post-processing the results in "Paraview"
cd output
mpiexec.exe -n 2 post_convert_30_msmpi_64
Post-processing
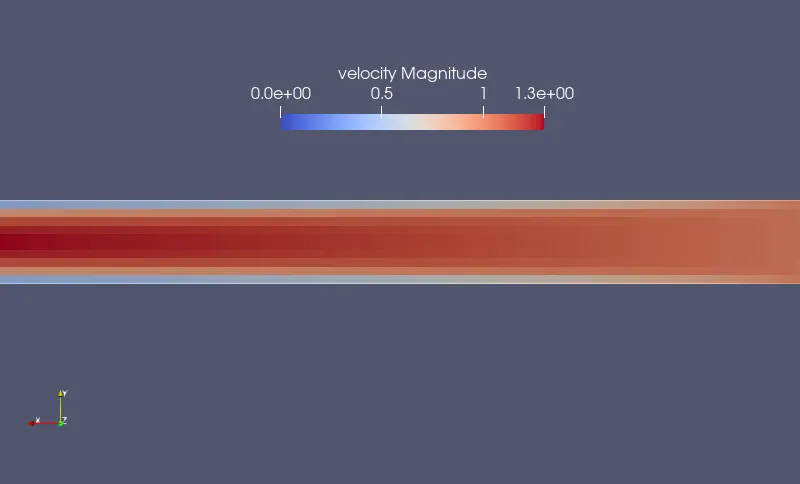
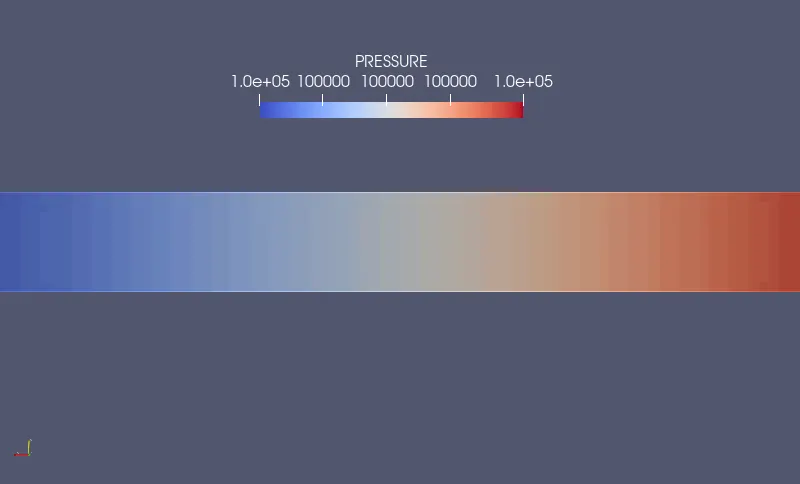
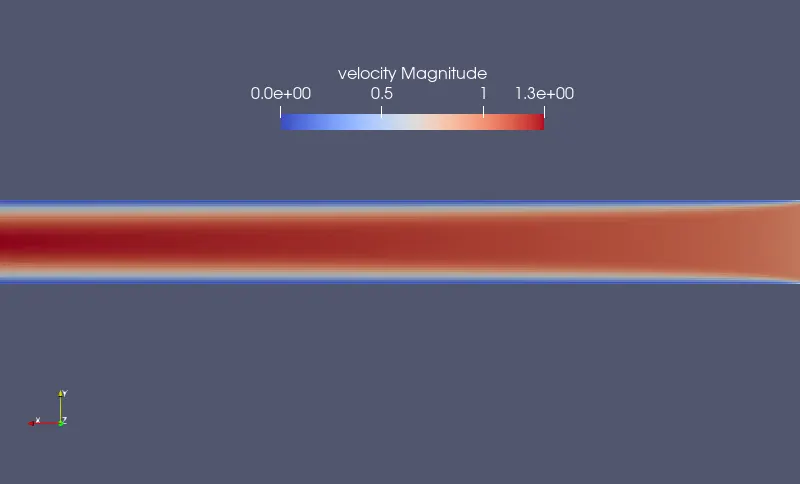
The command used in "Cygwin" generates the ".vtm" group of files in the output folder, the "Paraview" utilizes those group of files to generate the results. The ".vtm" group of files is opened and the slice is made. The Z-normal is selected, the "Triangulate" option is checked off, "Show plane" is checked off. The "Surface with edges" is selected from the "Paraview" ribbon to visualize the mesh. The velocity magnitude contour plot, pressure contour plot are created and their respective animations were saved.
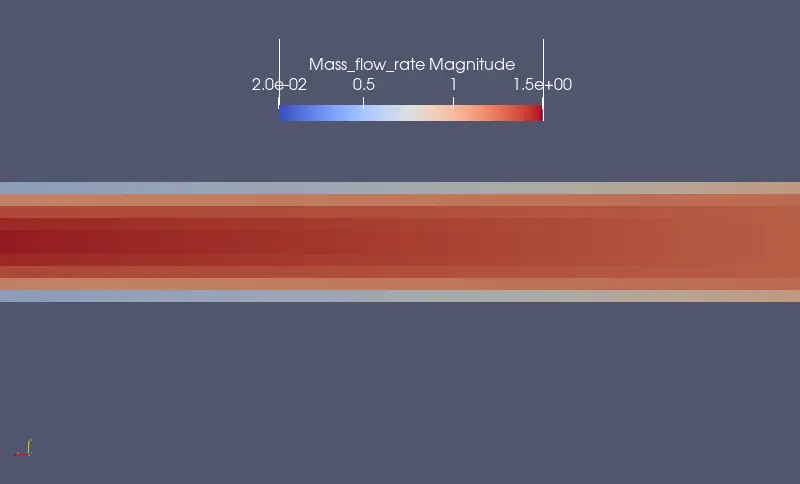
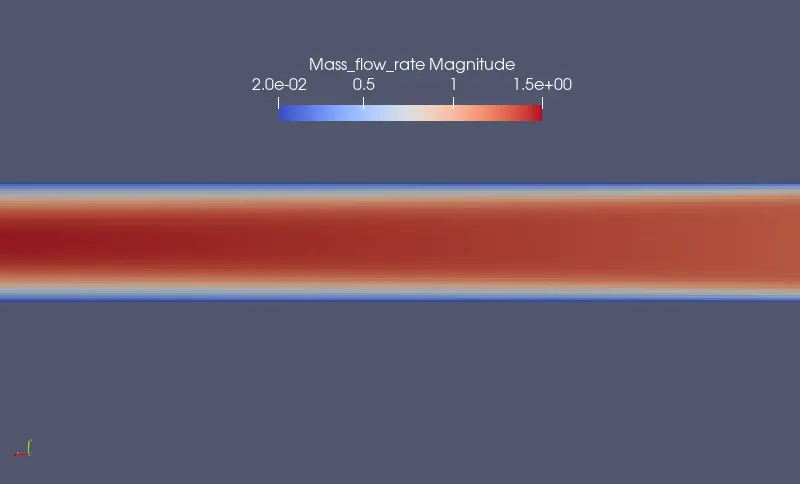
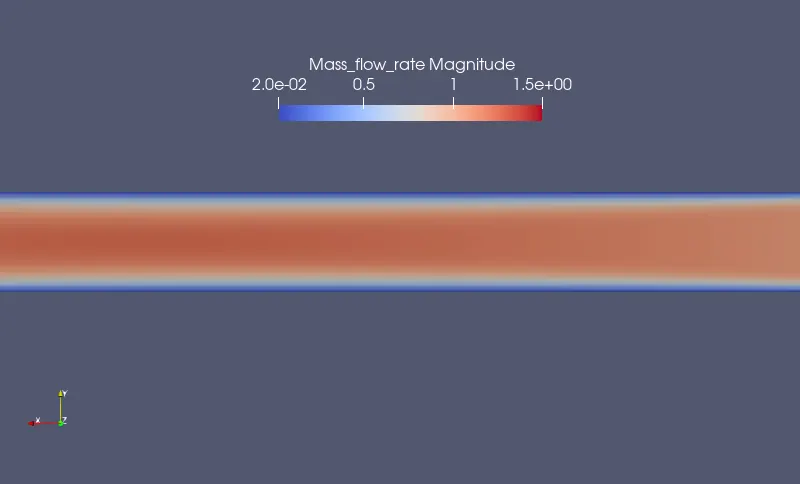
The "Mass flow rate magnitude" is a secondary variable and is dependent upon density and velocity which is further calculated by using the "calculator" option present in the "Filter" ribbon.
The "Plot over line" tool was selected from the ribbon and their variations were observed with the distances along with the domain.
Line probes for velocity

Line probes for mass flow rate
Line probes for pressure

Results
Base mesh
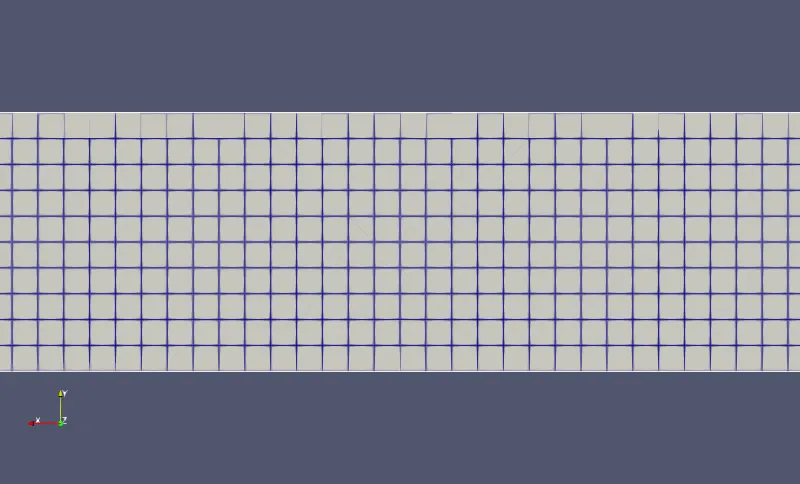
Mesh-first
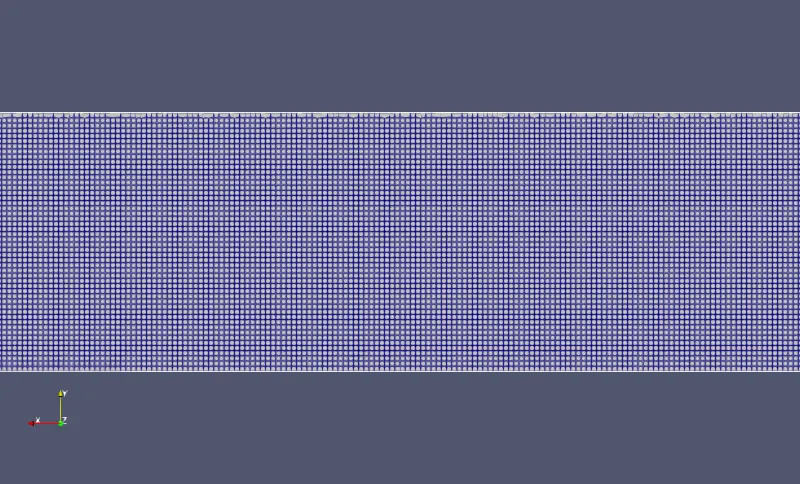
Mesh-second
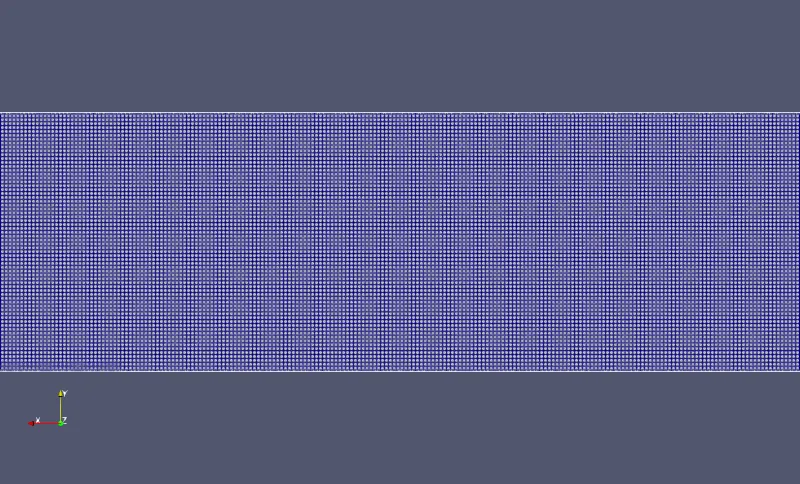
Mesh-third
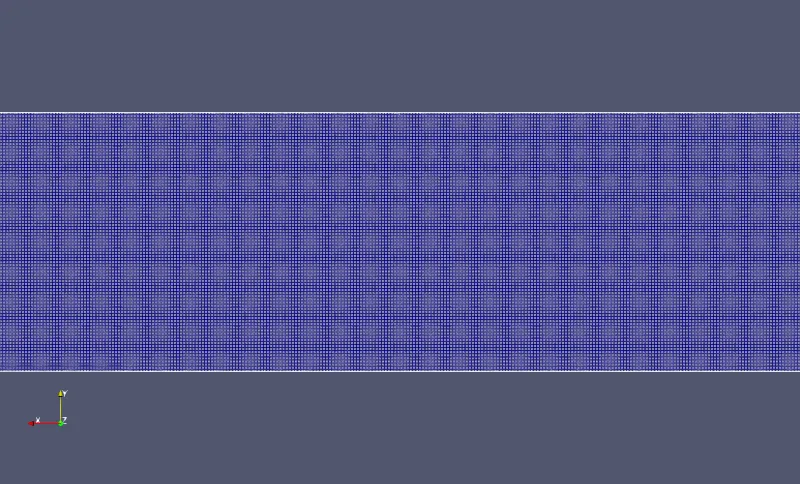
- Contour-plots for base mesh
Velocity
Pressure
Mass flow rate
Velocity at the outlet
Pressure at the outlet
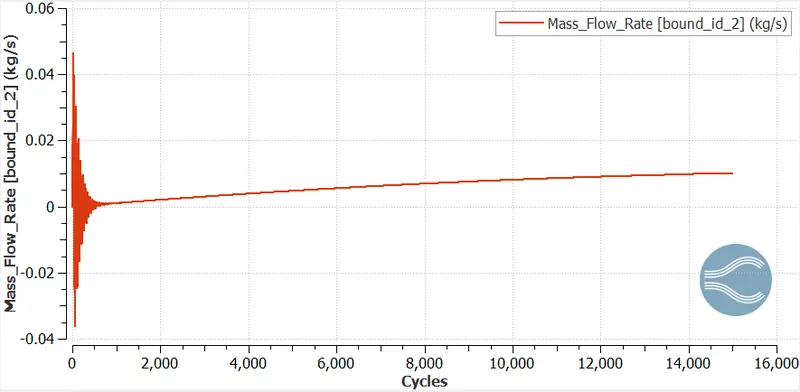
Mass flow rate at the outlet
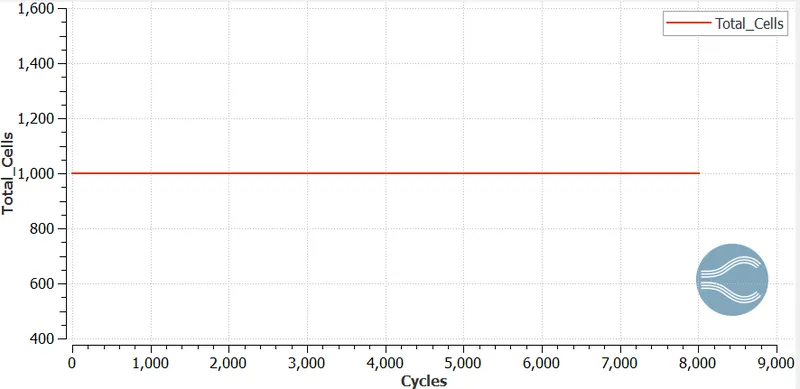
Total cells
Animation file
Velocity
Pressure
Mass flow rate
- Contour-plots for mesh-first
Velocity
Pressure
Mass flow rate
Velocity at the outlet
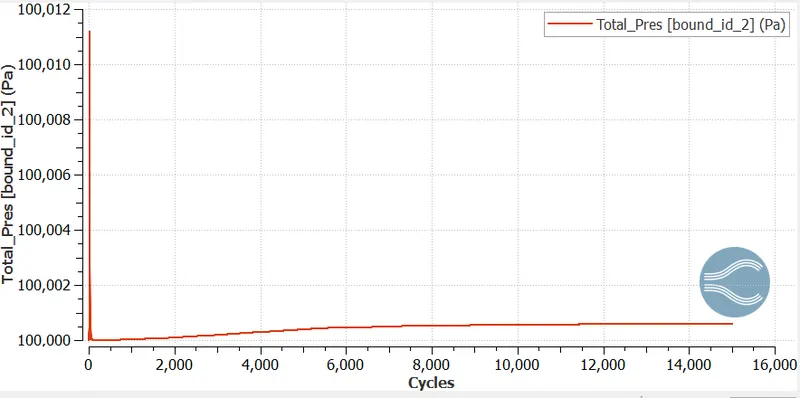
Pressure at the outlet
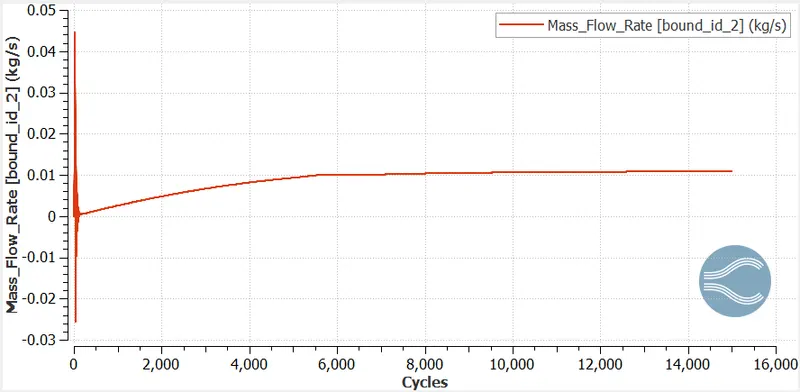
Mass flow rate at the outlet
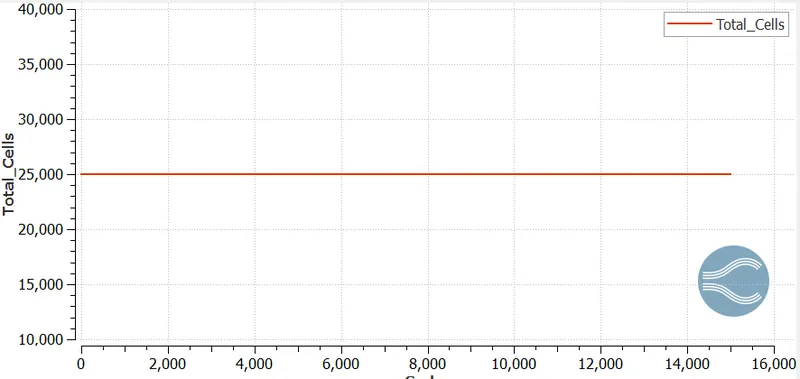
Total cell count
Animation file
Velocity
Pressure
Mass flow rate
- contour plots for mesh-second
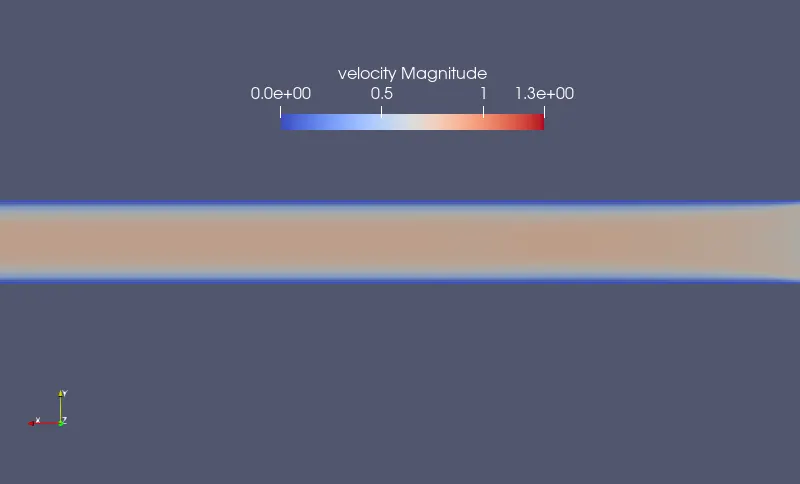
Velocity
Pressure
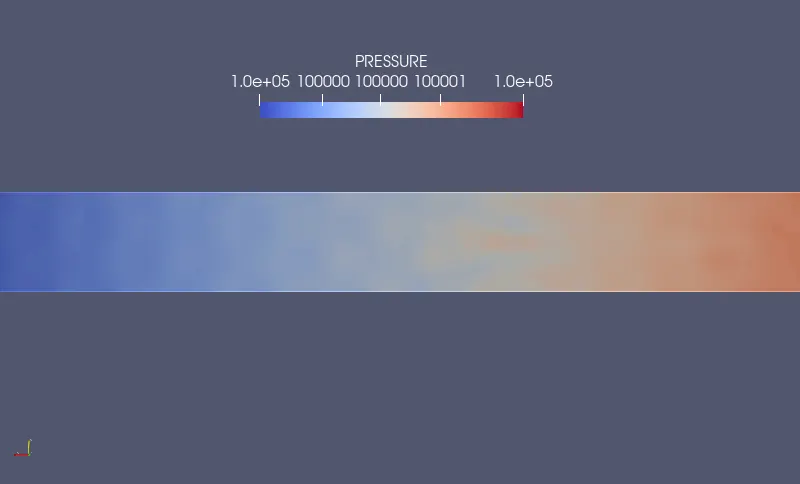
Mass flow rate
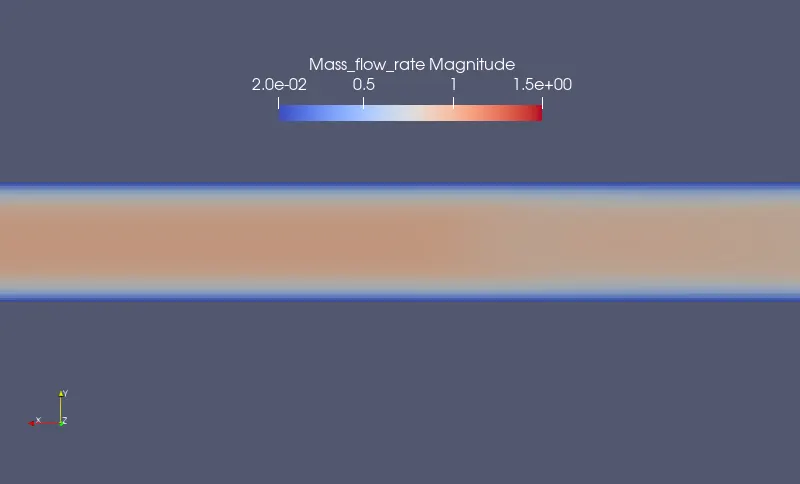
Velocity at the outlet
Pressure at the outlet
Mass flow rate at the outlet
Total cell count
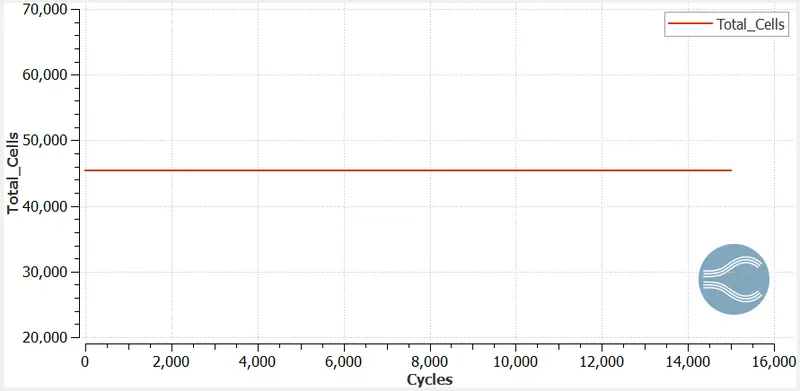
Animation file
Velocity
Pressure
Mass flow rate
- Contour plots for mesh-third
Velocity
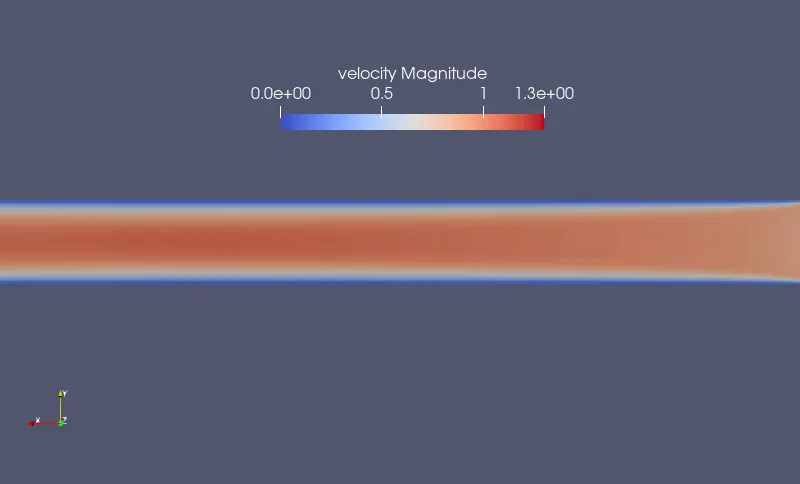
Pressure
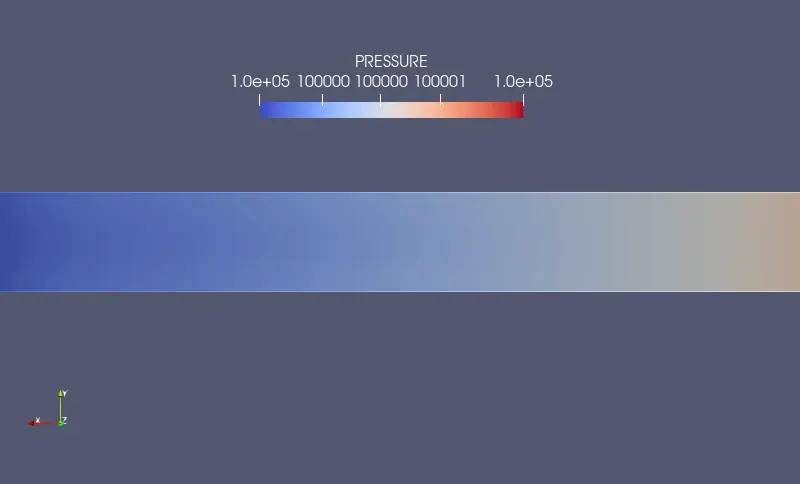
Mass flow rate
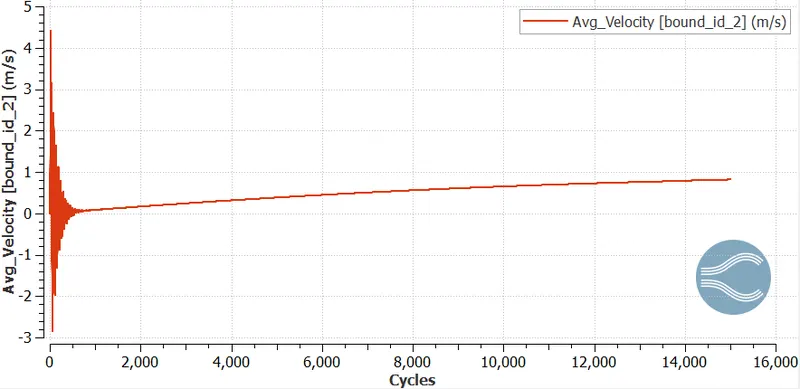
Velocity at the outlet
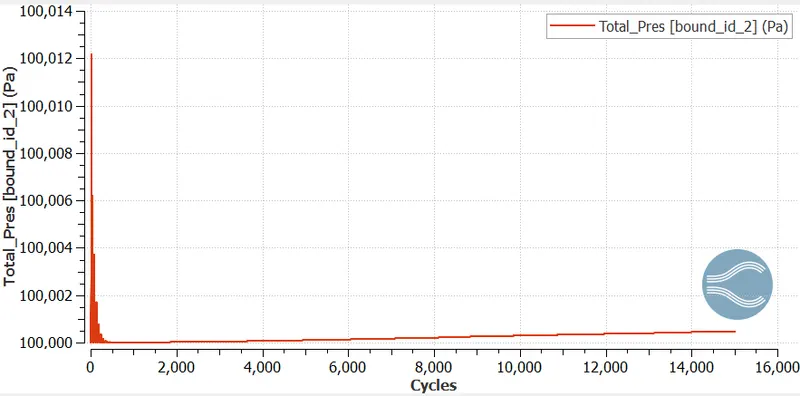
Pressure at the outlet
Mass flow rate at the outlet
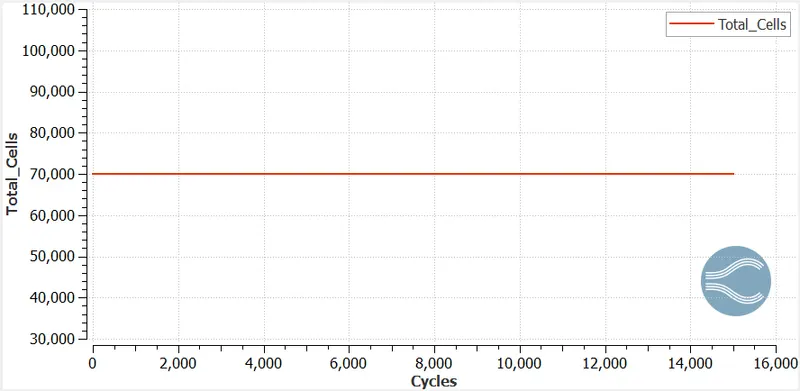
Total cell count
Animation file
Velocity
Pressure
Mass flow rate
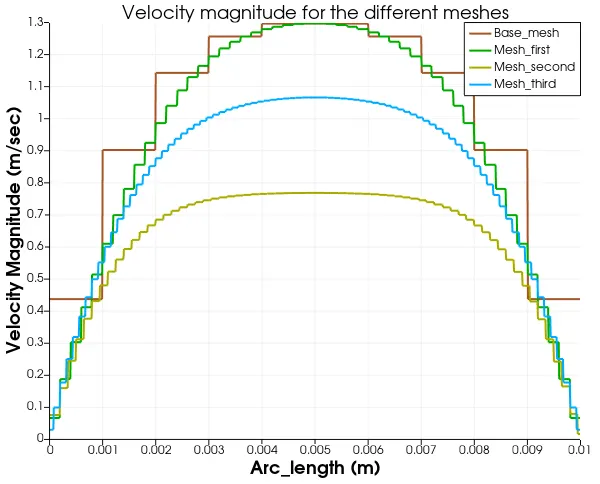
Velocity plot for different mesh size
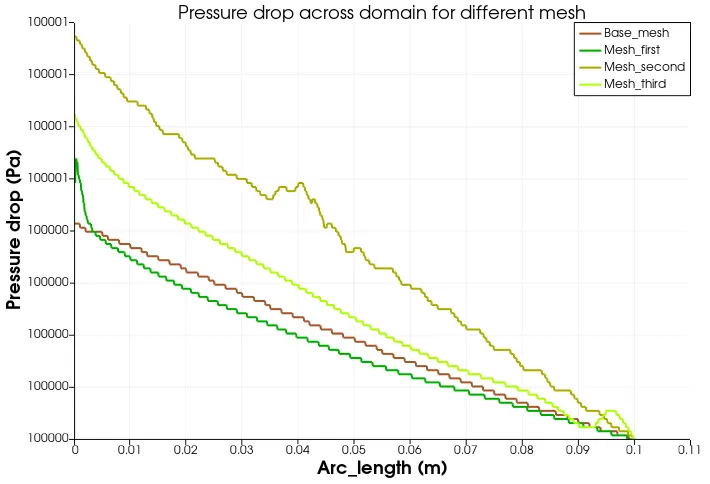
Pressure plot for different mesh size
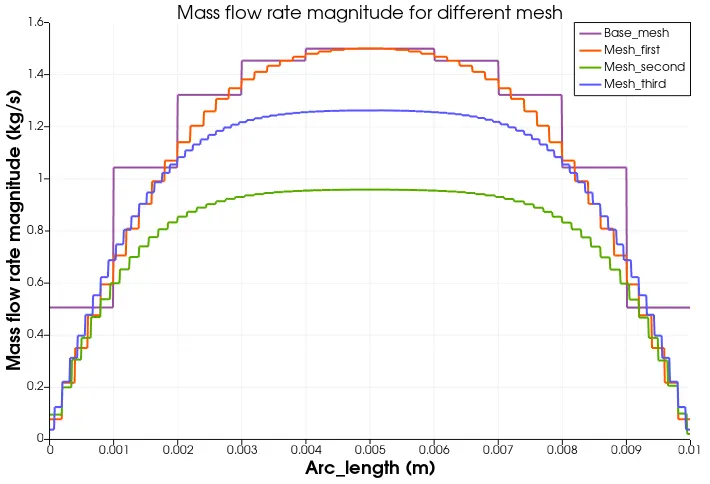
Mass flow rate for different mesh
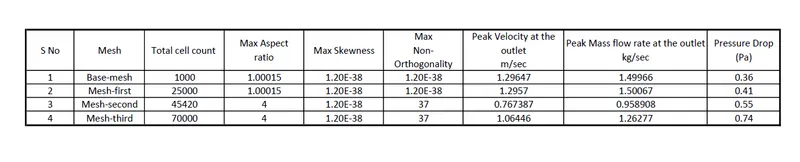
Comparison of all cases
Conclusion
- The steady-state simulation using the laminar viscous model has been performed successfully using Converge-CFD.
- The fluid velocity changes from zero at the wall because of the no-slip condition to its maximum value at the center.
- When the fluid enters the channel, near the wall the velocity of the fluid particle is zero, the velocity of the fluid particle adjacent to it also slows down to the friction, in order to make up this loss the velocity of the fluid at the center of the pipe is maximum. The two different velocity divides the region into two half one is called the boundary layer region where the effect of viscous force is dominant, and the flow region where the effect of viscous forces are negligible. There is no flow in the radial direction. Thus the shape of the velocity profile is parabolic in nature and develops fully starting from the inlet, so the region from the inlet of the channel to the region where the flow is fully developed is called the hydrodynamic entrance region, beyond this region, there is no change in the velocity profile which means the velocity profile has been fully developed and the region is called as the hydrodynamic developed region.
- The mass flow rate depends upon how the velocity of the profile changes through the entire domain of the channel and thus the shape of the profile bears close resemblance to the velocity profile.