To plan a structural layout and to create grids using TSD
1)
Aim :-
The user interface in TSD with the for the following items
Intraduction :-
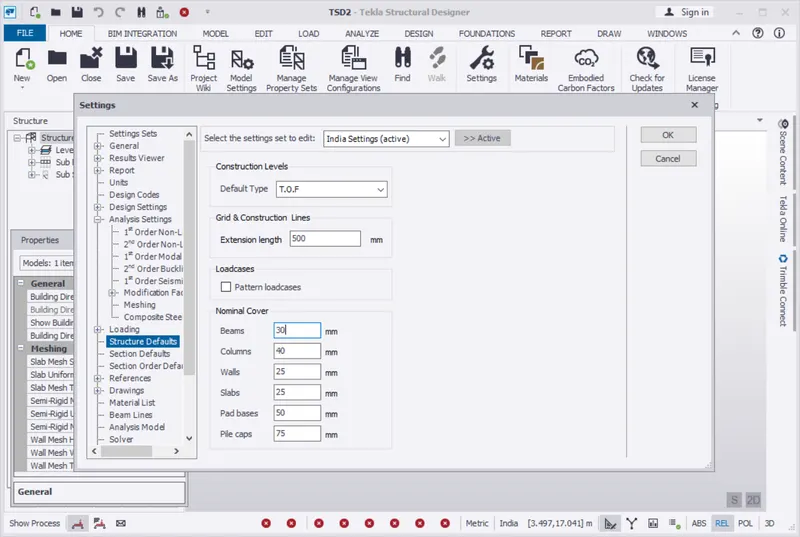
Create a new file in TSD and set up the settings for a steel building to have member grade FE410 and concrete grade of M30 as per IS codes. The covers for the members to be as per the following input
Procedure :-
- Project Workspace – How to access and usage
- First open the tekla software.
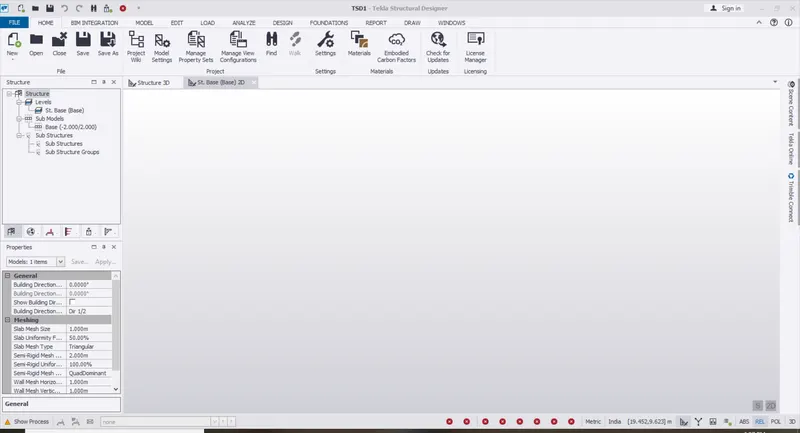
- Next click on the New option, then the project workspace will be visible as shown below.
- Scene Content – Demonstrate the use of scene content
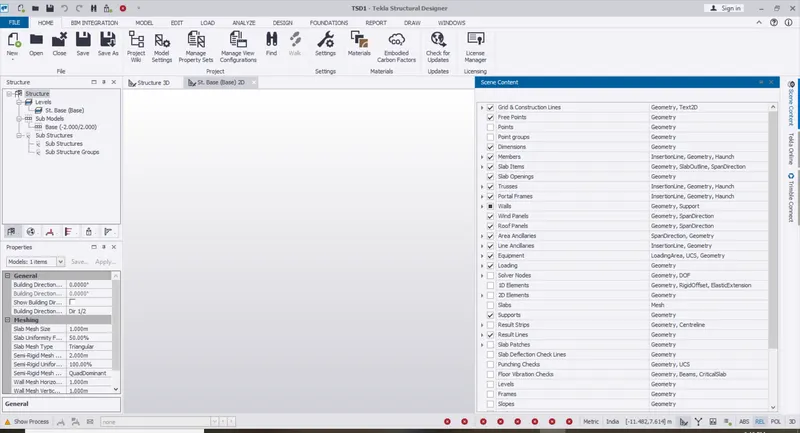
- Now click on the scene content option at the left side of the screen, as shown below.
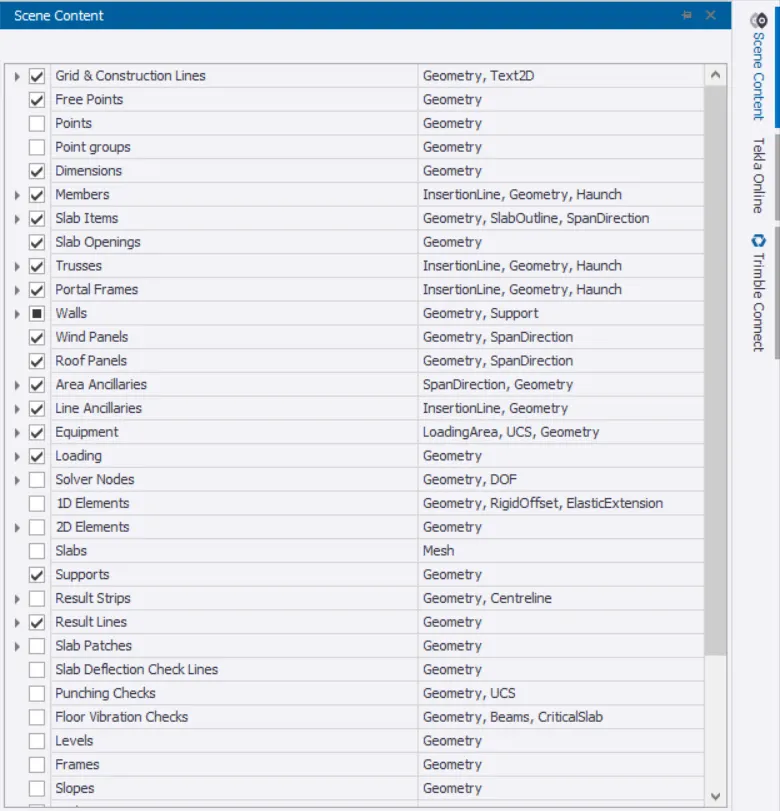
- The use of scene content is, we can enable & disable the elements and that is applied to the model.
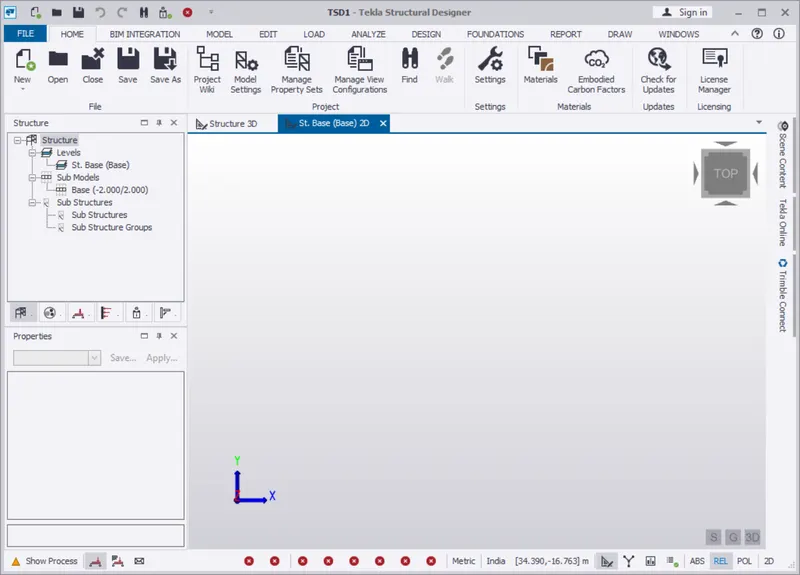
- Create two scene views
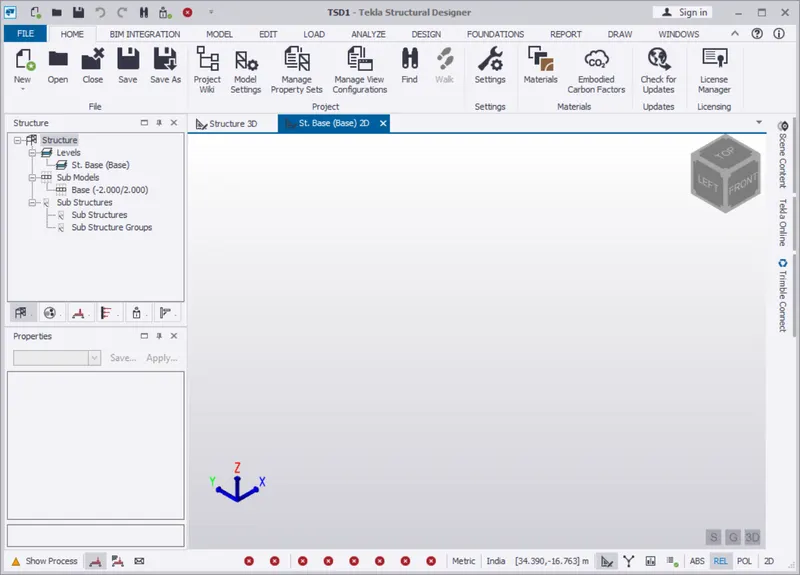
- The two scene views are 2D view and 3D view.
- The 2D & 3D views are viewed, as shown below.
- Loading drop list- How to access
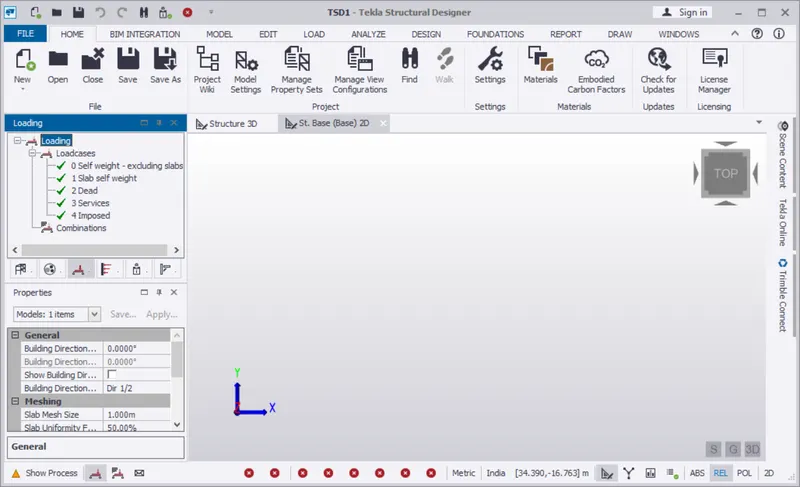
- On the left side of project interface we can see the loading drop list.
- In the loading drop list we can see loadcases and load combinations, as shown below.
- Properties windows – how to access and usage.
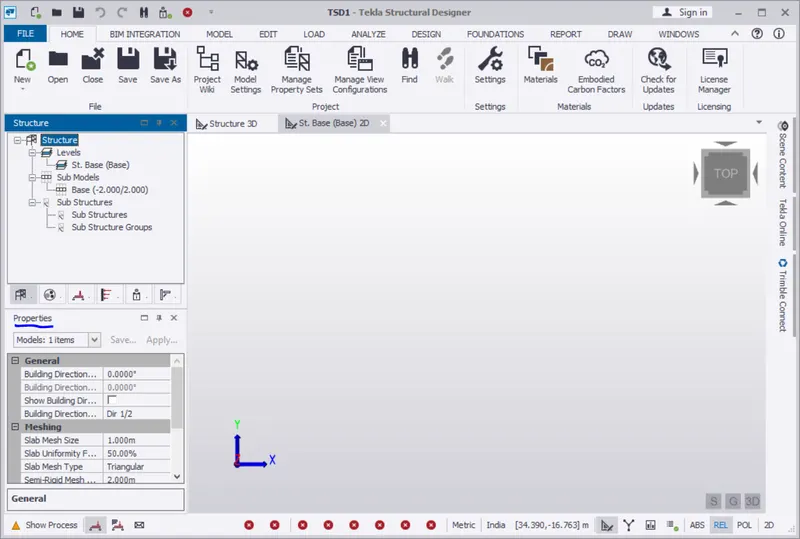
- Open the windows option and select the properties window option.
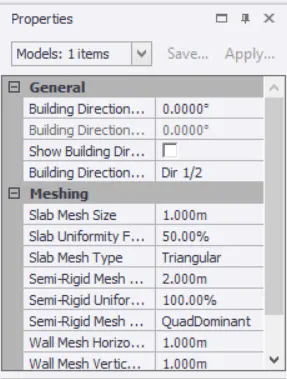
- Then the properties will be visible on the project interface, as shown below.
Open the Tekla software
2. Click on NEW,to create the new window for generating models.
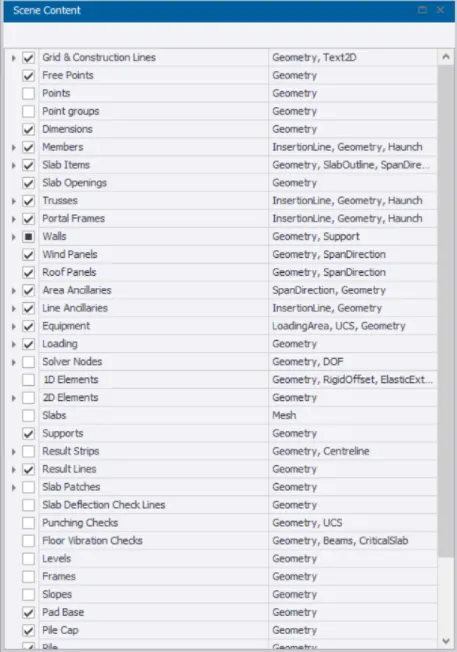
Scene Content- Demonstrate the use of scene content
Go to windows>properties window>Scene content.
It is used for check/uncheck the boxes for selection of materials.
c) Create two scene views:
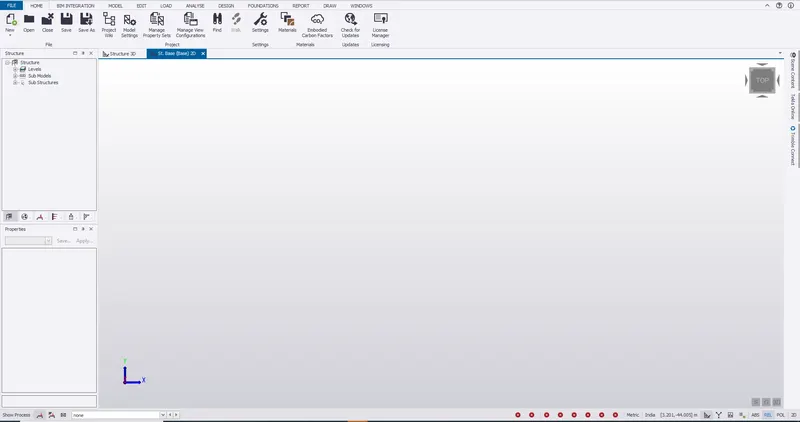
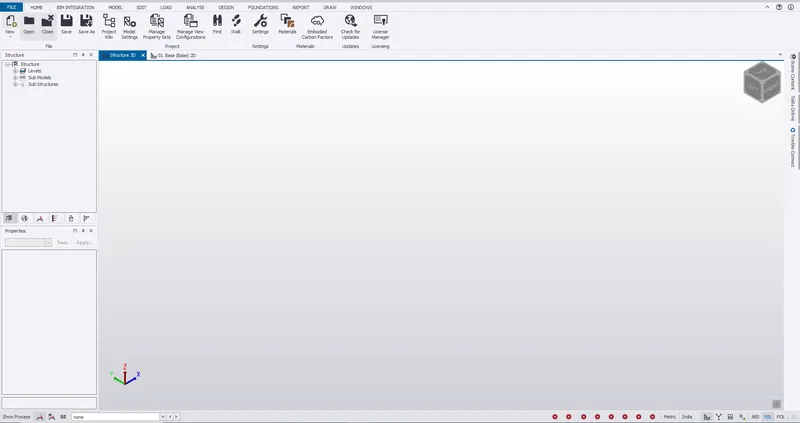
- On new file we get to toggle between 2D and 3D dual screens.
2D view:
3D view:
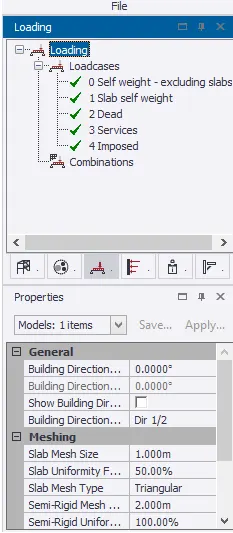
d) Loading drop list- How to access:
1. Go to windows> loading window.
2. Click on project work space> loading
3. Show process for different load cases,load combinations,load patterns.
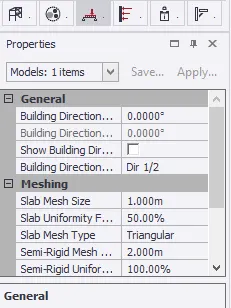
e) Properties windows- how to access and usage
- Go to Windows> properties windows
- It is used to change the properties and for assigning them for different elements of the structure.
Result :-
file in TSD and set up the settings for a steel building to have member grade.The user interface in TSD with the for the following items
2)
Aim :- A new file in TSD and set up the settings for a steel building to have member grade FE410 and concrete grade of M30 as per IS codes. The covers for the members to be as per the following input
Intraduction :-
New file in TSD and set up the settings for a steel building to have member grade FE410 and concrete grade of M30 as per IS codes. The covers for the members to be as per the following input
Procedure :-
First we have to open the tekla software.
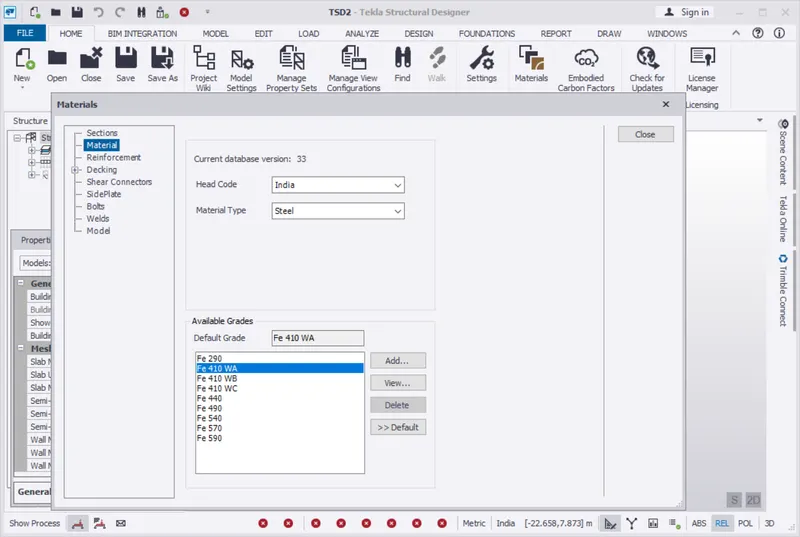
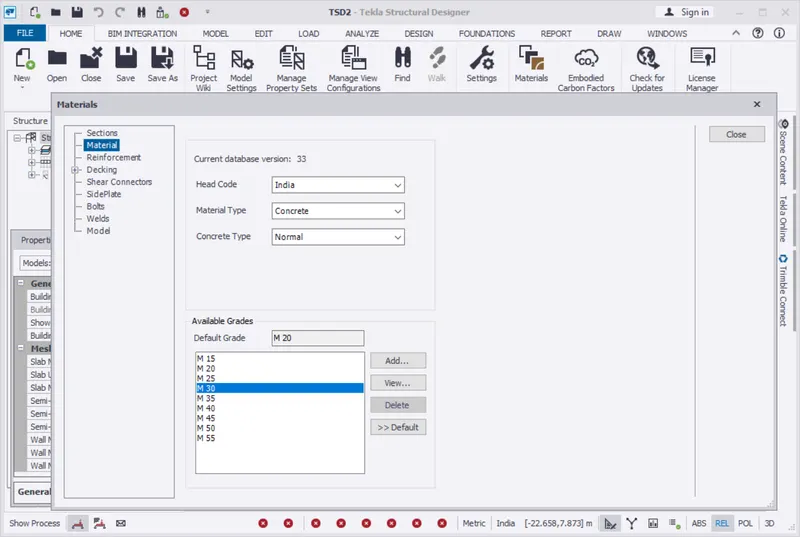
- Next select the materials option and then the materials tab appears.
- In that materials tab and select the steel grade as Fe410 and concrete grade as M30, as shown below.
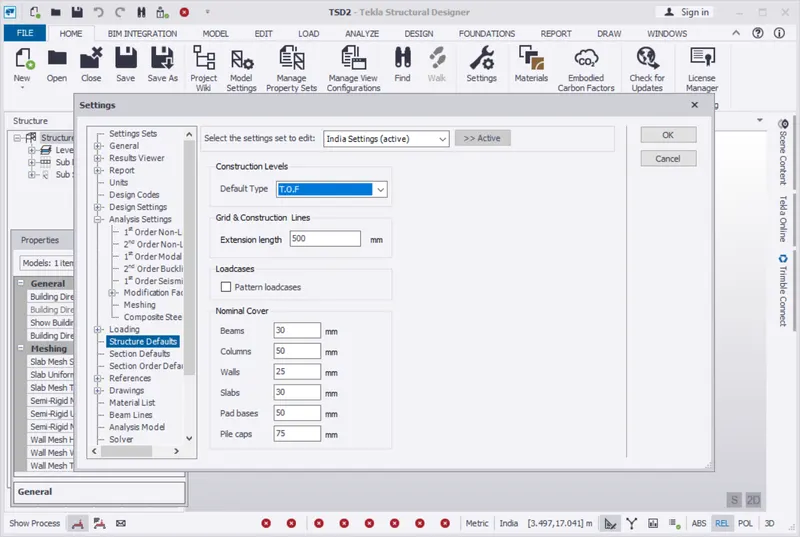
- Next we open the settings and set the nominal covers for given members in contact with ground and above ground, as shown below.
Open the Tekla software
2. Click on NEW,to create the new window for generating models.
Scene Content- Demonstrate the use of scene content
Go to windows>properties window>Scene content.
It is used for check/uncheck the boxes for selection of materials.
c) Create two scene views:
- On new file we get to toggle between 2D and 3D dual screens.
2D view:
3D view:
d) Loading drop list- How to access:
1. Go to windows> loading window.
2. Click on project work space> loading
3. Show process for different load cases,load combinations,load patterns.
e) Properties windows- how to access and usage
- Go to Windows> properties windows
- It is used to change the properties and for assigning them for different elements of the structure.
Result :-
It is used to change the properties and for assigning them for different elements of the structure.TSD and set up the settings for a steel building to have member grade FE410 and concrete grade of M30 as per IS codes
3)
Aim :-
The input drawing as per Attachment 1, 1.1, and 1.2 and study the steel building plan and summarize your understanding of the plan. Based on your study assume and explain the location of columns and beam and develop a hand sketch for each plan
Intraduction :-
The steel building plan and summarize your understanding of the plan. Based on your study assume and explain the location of columns and beam and develop a hand sketch for each plan
Procedure :-
Conventional Practices for Orthographic and Sectional Views (Full and Half Section)
2. Conventional Practices for Orthographic and Sectional Views (Other Type Sections)
3. Isometric Drawing
4. Isometric Drawing (Consisting of Curved Surfaces and Sections
5. Oblique Drawing
6. Perspective Projection
7. Familiarization with Graphical Symbols (Limit, Fit, Tolerances and Surface Roughness Symbols)
8. Familiarization with Graphical Symbols (Symbols for Different Engineering Fields)
9. Detail Drawing
Basic Concepts
The moment distribution method of analysis of beams and frames was developed by Hardy Cross and formally presented in 1930. Although this method is a deformation method like the slope-deflection method, it is an approximate method and, thus, does not require solving simultaneous equations, as was the case with the latter method. The degree of accuracy of the results obtained by the method of moment distribution depends on the number of successive approximations or the iteration process.
To illustrate the concept of the method of moment distribution, consider the frame shown in Figure 12.1. Members of the frame are prismatic and are assumed not to deform axially nor translate relative to one another. Joints ACD of the frame are fixed, while joint B can rotate slightly due to the applied load. First, before carrying out moment distribution among members, all the joints are assumed to be temporarily locked using a clamp.
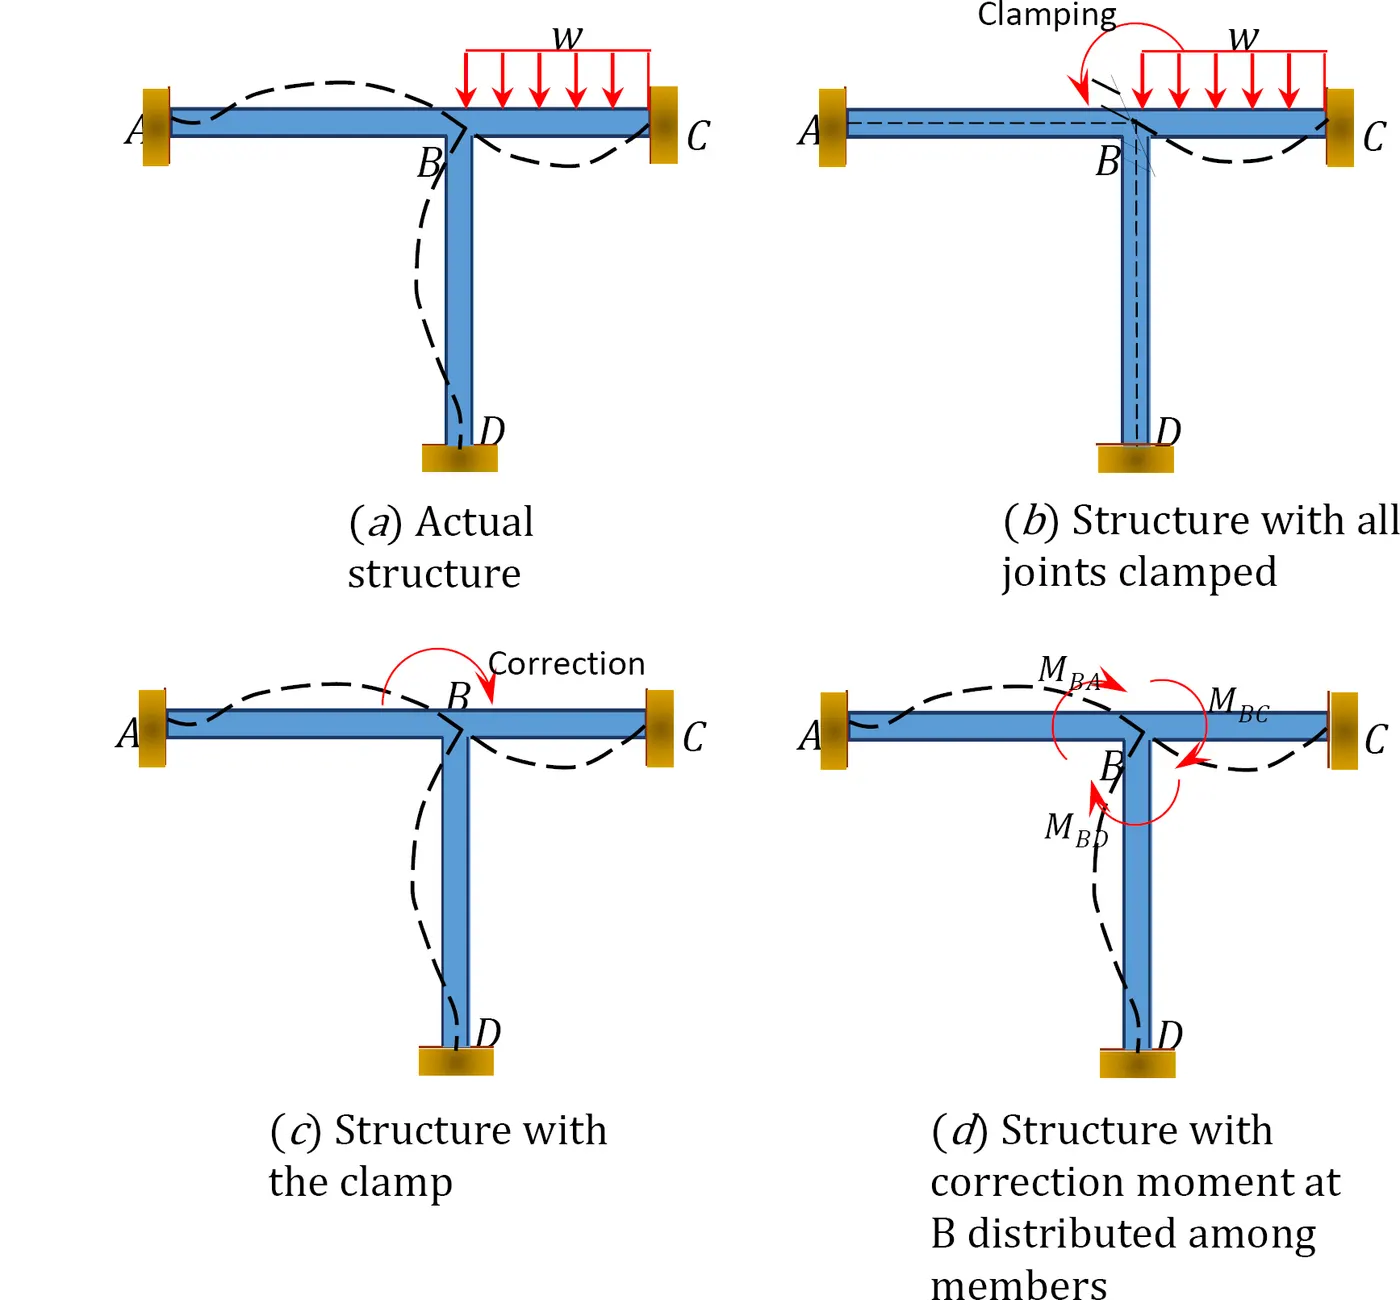
Fig. 12.1. Frame.
12.2 Sign Convention
The sign convention for the moment distribution method is similar to the one established for the slope-deflection method; that is, the moment at the end of a member is considered positive if it tends to turn the end of the member clockwise and negative if it tends to turn it counterclockwise.
12.3 Definitions
Unbalanced moments: This method of analysis assumes that the joints in a structure are initially clamped or locked and then released successively. Once a joint is released, a rotation takes place, since the sum of the fixed end moments of the members meeting at that joint is not zero. The value of the sum of the end moments obtained is the unbalanced moment at that joint.
Carry-over moments: The distributed moments in the ends of members meeting at a joint cause moments in the other ends, which are assumed to be fixed. These induced moments at the other ends are called carry-over moments.
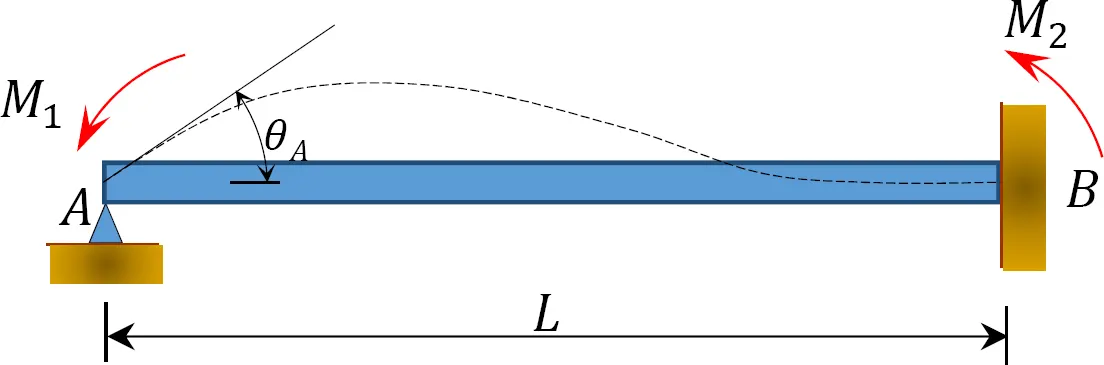
Fig. 12.2. Unloaded prismatic beam.
Result :-
Study the steel building plan and summarize your understanding of the plan. Based on your study assume and explain the location of columns and beam and develop a hand sketch for each plan
4)
Aim :-
Model grid lines and construction levels. All dimensions are in mm .The base level to be 500mm below ground level.
Intraduction :-
Select the Level branch to turn on or off all the gridlines on all the levels .Show grids in plane view .Show grids in 3D viewThe current decade (2000-2010) may be regarded as the decade of the coming-of-age of Earth System models. Such models are coming into routine use in both research and operational settings: for understanding the planetary climate in terms of feedbacks and balances between its many components; for translating such understanding into projections that inform policy to address anthropogenic climate change; and increasingly for medium- and long-term forecasts that require coupled models as well
Procedure :-
Scene content
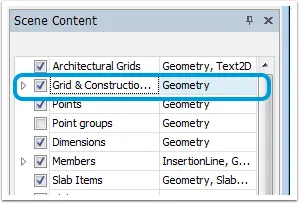
Properties window - Show grids in 3D view
The Project Workspace > Structure tree - Levels branch allows you to decide via the Properties window if a specific levels construction lines/grid is to be visible in the 3D Structure view.You can select an individual Level (i.e. St.2 etc.) to turn on or off the display of the gridlines on that specific level.
You can select the Level branch to turn on or off all the gridlines on all the levels (i.e. St 1, St.2, St.3 etc.)
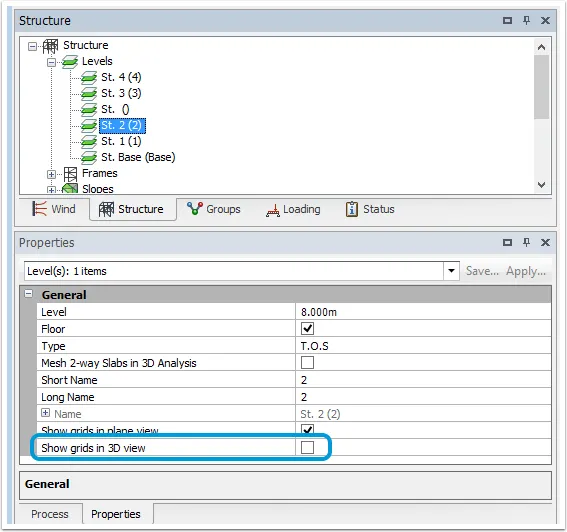
- In the Project Workspace, go to the Structure tab.
- Open Levels.
- In the Properties window:
- Show grids in plane view - select/unselect to show/hide grid lines in every level scene view
- Show grids in 3D view - select/unselect to be show/hide grid lines at every level in 3D scene views
- To show/hide grid lines at a specific levels, select the level in the Project Workspace
- In the Properties window:
- Show grids in plane view - select/unselect to show/hide grid lines at the selected level in 2D scene views
- Show grids in 3D view - select/unselect to be show/hide grid lines at the selected level in 3D scene views
When the above Show grids options have been selected, you can further control which of grid line components (i.e. lines, text labels) get displayed in individual scene views by selecting appropriate Grid & Construction Lines options in Scene Content.The comparative analysis of output from multiple models, and against observational data analysis archives, has become a key methodology in reducing uncertainty
in climate projections, and in improving forecast skill of medium- and long-term forecasts. There is considerable momentum toward simplifying such analyses by applying
comprehensive community-standard metadata to observational and model output data
archives.
The representation of gridded data is a critical element in describing the contents of model output. We seek here to propose a standard for describing the grids on which such data are discretized. The standard is drafted specifically for inclusion within the Climate and Forecasting (CF) metadata conventions.
Panel on Climate Change (IPCC) Assessment Reports. These reports, issued every 6 years, are a culmination of systematic and coordinated modeling experiments run at multiple institutions around the world
All dimensions are in mm .The base level to be 500mm below ground level.