Steady and Transient analysis of flow past a cylinder.
Aim: To simulate the flow over a cylinder and understanding the phenomenon of Karman vortex street.
Objective: The objective of the project is to simulate ANSYS-FLUENT to accomplish the following goals
- Simulate the flow with the steady and unsteady case and calculate the Strouhal Number for Re= 100.
- Calculate the drag and lift coefficient over a cylinder by setting the Reynolds number to 10,100,1000,10000 & 100000. (Run with steady solver)
- Discuss the effect of Reynolds number on the coefficient of drag. [ Results should be validated with any standard literature and error should be within 5 %]
The expected result will include
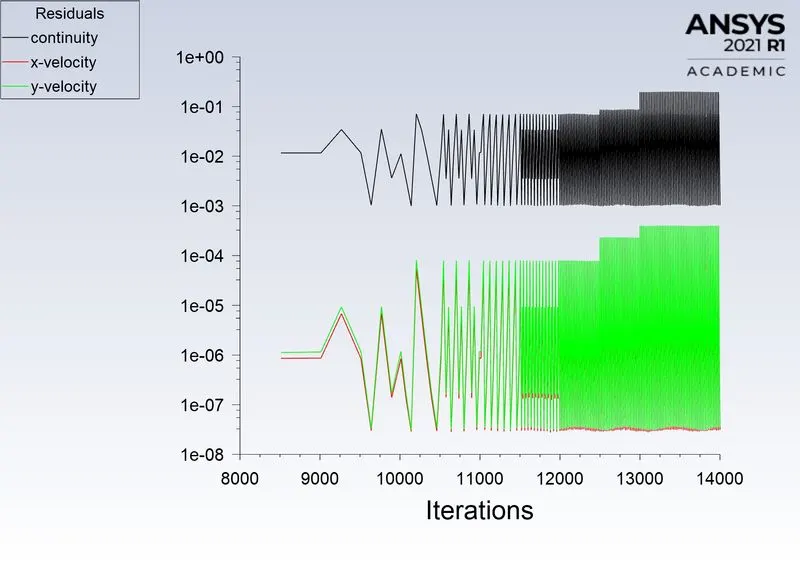
- In both approaches, show that the flow has converged. That is, what quantities or plots need to be looked at to determine that the flow has converged?
- Plots of the coefficient of drag and lift.
- Plots to show vortex shedding behind the cylinder.
- Source material at the end of the project.
Abstract
Karman-Vortex street
In fluid dynamics, Karman-Vortex street is a pattern of swirling vortices caused by the process of vortex shedding which is responsible for the flow separation in an unsteady state around the blunt bodies.
A vortex street is typically formed at Reynolds number around 90. The Reynolds number for viscous laminar flow is given as
`R_(e)=frac{rho**v**D}{mu}`
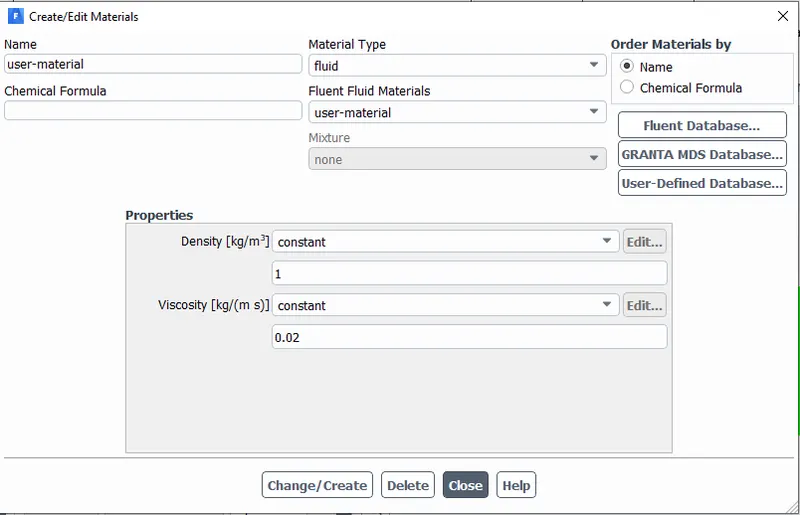
In the project, customized material suitable for the user is created by using ANSYS-FLUENT. The property of the material is as follows
Density `rho=1frac{kg}{m^3}`
Dynamic viscosity `mu=0.02frac{kg}{m-sec}`
Diameter of cylinder `D=2m`
Velocity of fluid `v=1frac{m}{sec}`
Therefore `R_e=100`
The flow is simulated around the cylinder for a steady and unsteady state at `R_e=100` which is a part of the first objective.
For the second objective, the velocity of the fluid is varied from `0.1frac{m}{sec}` to `1000frac{m}{sec}` for the steady-state, the value of lift coefficient, drag coefficient are obtained for different Reynolds number, and the effect of Reynolds number on the coefficient of drag is studied.
Strouhal number
Strouhal number is a dimensionless number describing oscillating flow mechanism.
Strouhal number is represented as
`S_t=frac{f**L}{v}`
where `f` is the frequency of vortex shedding.
`L` is the characteristic length (cylinder diameter).
`v` is the velocity around the cylinder.
Simulation steps
ANSYS-workbench is started, fluid flow (fluent) is selected from the toolbox menu. The simulation algorithm is set up in the project schematic window.
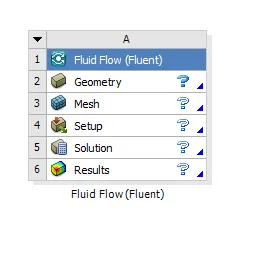
Ansys-SpaceClaim is started by clicking on geometry.
Cylinder-geometry
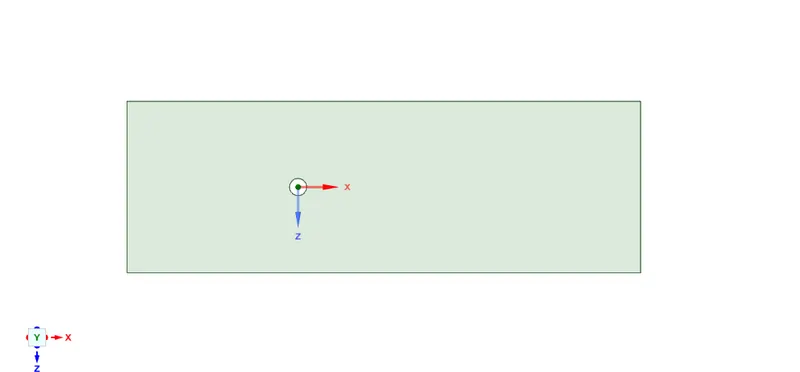
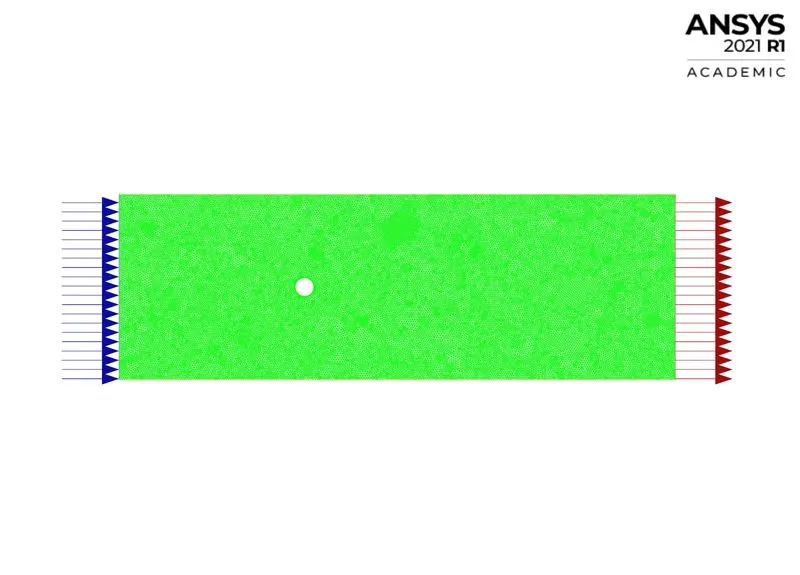
A cylinder of 2 m diameter is placed in uniform flow. The cylinder is enclosed in a rectangle of (`60xx20`). The inlet boundary is at a distance of `20m` from the center of the cylinder whereas the outlet is `40m` from the center of the cylinder.
In SpaceClaim select icon is selected to delete the cylinder portion, and all the construction lines are deleted.
Meshing
The geometry is loaded into the meshing window.
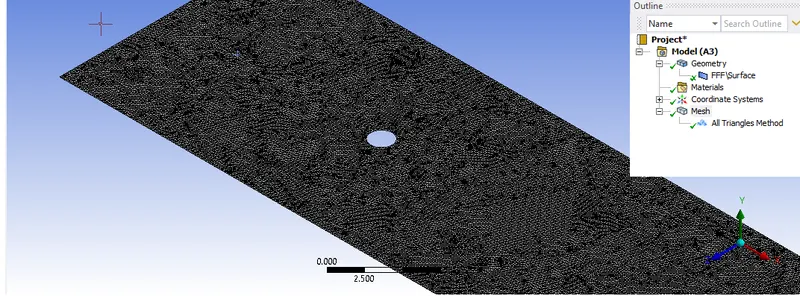
The default mesh is of quad-dominant type but the triangular mesh is selected because the geometry is simple.
The element size is `0.2m`.
The number of elements is `61857`
Mesh refinement
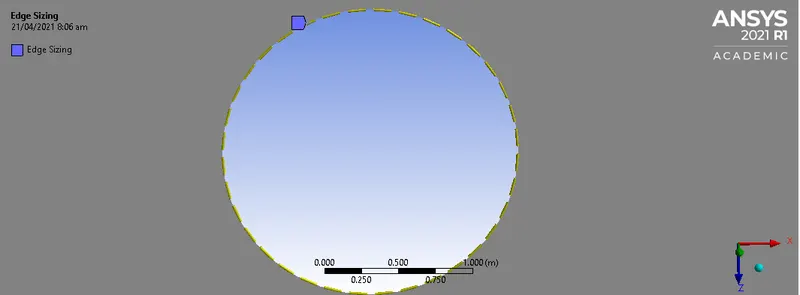
Edge sizing
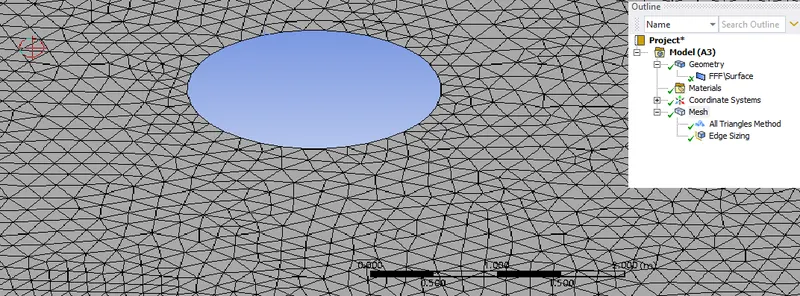
The edge of the circle are sharp, to make the edge more smooth, the edge of the circle is divided into 36 points
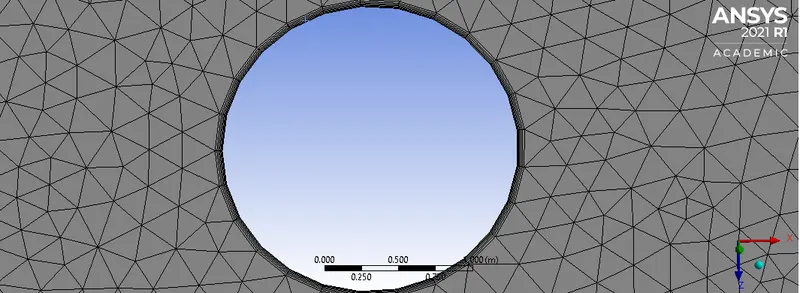
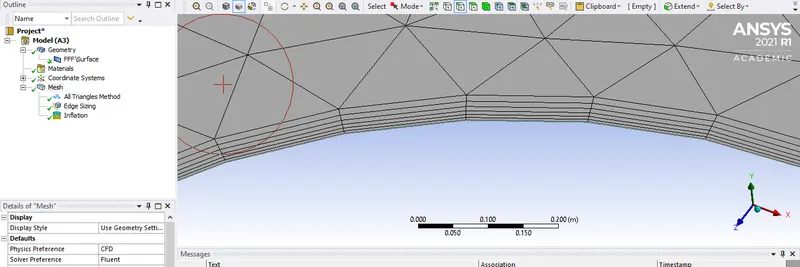
Inflation layer
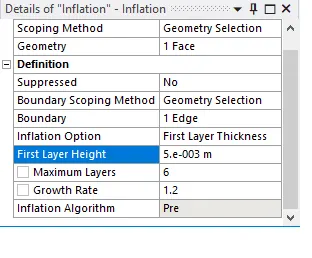
Inflation option: First layer thickness
First layer height: `5e-03 m`
Maximum layers: `6`
Growth rate: `1.2`
Details of inflation options
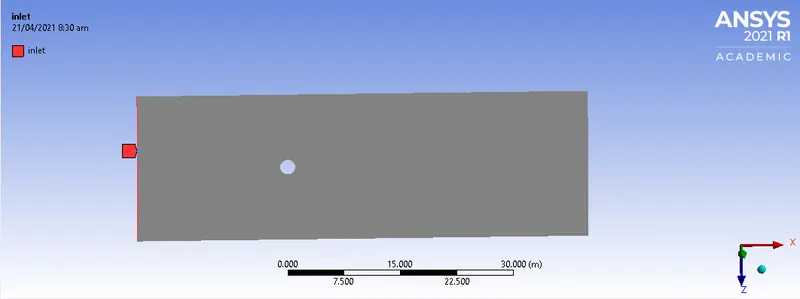
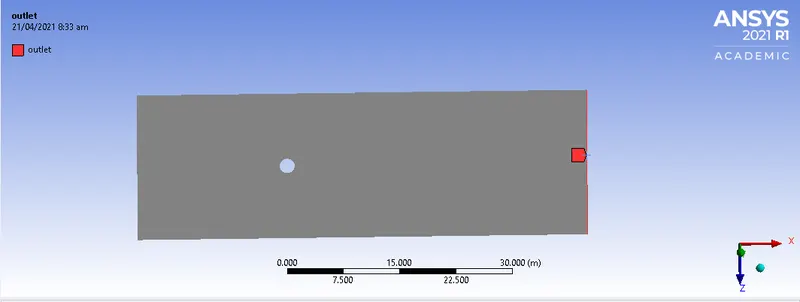
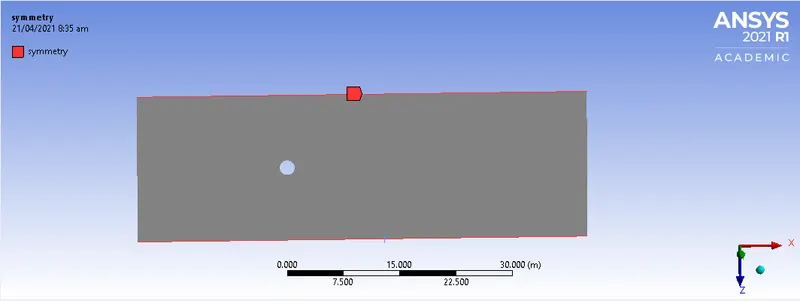
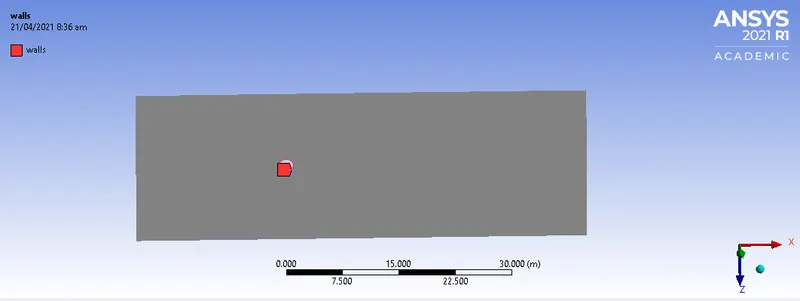
Creating named selection for setting up of physics and boundary conditions.
Inlet boundary condition (velocity inlet)
Outlet boundary condition (pressure-outlet)
Top and bottom (symmetry boundary condition)
Walls
The meshing part is closed and setup is executed from the workbench. The fluent window will open displaying the geometry under consideration.
Steady-state simulation steps.
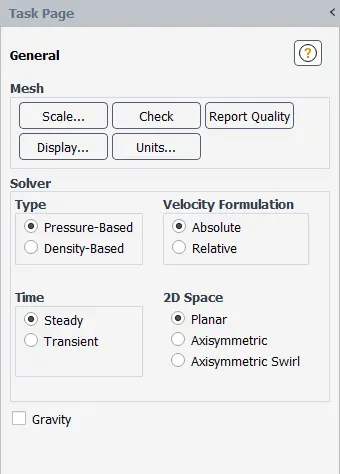
Solution methods
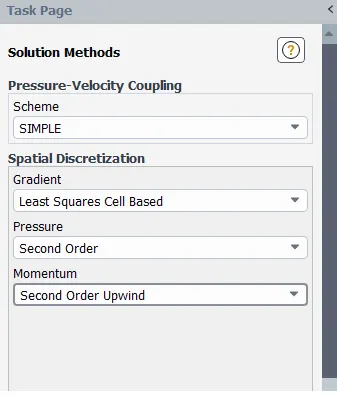
Reference values
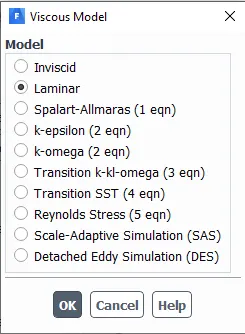
Viscous model
Creating a customized fluid
Adding a monitor point
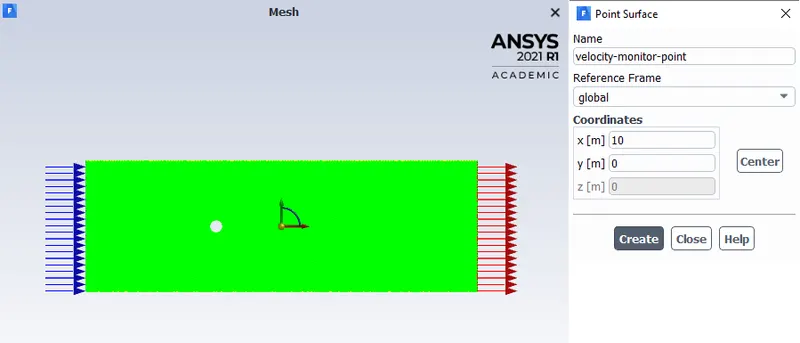
Creating a surface report for the velocity at a distance of `10m` from the center of the cylinder.
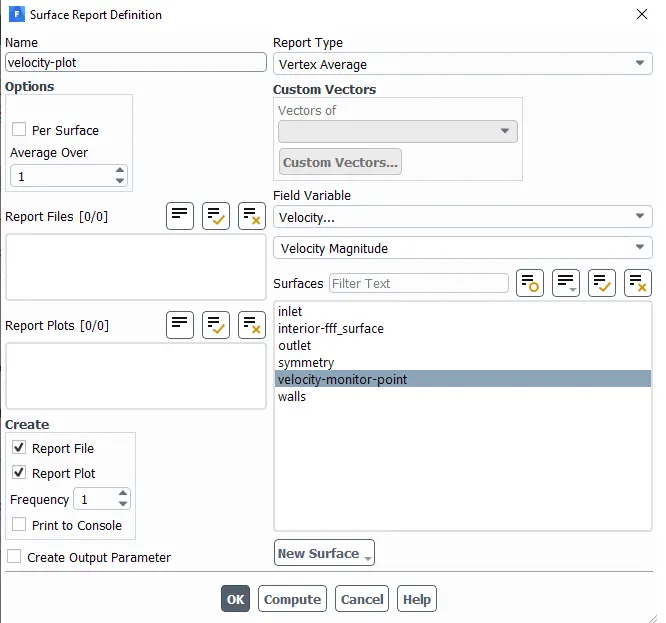
Creating drag and lift coefficient report.
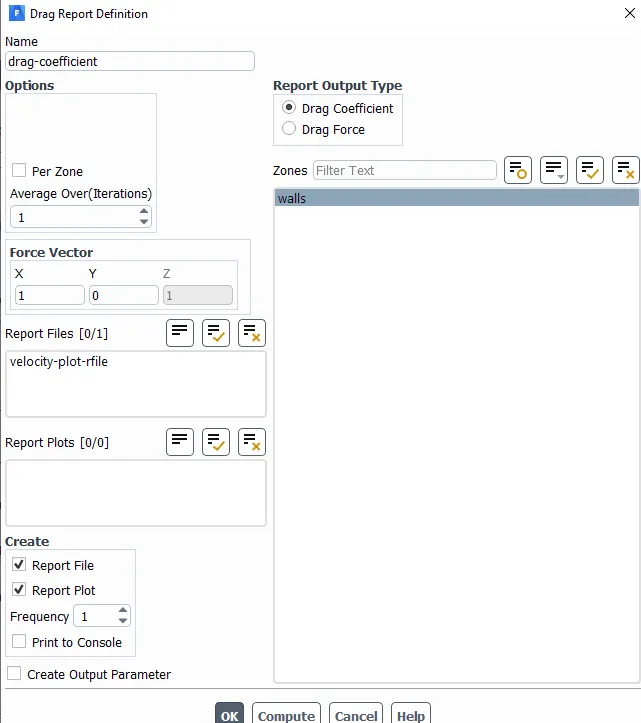
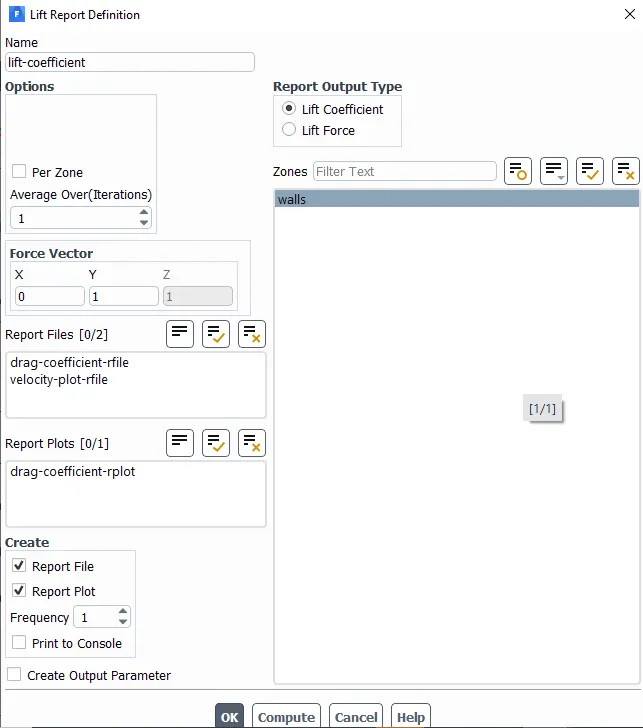
The solution is initialized by clicking `t=0` under the solution tab.
Creating velocity and pressure contour
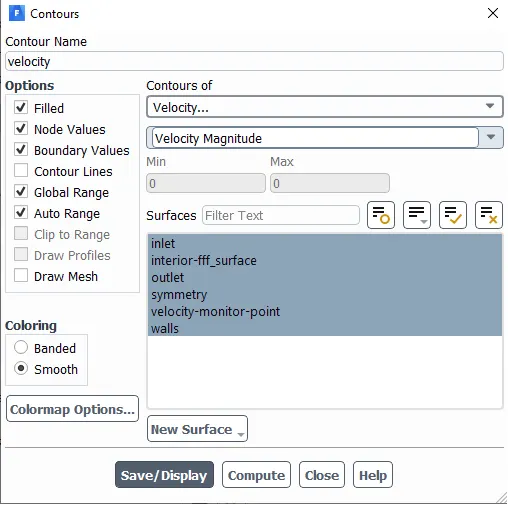
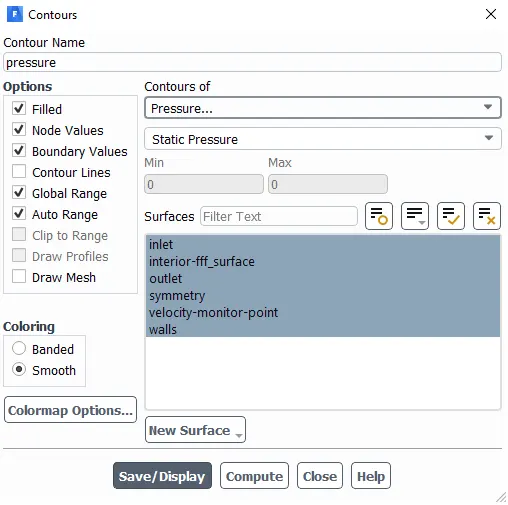
Creating and saving animation in ANSYS-FLUENT.
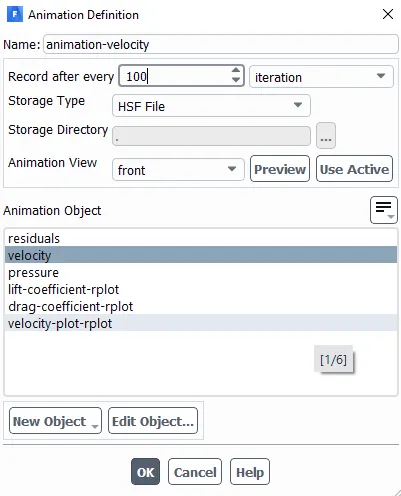
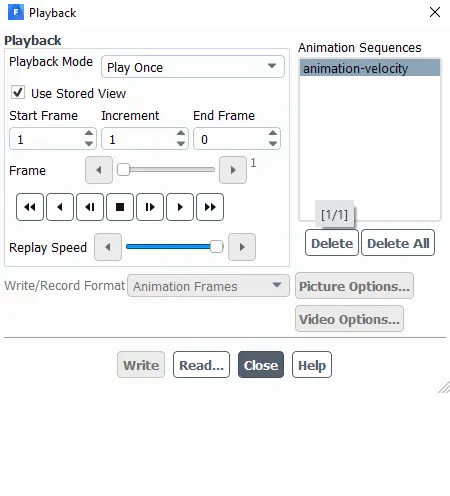
The write/record format should be chosen as video files.
Thus by clicking on write the video is saved in the respective folder.
The following plots to be shown for both the steady and transient simulation.
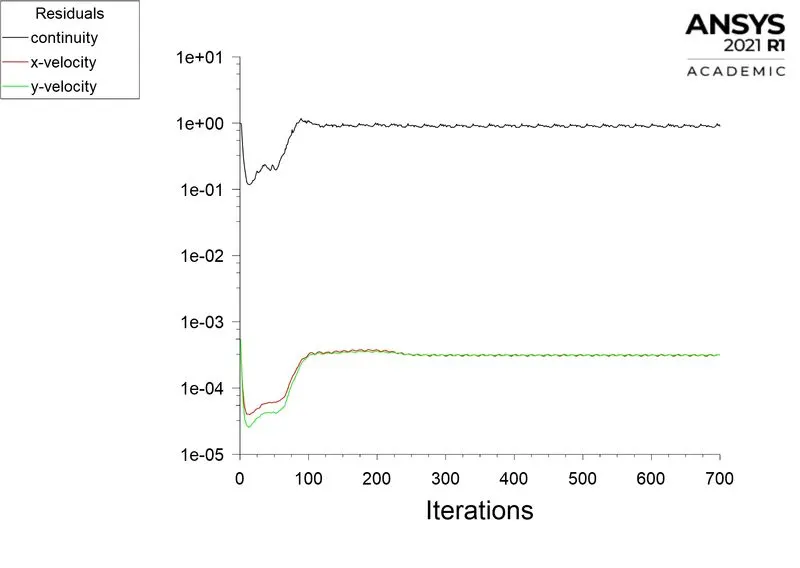
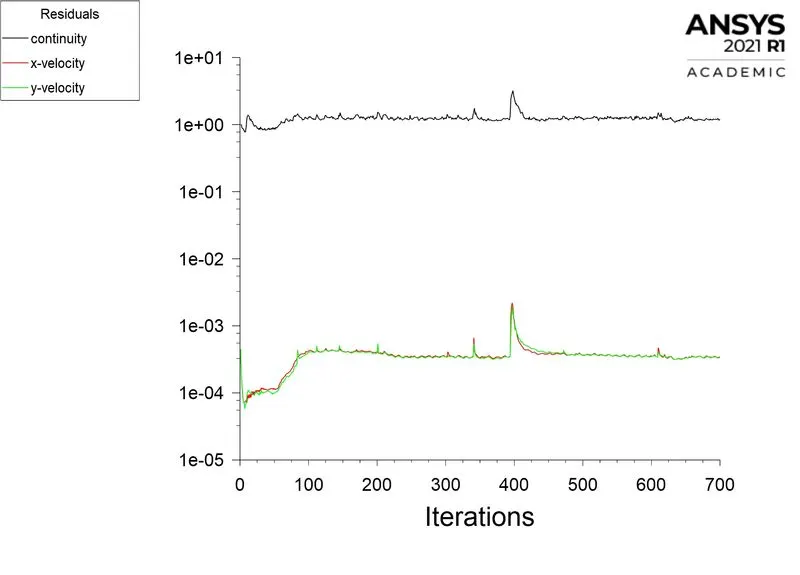
Residual plots
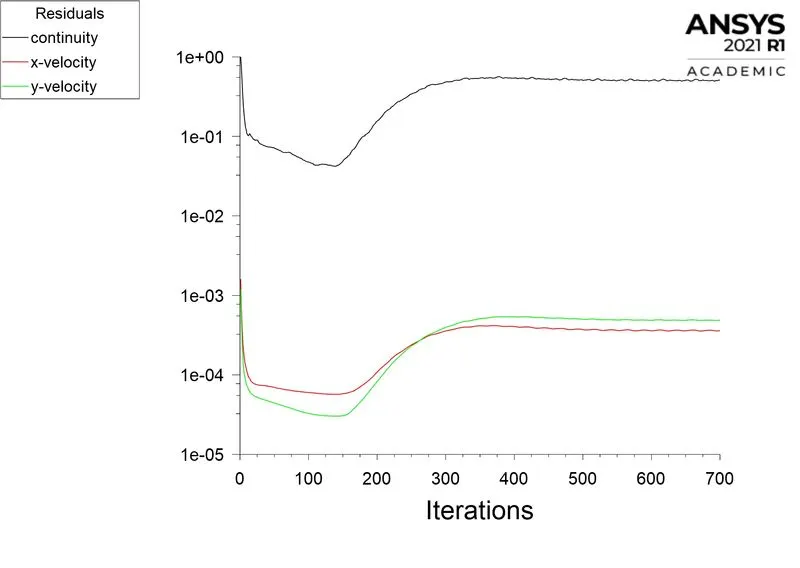
The plot shows at what point the convergence has been achieved.
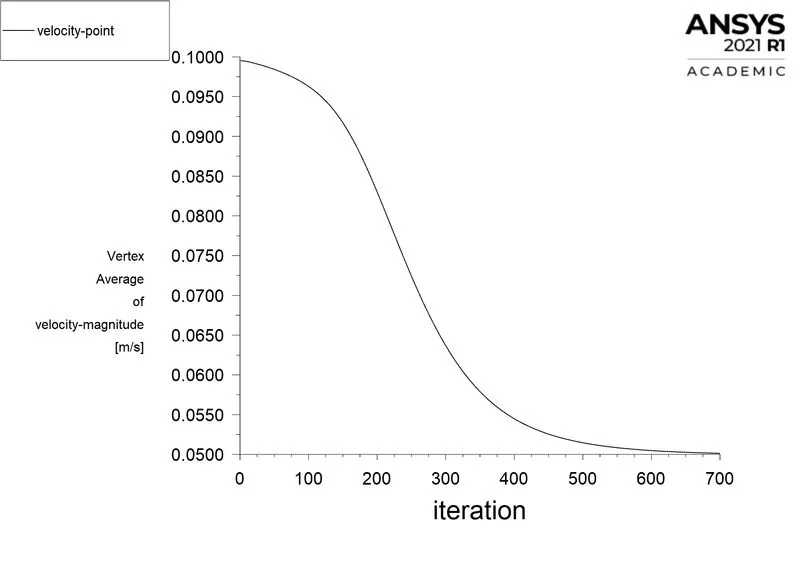
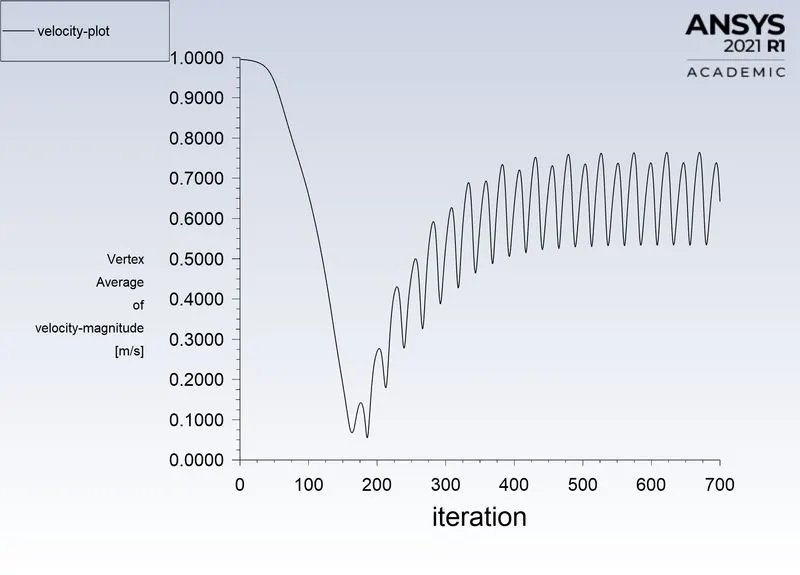
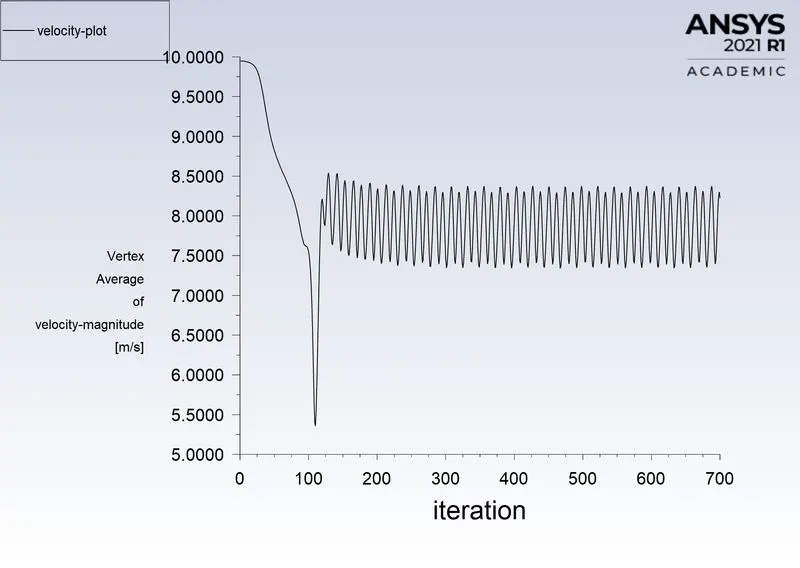
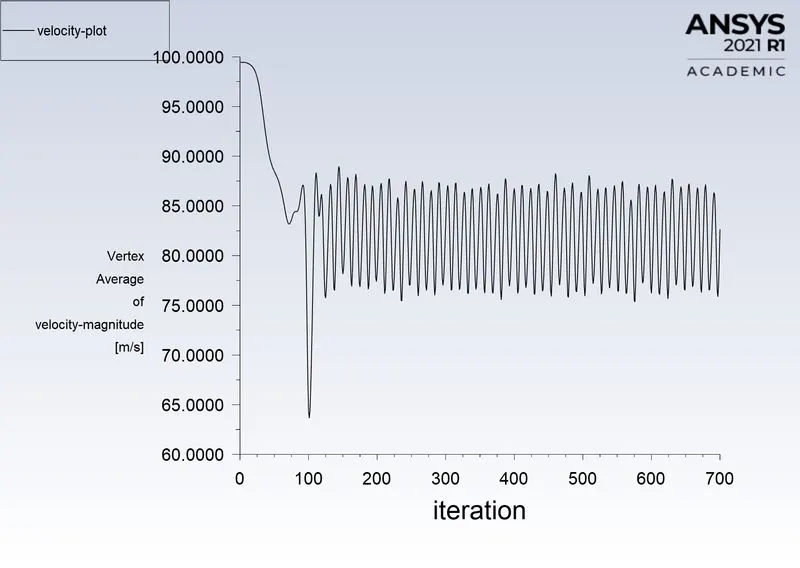
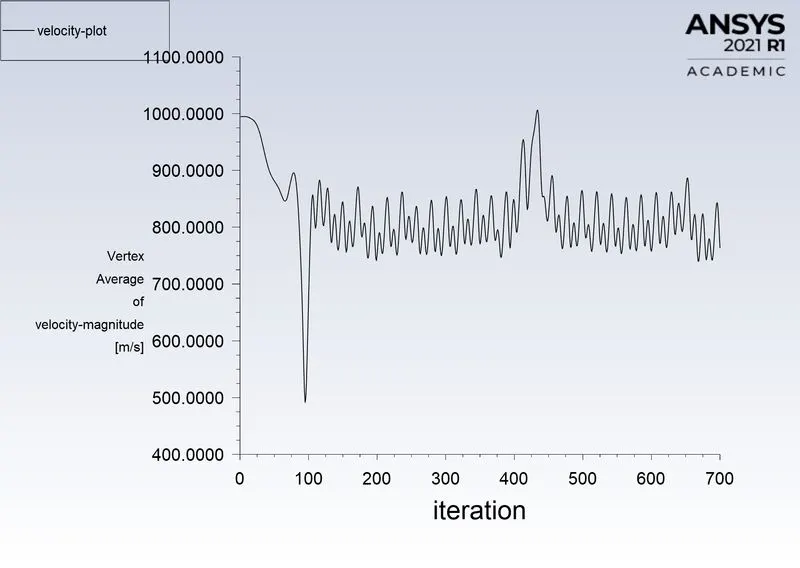
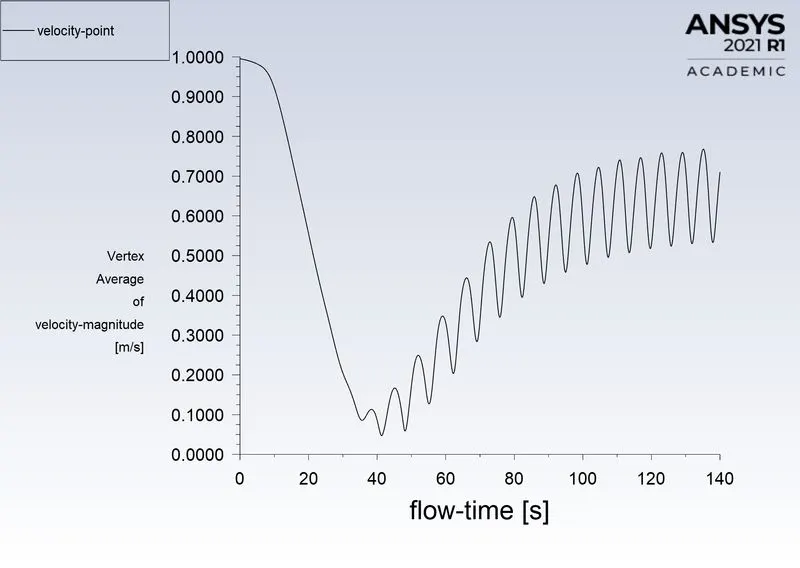
Monitor point velocity plot
The velocity is monitored at a distance of 10m from the center of the cylinder.
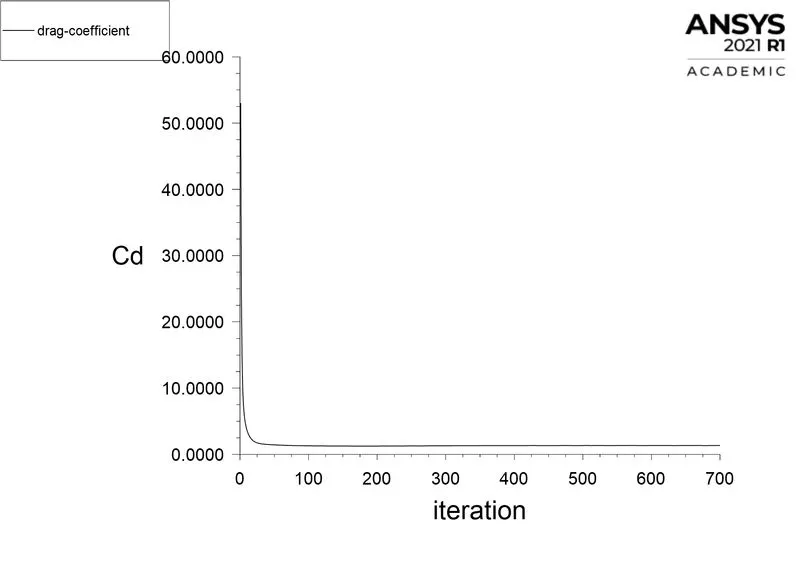
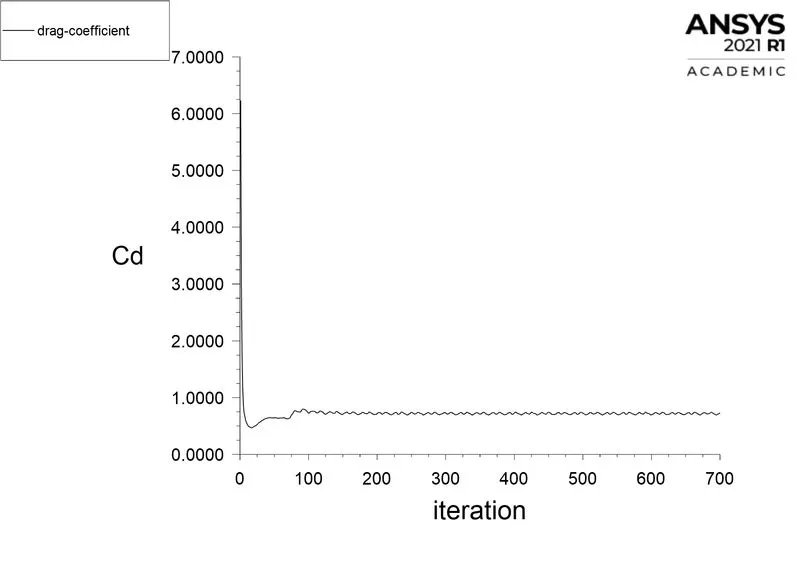
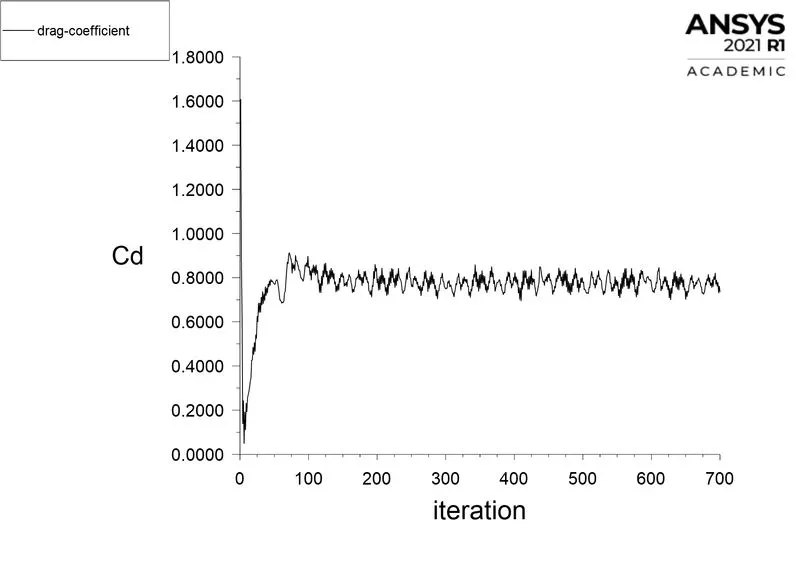
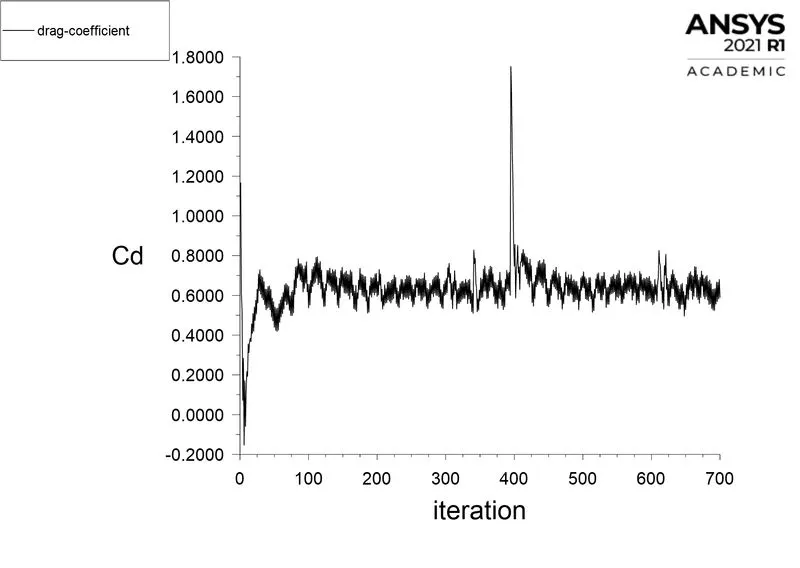
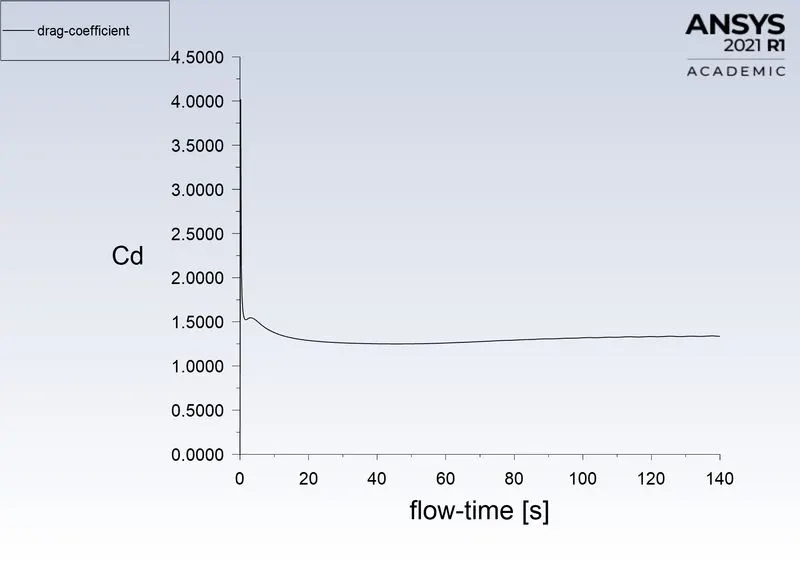
Drag coefficient plot
To calculate the drag force.
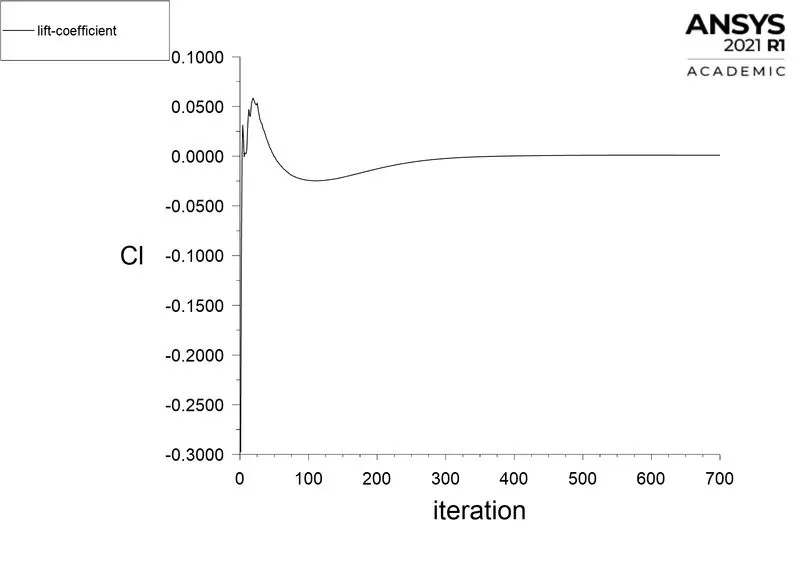
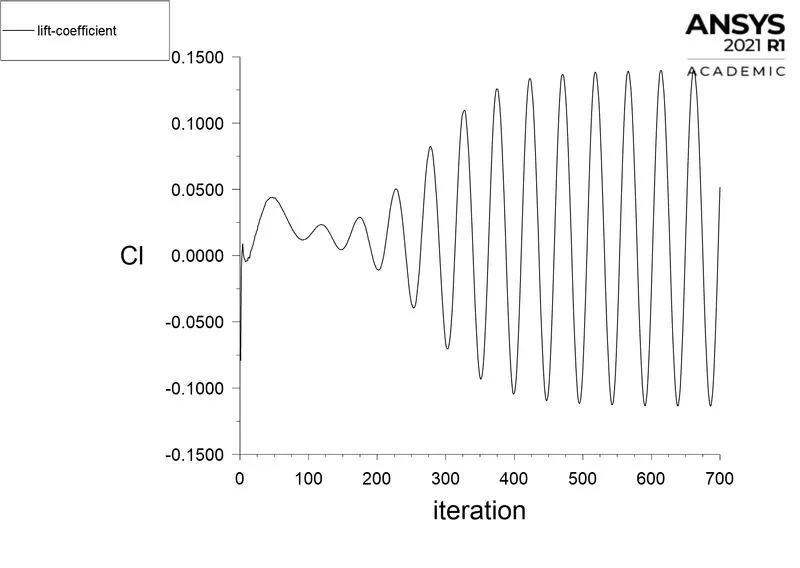
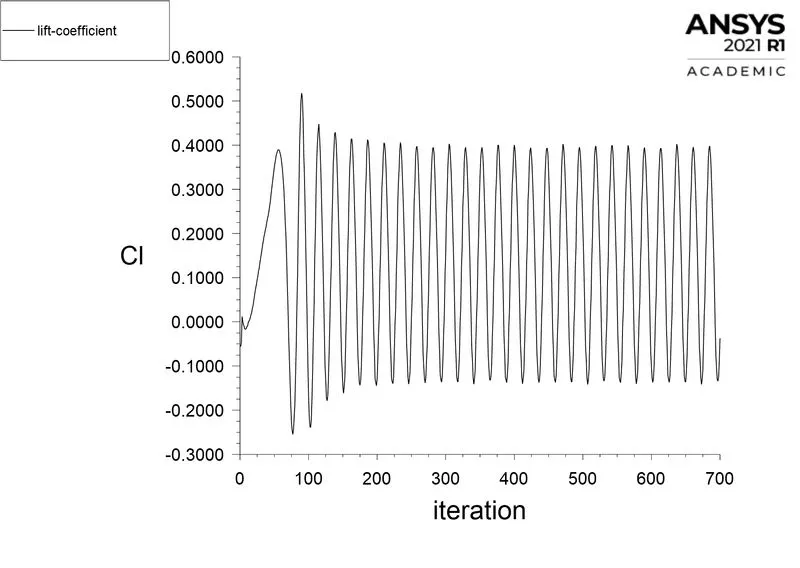
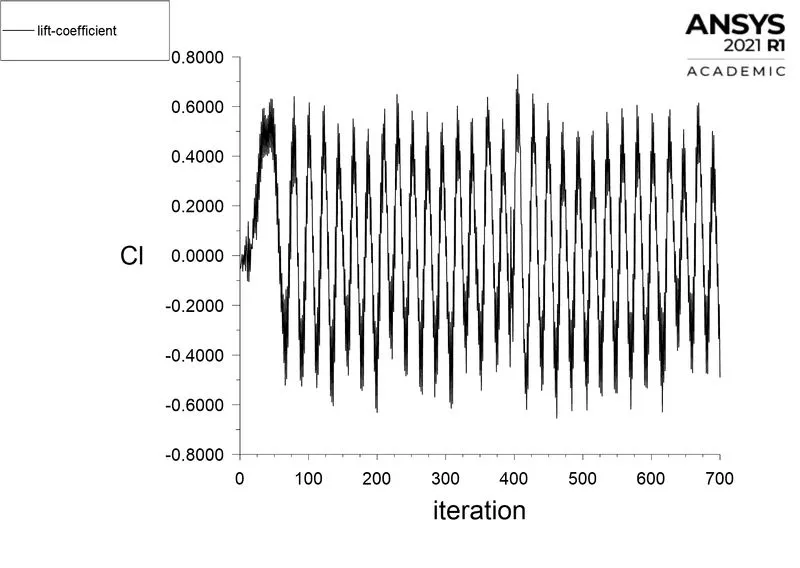
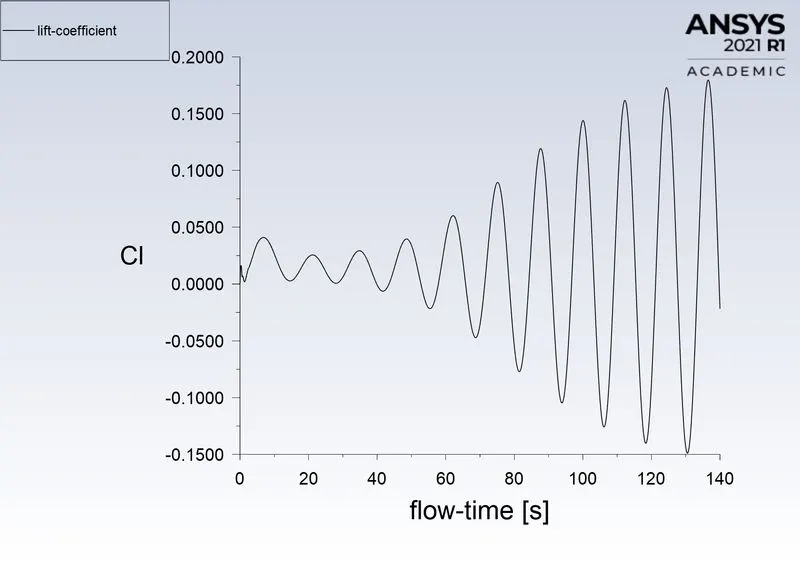
Lift coefficient plot
To calculate the lift and Strouhal number (transient state).
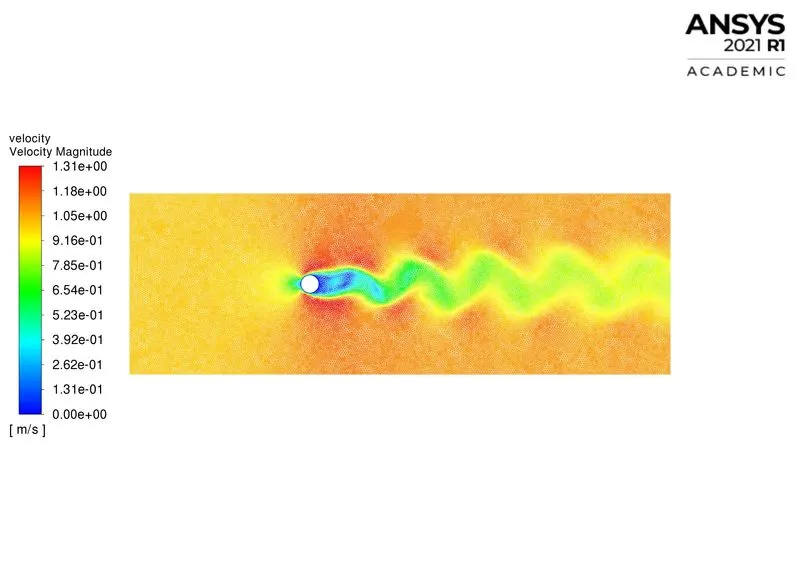
Velocity and pressure plot
To see the changes in velocity and pressure behind the cylinder.
Steady-state simulation
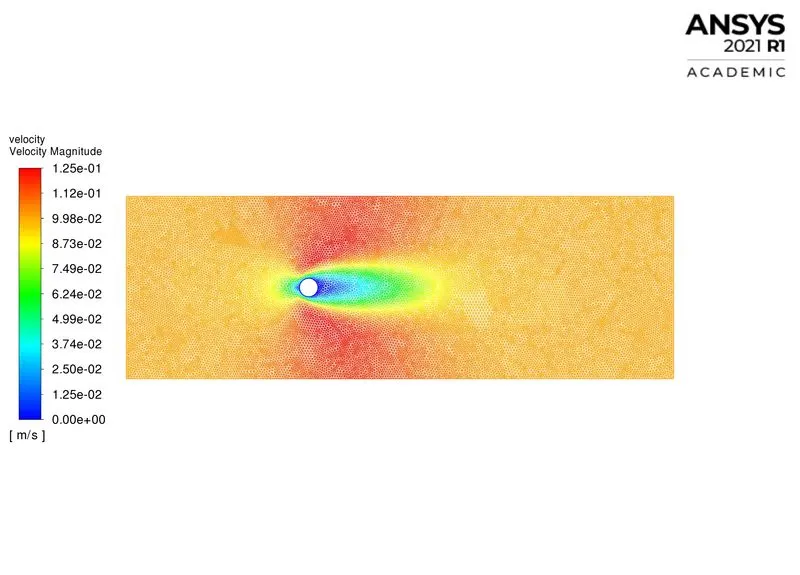
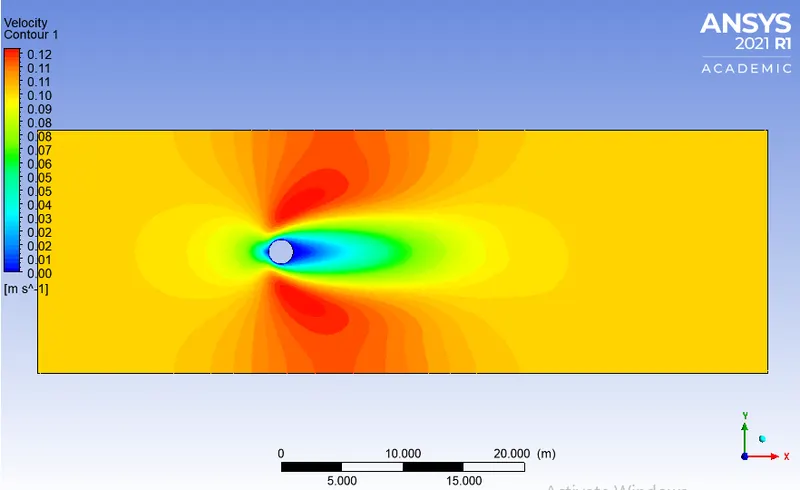
Case-1
Flow velocity: `0.1frac{m}{sec}`
Reynolds number: `10`
Density of water: `1frac{kg}{m^3}`
Dynamic viscosity: `0.02frac{kg}{m-sec}`
Number of iteration: `700`
Residual plot
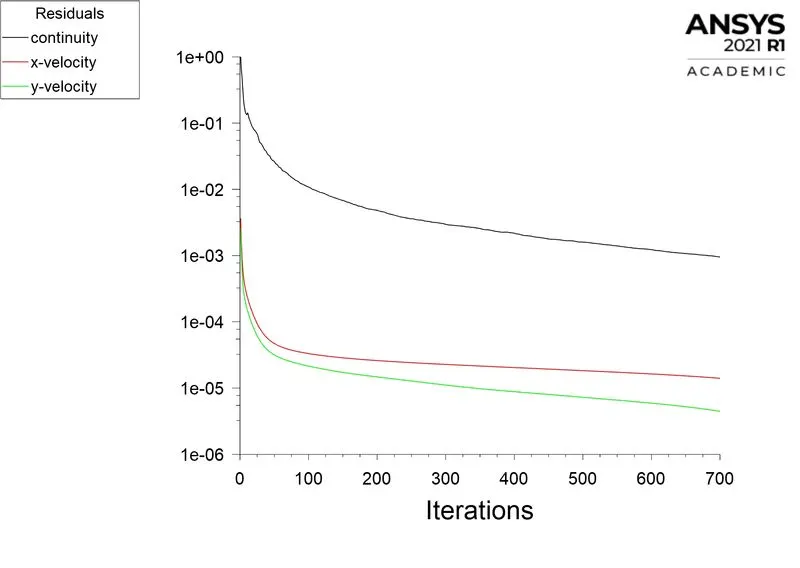
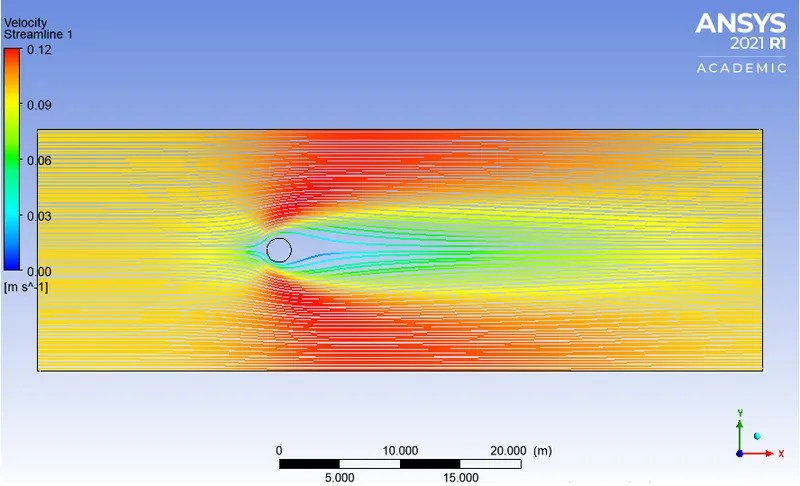
The plot converges around 600 iteration.
Monitor point velocity
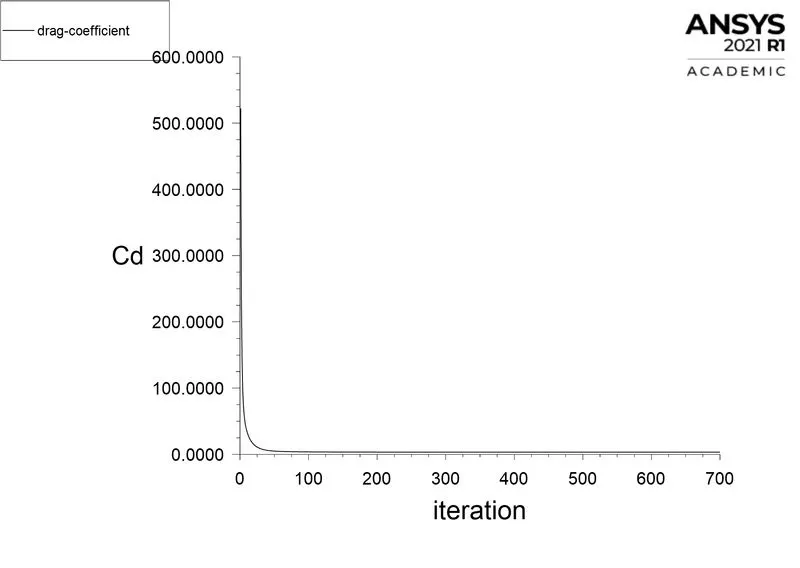
Drag coefficient
Lift coefficient
Velocity contour
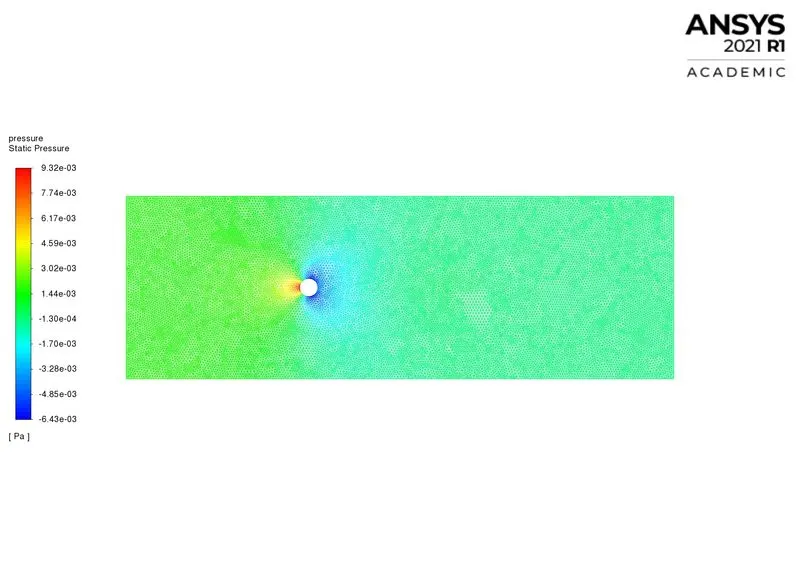
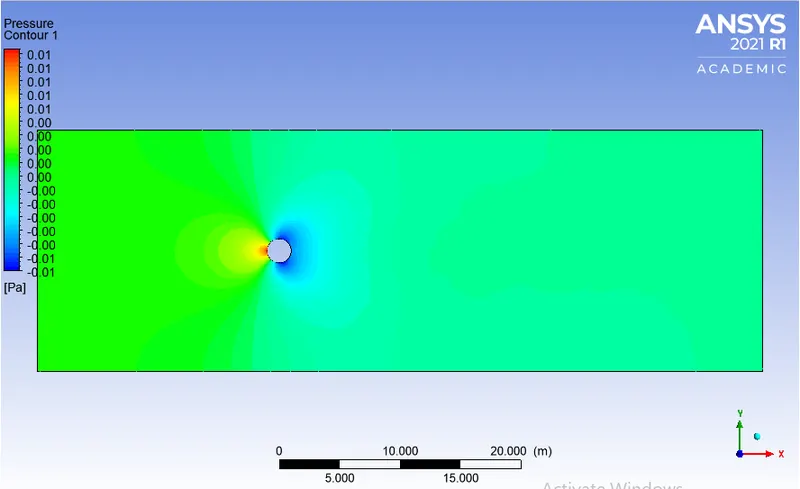
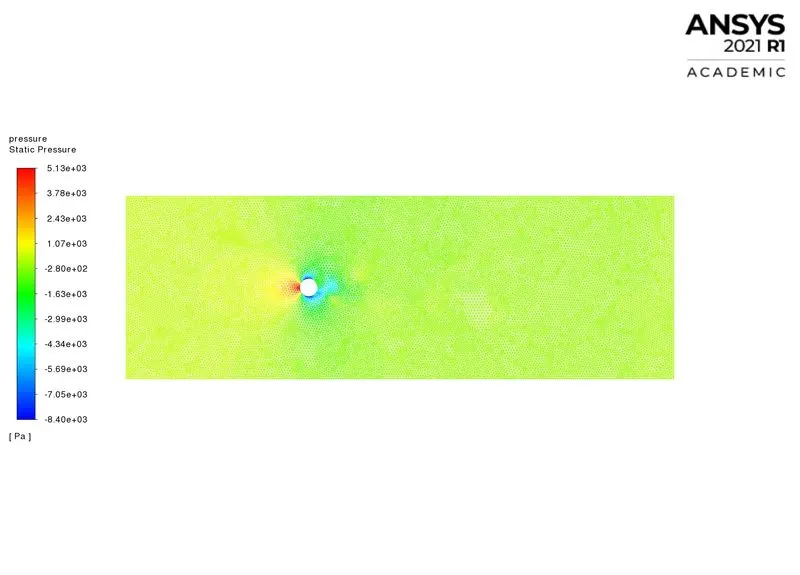
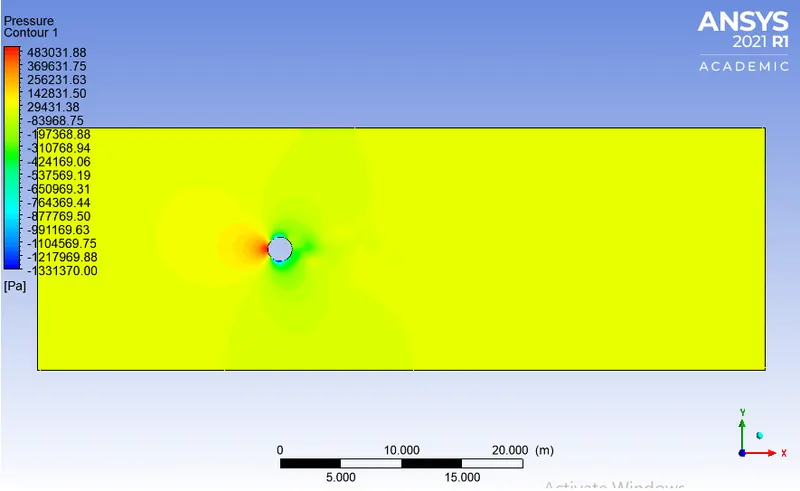
Pressure contour
Case-2
Flow velocity: `1frac{m}{sec}`
Reynolds number: `100`
Density of water: `1frac{kg}{m^3}`
Dynamic viscosity: `0.02frac{kg}{m-sec}`
Number of iteration: `700`
Residual plot
Monitor point velocity
Drag coefficient
Lift coefficient
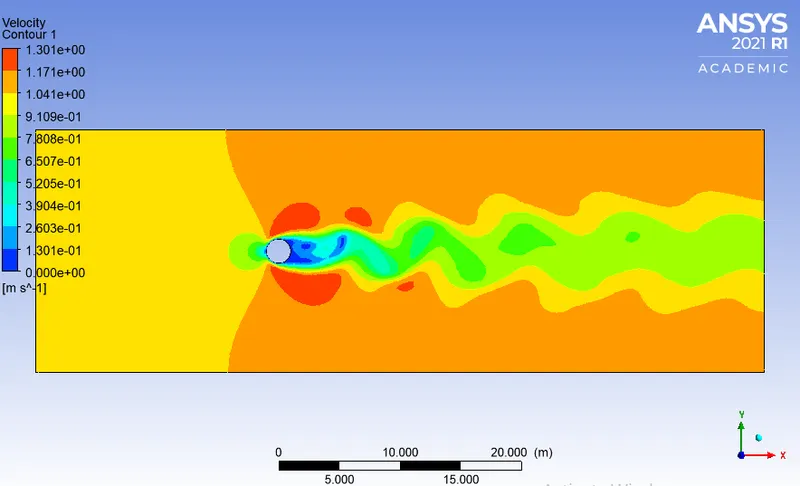
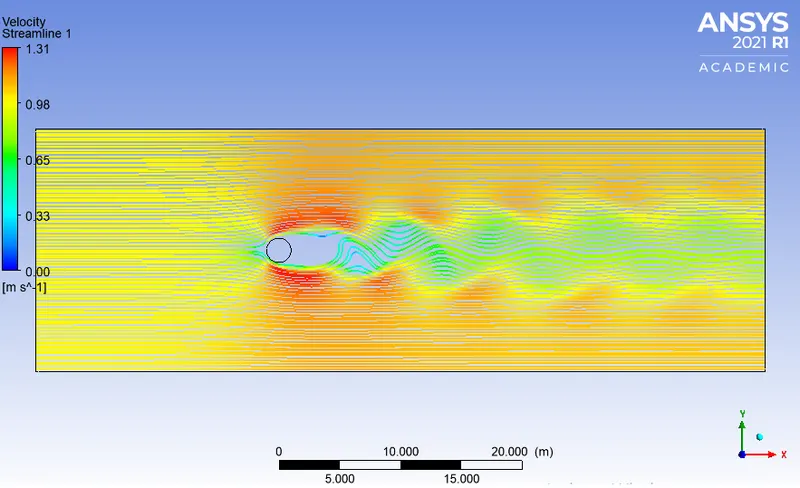
Velocity contour
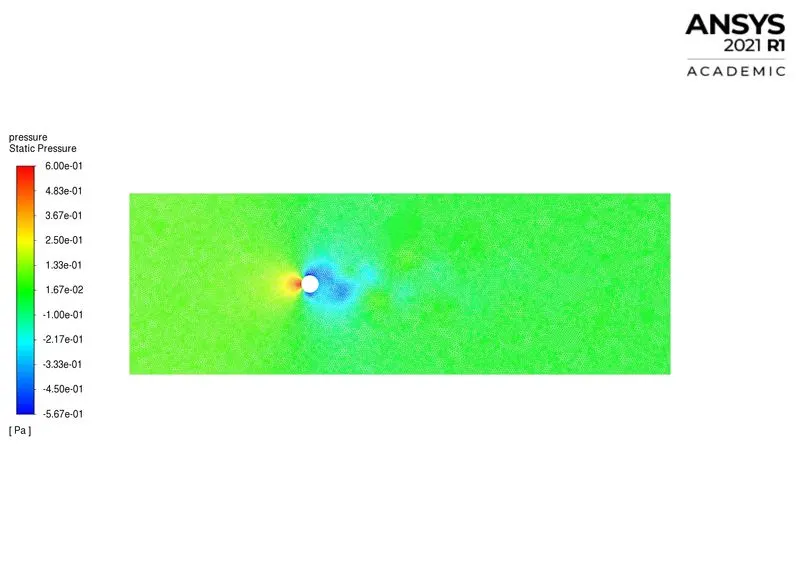
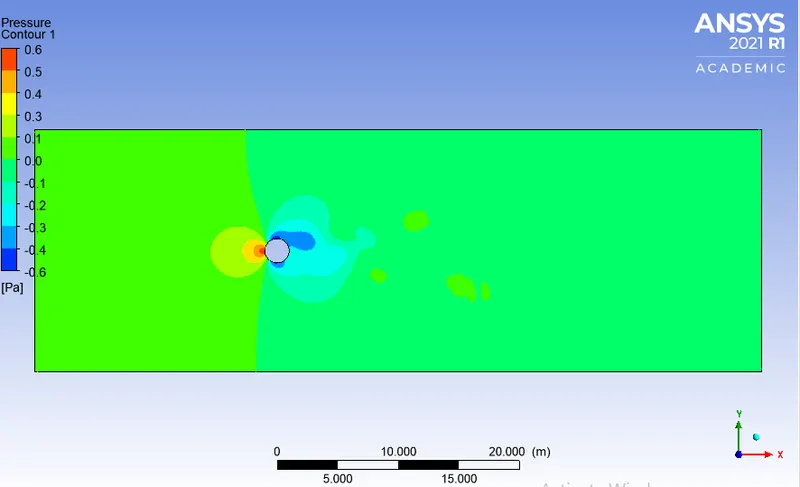
Pressure contour
Case-3
Flow velocity: `10frac{m}{sec}`
Reynolds number: `1000`
Density of water: `1frac{kg}{m^3}`
Dynamic viscosity: `0.02frac{kg}{m-sec}`
Number of iteration: `700`
Residual plot
Monitor point velocity
Drag coefficient
Lift coefficient
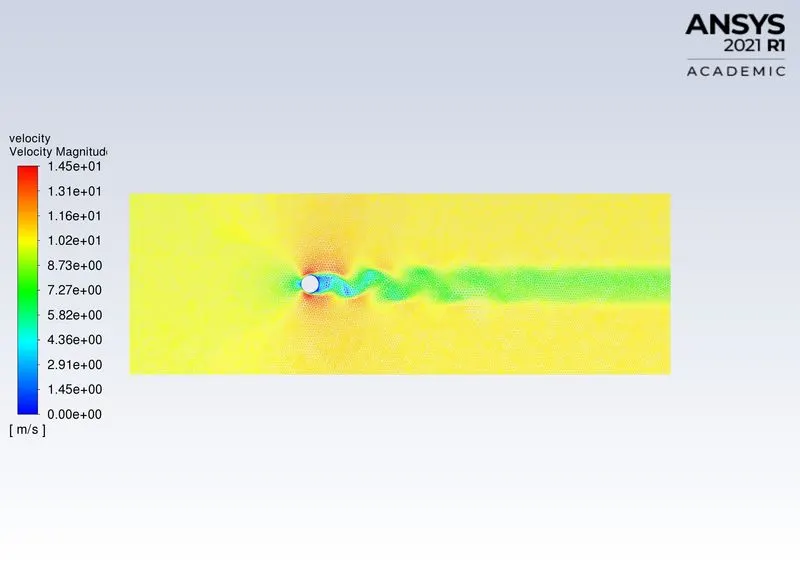
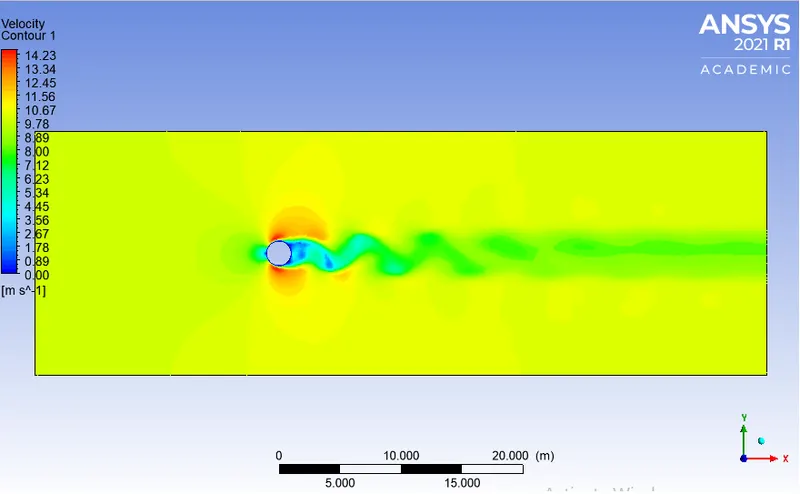
Velocity contour
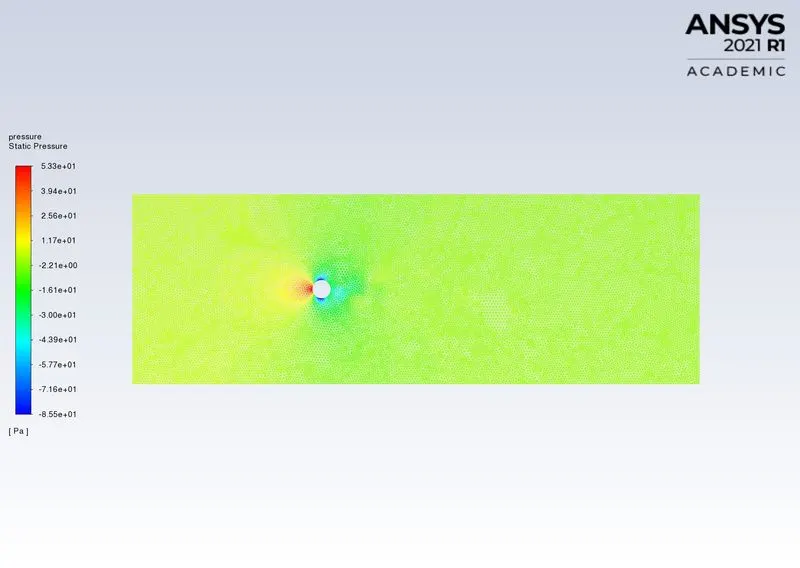
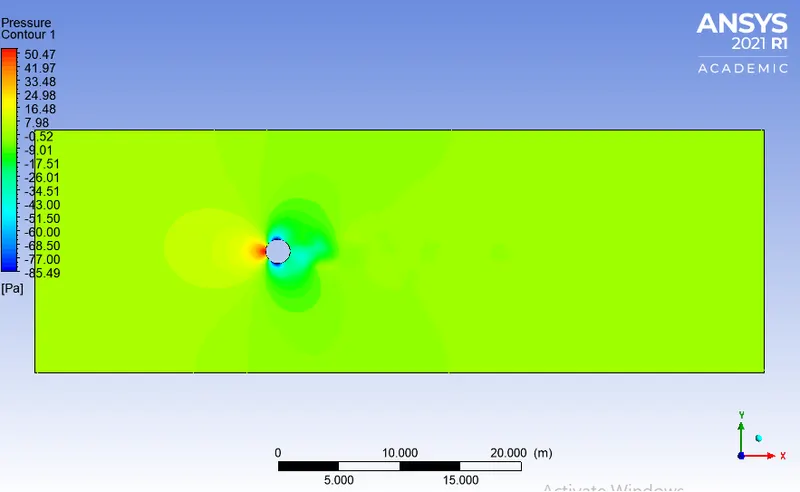
Pressure contour
Case-4
Flow velocity: `100frac{m}{sec}`
Reynolds number: `10000`
Density of water: `1frac{kg}{m^3}`
Dynamic viscosity: `0.02frac{kg}{m-sec}`
Number of iteration: `700`
Residual plot
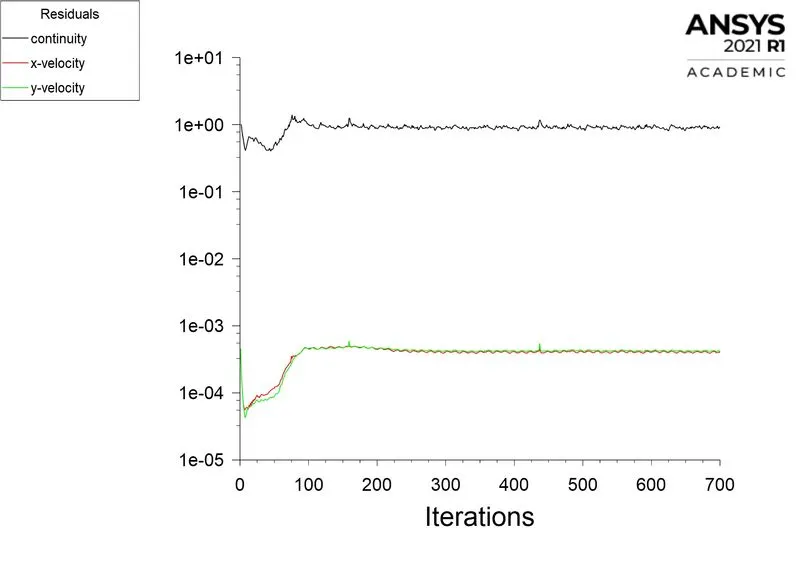
Monitor point velocity
Drag coefficient
Lift coefficient
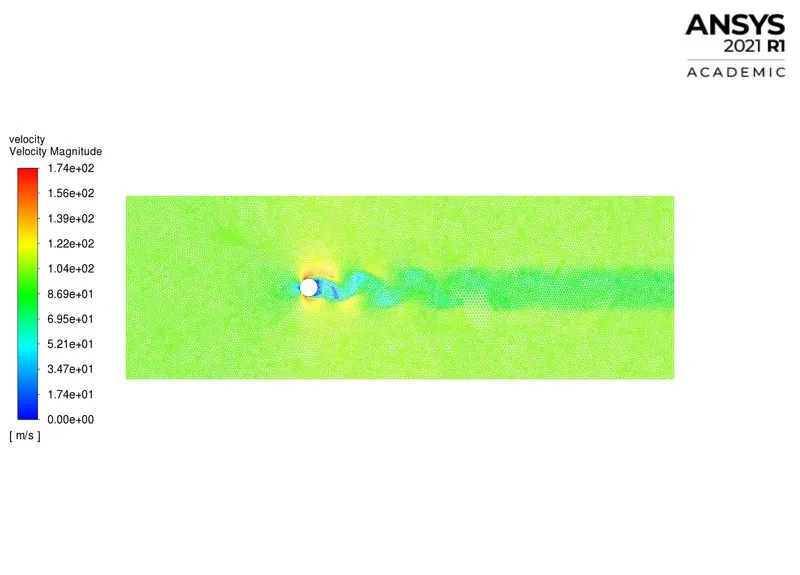
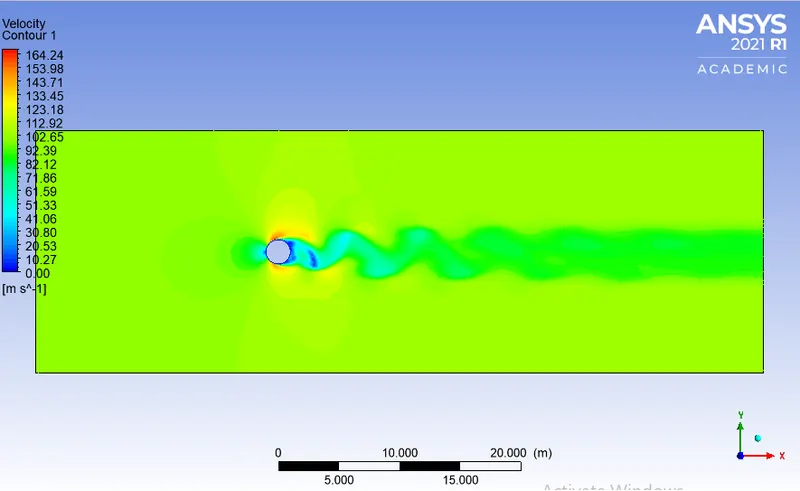
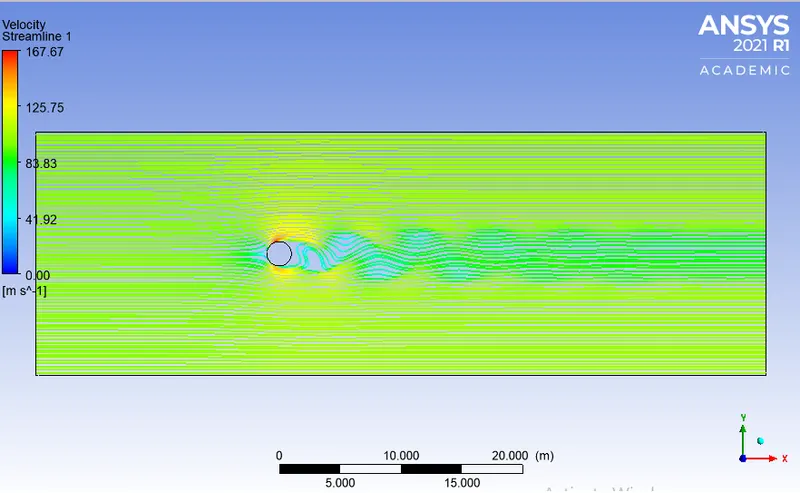
Velocity contour
Pressure contour
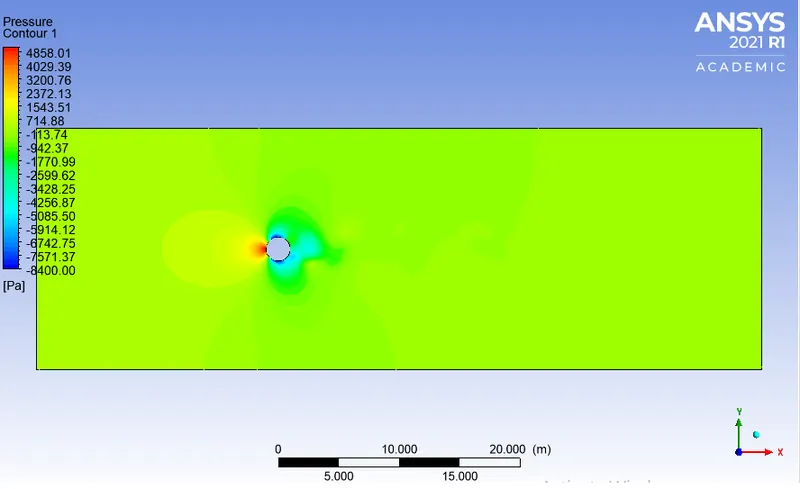
Case-5
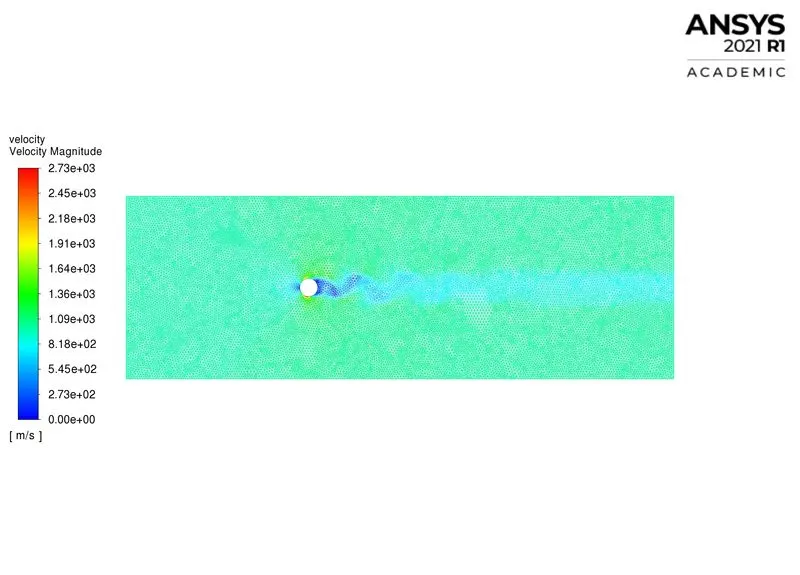
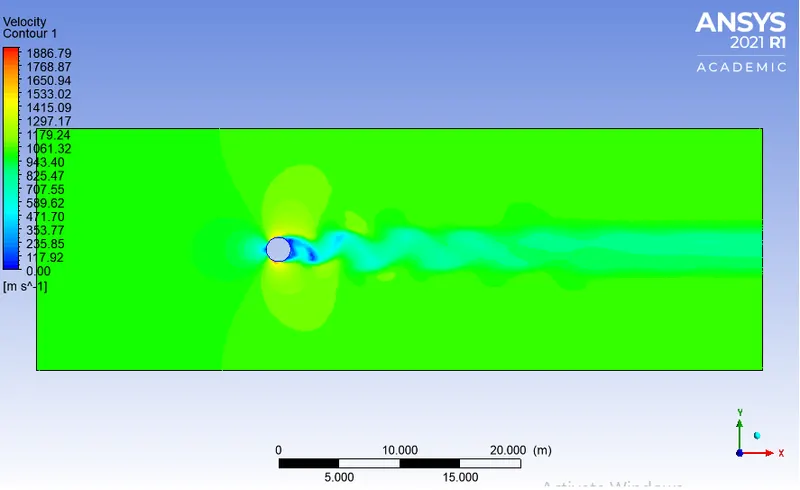
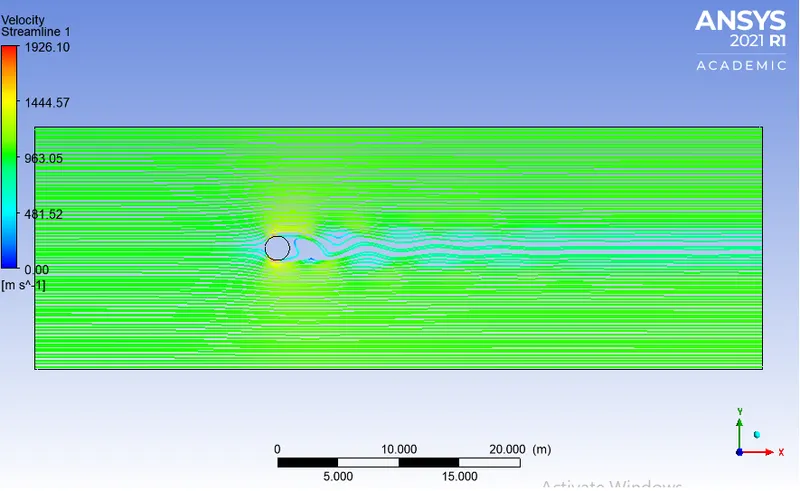
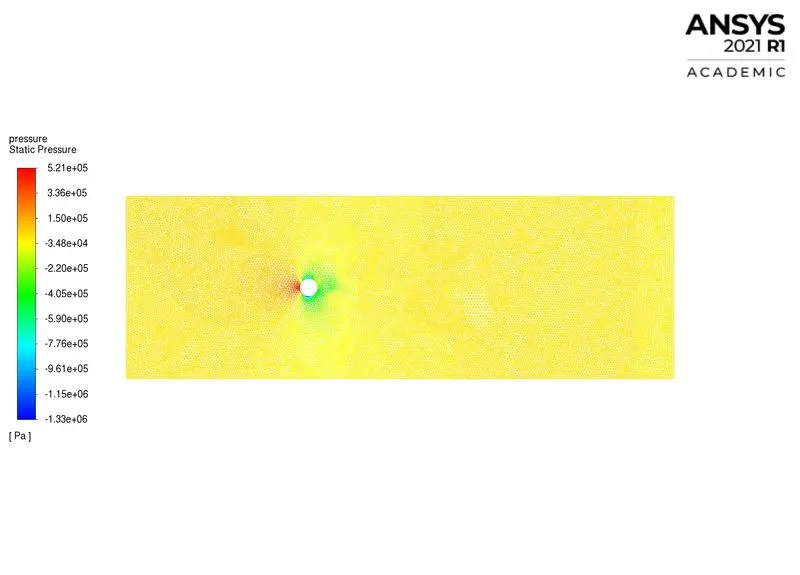
Flow velocity: `1000frac{m}{sec}`
Reynolds number: `100000`
Density of water: `1frac{kg}{m^3}`
Dynamic viscosity: `0.02frac{kg}{m-sec}`
Number of iteration: `700`
Residual plot
Monitor point velocity
Drag coefficient
Lift coefficient
Velocity contour
Pressure contour
Transient simulation
Flow velocity
Flow velocity: `1frac{m}{sec}`
Reynolds number: `100`
Density of water: `1frac{kg}{m^3}`
Dynamic viscosity: `0.02frac{kg}{m-sec}`
Number of iteration : `700`
Time step size: `0.2s`
Transient simulation steps
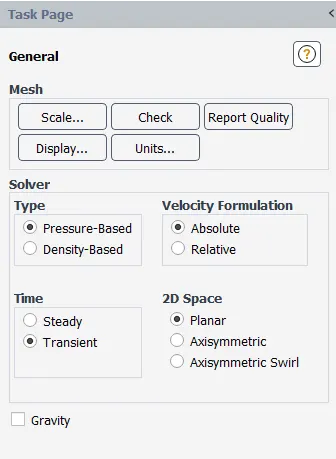
The rest steps are the same when compared to steady-state.
Residual plot
Monitor point velocity
Drag coefficient
Lift coefficient
Calculating Strouhal Number
`S_t=frac{f**L}{v}`
Frequency of the curve = (Number of peaks)/time =`frac{4}{120-70}`
Characteristic length `D=2m`
Velocity of fluid`=1frac{m}{sec}`
`S_t=frac{0.08**2}{1}``=0.16`
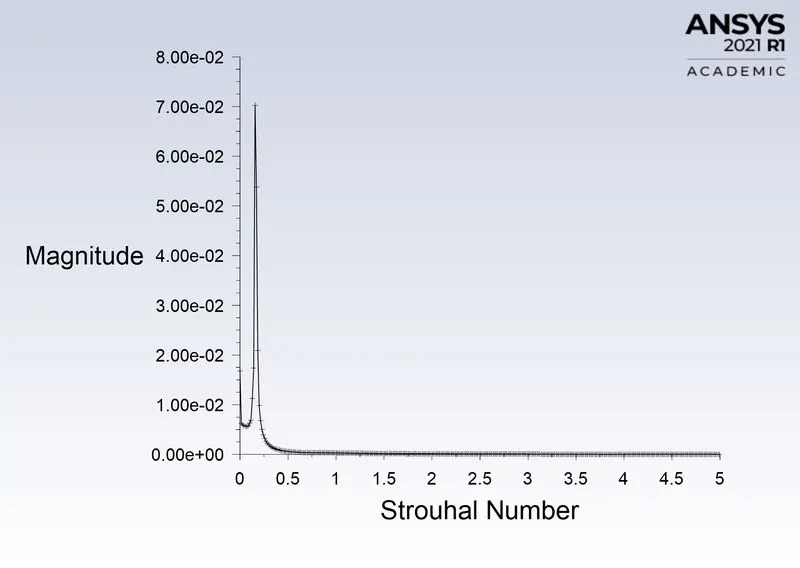
From the graph, the first peak value corresponds to `0.1675`
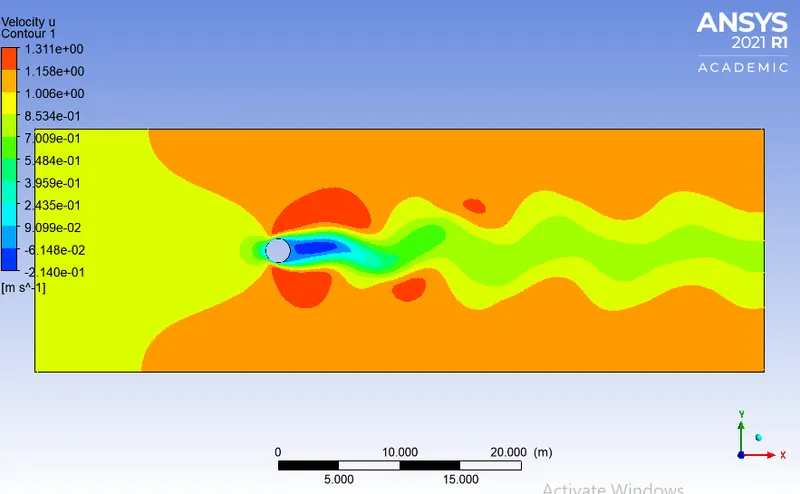
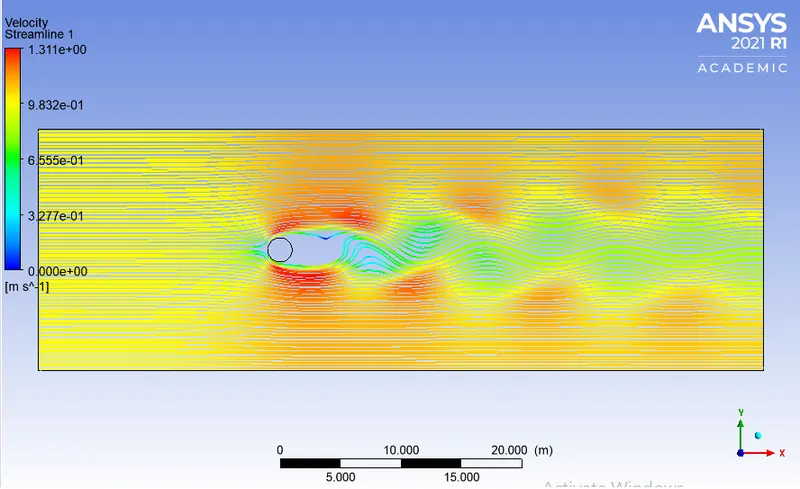
Velocity contour
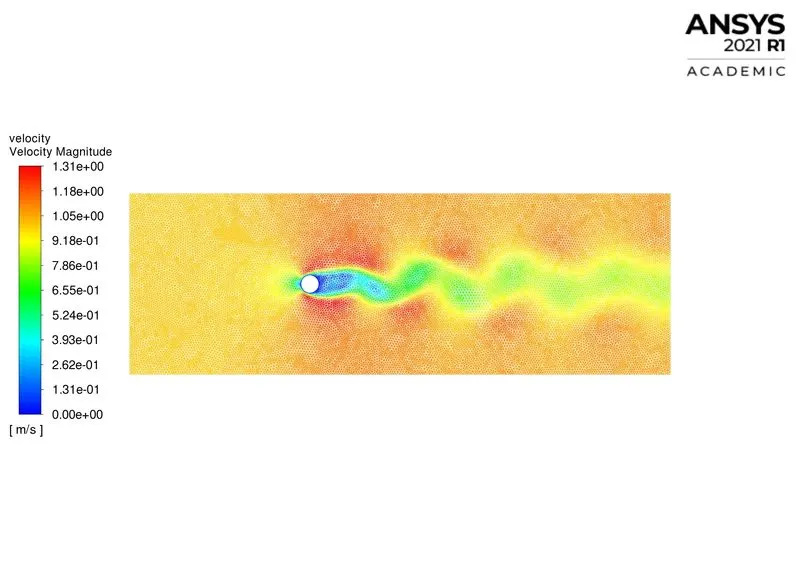
Pressure contour
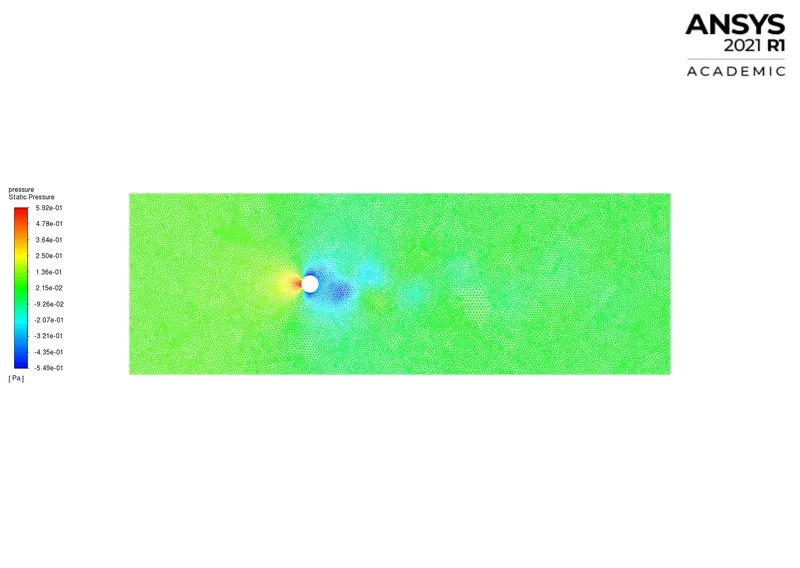
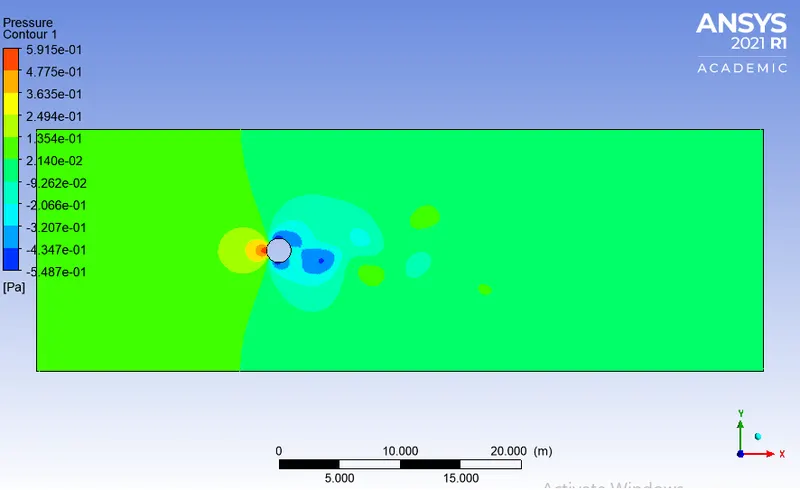
Comparison of all cases
| Steady-state simulation | Lift coefficient | Drag coefficient |
| Reynolds number 10 | 0.00094 | 3.328 |
| Reynolds number 100 | 0.01 | 1.3428 |
| Reynolds number 1000 | 0.1 | 0.80 |
| Reynolds number 10000 | 0.30 | 0.75 |
| Reynolds number 100000 | 0.18 | 0.18 |
Effect of Reynolds number on Drag Coefficient (`C_d`)
It can be inferred that as the Reynolds number increases, the drag coefficient decreases.
| Transient-state simulation | Lift coefficient | Drag coefficient |
| Reynolds number 100 | 0.175 | 1.3 |
Conclusion
- The flow pattern was observed for different Reynolds numbers ranging from (10 to 100000).
- The simulation was done for the steady and the transient state.
- It was observed that for the steady-state (Reynolds number 10), the solution settles down, converges at iteration 600, and reaches to steady-state. For low Reynolds number, vortex shedding is not observed but the boundary layer separation is seen.
- For Reynolds number higher than 80 ( at Reynolds number 100), swirling vortices are observed for the steady-state.
- The increase in Reynolds number (by increasing the velocity and keeping other parameters constant) will result in a decrease in the boundary layer for the steady-state which causes a decrease in recirculation behind the cylinder.
- As the Reynolds number increases the coefficient of drag decreases because `c_dpropfrac{1}{R_e}` .
- The Strouhal Number cannot be calculated for the steady-state because the parameters were not dependent on time.
- The simulation was carried for the transient state at Reynolds number 100, fluid velocity `1frac{m}{sec}`, the swirling vortices are observed and the shedding frequency was calculated because the parameters were dependent on time.
- The Strouhal number for the transient state is calculated as 0.16 and found to be nearly equal to the graph value.
- For observing the flow pattern behind the cylinder video file, contour plots have been uploaded.
- The lift coefficient graph for the transient case never settles down and keeps on oscillating with an increase in time, but in a steady case, after some iteration, the graph converges to a particular value.
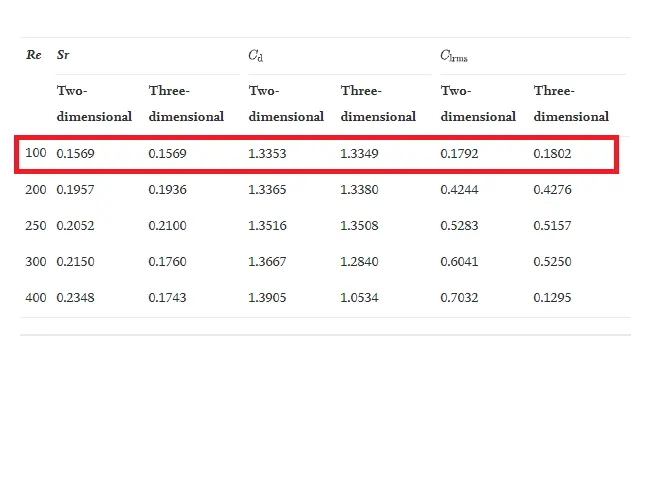
- The results were validated with the experimental data and the error appears to be less than 5%.
Referred material: https://imechanica.org/files/Sato_MDAC_final_2232012.pdf