Simulating Rayleigh-Taylor instability in Ansys Fluent.
Aim: The aim of this project is as follows:
- To discuss about the about the different CFD models that are based on the mathematical analysis of Rayleigh Taylor instability.
- Perform three different cases of CFD simulation of Rayleigh Taylor instability using Ansys Fluent.
- Discuss about Atwood number and how it affects the different cases of the performed simulations in Ansys Fluent.
Rayleigh-Taylor instability: - This phenomenon occurs when two fluids of different densities relatively push on each other. It is a dynamic process where the two fluids seek to reduce their combined potential energy and thus the potential energy of the configuration is lower than the initial state.
Once the progress takes place from the initial conditions and the instability develops, there is a disturbance developed at the interface. The disturbance grows from a linear growth phase to a non-linear growth phase. In the linear phase, the fluid movement can be closely approximated by linear equations. However, in the non-linear phase, the perturbations caused due to the disturbances start developing amplitudes that are too large for a linear approximation. Hence, non-linear equations are used to describe the fluid motion.
The examples for Rayleigh Taylor instability ranges from a small scale occurrence like the behaviour of water being suspended above oil influenced by the Earth’s gravity, large scale occurrences like the mushroom clouds formed by the volcanic eruptions and nuclear explosions. It even occurs in an interstellar scale where within a supernova explosion, the inner gas with higher density expands into the gases with lesser density at the outer layers.
The following are some of the practical CFD models that are based on the mathematical analysis of the Rayleigh Taylor instability.
Richtmyer-Meshkov instability: - The phenomenon usually occurs when two fluids of different densities are impulsively accelerated by the passage of a shock wave. Upon initial developments, the initial bubble would grow in an oscillatory way until a constant asymptotic normal velocity is achieved when both wavefronts are at sufficient distance from the contact surface.
A development of nonlinear regime with bubbles appearing would appear in the case of a light fluid penetrates a heavy fluid, and spikes appear in case of a heavy fluid penetrates a light fluid. The hydrodynamic flows associated with this instability is important in all physical environments in which shocks/rarefaction fronts in vehicles that transfer energy to the material.
This particular model can be used CFD analysis that involve impulsive accelerations of the fluids that induces shocks in the cases under study.
Kelvin-Helmholtz instability: - This phenomenon is seen when there are two inviscid and incompressible fluids of different densities are flowing parallelly in opposite directions. Since there is a difference of velocity at the interface, there is a vorticity developed. This vorticity further induces velocity in wave like patterns. At the undisturbed part of the wave, the vorticity induces a rotational velocity which amplifies the wave and causes the instability to grow.
A good example for this phenomenon is the patterns formed in the clouds where the air current and the cloud movement are in the opposite directions. It is shown in Fig 1.
This is a flow-specific phenomenon where the flow is strongly affected by specific features of the flow such as shear, gravity, viscosity, relative velocities of the fluids involved and the fluid densities. Hence, this particular model can be used in the CFD analysis satisfying the shearing conditions of the case under study.
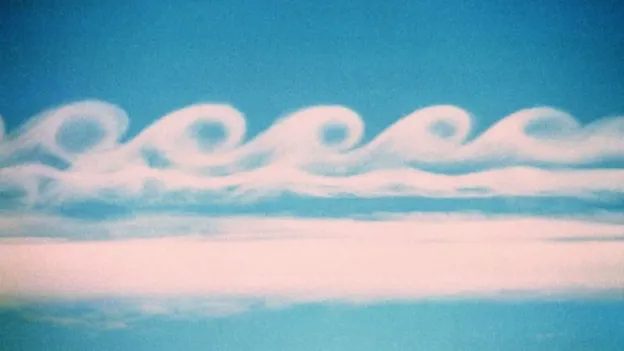
Fig 1: Patterns in cloud formations due to the Kelvin-Helmholtz instability.
Plateau-Rayleigh instability: - This phenomenon can be considered as a subset of the Rayleigh-Taylor instability where it is concerned with the fluid thread breakup when a falling stream of fluid breaks up into smaller packets with same volume but with lesser surface area.
It can be understood with an example where a small stream of water is leaking out of a tap. There is a vibration in the liquid stream because of the friction between the nozzle of the tap and the water stream itself. There are perturbations in the water stream which can be resolved into sinusoidal components. It can be seen that some of these components grow with time and some others decay with time. The Fig 2 shows the Plateau Rayleigh instability in the flowing jet of a water stream.
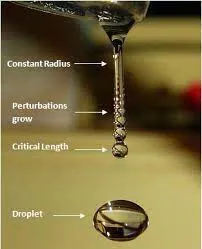
Fig 2: Plateau Rayleigh instability.
Simulating Rayleigh-Taylor instability in Ansys Fluent: -
Case 1: - Fluids: Water and Air. Grid: Coarse.
Geometry creation: -
The simulation is done in a 2D domain. A simple geometry is created in the Ansys SpaceClaim with 20mmx20mm conjoined domains. Fig 3. Shows the Geometry.
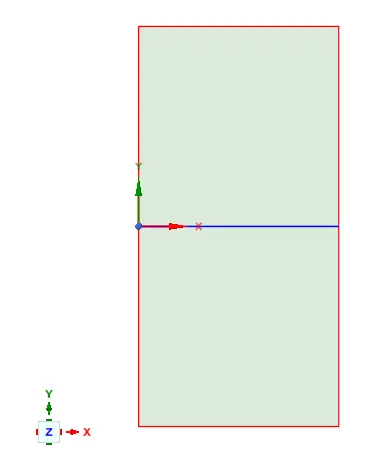
Fig 3: - 2D domain designed for the analysis.
Before moving on to the next step, it was ensured that the share topology is enabled.
Meshing: -
A coarse grid is created with the element sizing set to 0.5mm. Fig 4: shows the mesh generated. It is ensured that the mesh generated is a conforming mesh between the two domains.
The two domains are named: “water” for the top domain and “air” for the bottom domain. This is done to ease the assigning of material properties in the solution setup.
The number of nodes and elements are 3321 and 3200 respectively.
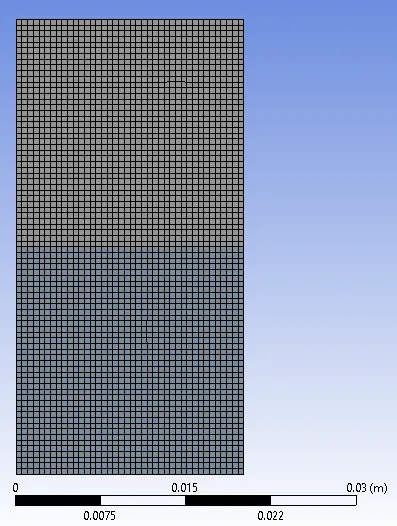
Fig 4: - Coarse mesh for case 1.
Solution setup: -
Following are the setups done to run the solution.
- Transient state analysis is chosen.
- Gravity is enabled and set to -9.81 m/s2 in y-direction with reference to Fig 3.
- Pressure based solver is used.
- The viscous model is set to laminar.
- Multiphase model is enabled, and the model is set to Volume of Fluid. Implicit formulation is used.
- The material properties of air and water are defined as it is in the Fluent database.
- Two different phases are named with the names “water” and “air” with the respective material properties.
- The water and air materials are assigned to the respective cell zones.
- The solution is initialized with the standard initialization.
- The patch option is used to patch the volume fraction of water set to 1 for the water zone, and volume fraction of water is set to 0 for the air zone.
- The contour to capture the phases for water and air is created. And an animation to capture this contour plot for each time step is created.
- The solution is run for 500 time steps with the time step size set to 0.005. The max number of iterations per time step is set to 20.
The video link attached below shows the result obtained from running the solution.
Case 2: - Fluids: Water and Air. Grid: Fine.
The exact same geometry and the solution setup is used to run the case 2. The only difference will be the mesh density being finer. The element size was set to 0.25mm. Fig 5 shows the mesh generated.
The number of nodes and elements are 13041 and 12800 respectively.
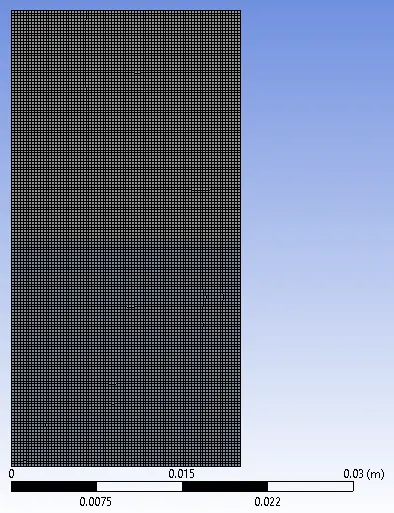
Fig 5: Refined mesh with element size 0.25mm.
The video link attached below shows the result obtained from running the solution for case 2.
Case 3: - Fluids: Water and User Defined Fluid. Grid: Fine.
Case 3 is run with almost identical setup as case 2. There are 2 major differences
- The material properties that are set for the domain named “air”. The material properties are changed as following:
- Density = 400 kg/m3
- Viscosity = 0.001 kg/m-s
- The solution was run for 800 time steps instead of 500 as in case 1 and 2.
The video link attached below shows the result obtained from running the solution for case 3.
Atwood number and its significance in Rayleigh-Taylor instability: -
Atwood number is a dimensionless number that gives the ratio between the difference between the densities of two fluids and the sum of their densities. It is expressed as follows:
`A=(ρ_1-ρ_2)/(ρ_1+ρ_2 )`
Where,
A -> Atwood number,
`rho_1` -> Density of the heavier fluid, and
`rho_2` -> Density of the lighter fluid.
The Atwood numbers for our two cases are as follows:
Case 1 and 2:
Density of water: 998.2 kg/m3
Density of air: 1.7894e-05 kg/m3
Atwood number = 0.999999964
Case 3:
Density of water: 998.2 kg/m3
Density of User Defined Fluid: 400 kg/m3
Atwood number = 0.42783
The Atwood number gives the idea of the penetration distance and the time in case studies of Rayleigh Taylor instabilities. Usually, when Atwood number is closer to the value of 1, it the time taken for the penetration of heavier liquid is less, and when the Atwood number is closer to the value 0, the time taken is more.
In our test cases, it can be seen in the videos for cases 2 and 3, that for a lower value of the Atwood number, the time it takes for the perturbations/waves to form is higher.