Project 2 - Rankine cycle Simulator
OBJECTIVE
- To understand the concept of the Rankine cycle and to Create a Rankine Cycle Simulator in Matlab.
- To plot the corresponding T-s and h-s plots for the given set of inputs.
Given data:
Turbine Inlet temperature = T1 = 400° C.
Turbine Inlet Pressure = P1 = 30 bars.
Turbine Outlet Pressure = P2 = 0.05 bars.
EQUATIONS USED
Work is done at the pump will be calculated as.
`W_P = h4-h3`.
Work is done at the Turbine will be calculated as.
`W_T=h1-h2`.
The Net-work done will be calculated as.
`W_"net"=W_P-W_T`
The efficiency of the cycle will be calculated.
`eta=(W_T-W_P)/(Q_i)*100`.
The heat input.
`Q_"in"=h1-h4`
The heat output.
`Q_"out"=h2-h3`.
Back work ratio.
`"BWR"=W_P/W_T`.
Specific steam consumption of the turbine.
`"SSC"=W_"net"/3600`.
Where,
h1, h2, h3, h4 are the enthalpies at state points 1, 2, 3, 4 respectively.
RANKINE CYCLE
The Rankine cycle is the ideal thermodynamic cycle for vapor power plants that converts heat into mechanical work. Both electricity is produced from the turbine as well as heat is rejected from the condenser as illustrated in Fig.
1-2 Isentropic expansion in a turbine.
Expansion of the vapor in the turbine will be an isentropic process.
2-3 Constant pressure heat rejection in a condenser.
Condensation of the vapor in the condenser during this process pressure will be constant and heat is rejected.
3-4 Isentropic compression in a pump.
Compression of the fluid to high pressure using a pump will be an isentropic process.
4-1 Constant pressure heat addition in the boiler.
The compressed fluid is heated to the final temperature which is at boiling point, therefore, a phase change occurs—from liquid to vapor.
In this cycle, water is fed through the piper toward the boiler. In conventional steam-electric plants, the condenser removes the latent heat of vaporization from the incoming steam and uses that enthalpy to preheat the feedwater to reduce irreversibilities involved in the cycle. This allows for improving the thermodynamic efficiency of the system. Once the water is inside the boiler, it goes under extreme heat and pressure, converting the water to steam and adding the latent heat of vaporization. The water in the boiler passes through the economizer, which is a section in the convection pass. Then, it goes to the steam drum and eventually turns into steam through the water walls. Steam separators block any water droplets from entering the turbine as that causes damage and erosion. Only steam goes through to the turbine. The steam powers a high-pressure turbine followed by a low-pressure turbine, which generates electricity. As the condenser also ejects heat.
PROCEDURE
- Let's start with the regular clear commands close all, clear all, and clc.
- then, by using the 'fprintf' command we are going to print some titles like the Rankine cycle and then followed by the process of what is going on in the Rankine cycle will be printed.
- here, actually, we need to calculate the enthalpies at all the state points so that we can calculate the efficiency of the cycle and back work ratio, and specific steam consumption.
- we have the 'XSteam' table to calculate all the values for enthalpy, entropy, and temperatures.
- here, just we need to know how to fetch the data from the steam table which is available in the directory.
- Now we are going to assign for the user inputs by using the 'fprintf' command to enter the pressure1 which is the turbine inlet pressure, the temperature at the inlet of the turbine i.e, P1=input('\n Enter the pressure at the inlet of turbine (in bar) :')
T1=input('\n Enter the temperature at the inlet of turbine (in degree celcius) :')
P2=input('\n Enter the pressure at the outlet of turbine (in bar) :') - for the state variables at state point 1, we are going to fetch the values for saturated enthalpy of fluid, vapour, and the enthalpy as the function of pressure and temperature and then we are also fetching the values for saturated entropy of the fluid, vapour, and the entropy as the function of pressure and temperature. i.e, hg1 = XSteam('hv_p',P1), hf1 = XSteam('hL_p',P1), h1 = XSteam('h_pt',P1,T1), s1 = XSteam('s_pt',P1,T1), sf1 = XSteam('sL_p',P1,T1), sg1=XSteam('sV_p',P1,T1), vf1 = XSteam('v_pt',P1,T1), cps = XSteam('cp_pt',P1,T1), Tsat1=XSteam('Tsat_p',P1). from the XSteam table we can obtain all these things.
-
And at state point 2, the entropy will be the same as in the state point 1 because the process is Isentropic here the entropy will be constant so we can directly take entropy as, s1 = s2, and the remaining is the pressure will and also here we need to calculate for the dry fraction the vapour. In order to calculate the dry fraction we have a formula x=((s2-sf2)/(sf2-sg2)) we are using this equation and other values can be taken from the steam table. And also we are going to get the values for hg2 = XSteam('hv_p',P2), hf2 = XSteam('hL_p',P2), sf2=XSteam('sL_p',P2), sg2=XSteam('sV_p',P2), hfg2=hf2-hg2, h2=(hf2+x*hfg2), T2=XSteam('T_ph',P2,h2), Tsat2=XSteam('Tsat_p',P2).
- Next, we are going to get the values for state point 3, where the pressure will be equal to the pressure at point 1 because the process will be Isobaric that is constant pressure heat rejection process so, P3=P2 and hg3=XSteam('hV_p',P3), hf3=XSteam('hL_p',P3), h3=hf3, sg3=XSteam('sV_p',P3), sf3=XSteam('sL_p',P3), here the entropy will be equal to the saturated entropy of the fluid so, s3=sf3 and specific volume of the fluid at point vf3=XSteam('vL_p',P3). and here the temperature will be the same as at point 2, therefore we are taking T3=T2.
- And then we are going to get the value for state point 4, where the pressure will be the same as in point 1, because 4 to 1 will be the constant pressure heat addition process so, we can take the pressure as P4=P1 and then the entropy will be same as in the point 3, because the process is Isentropic compression process so, s4=s3 and then we are fetching the values for h4=(vf3*(P4-P3))+h3, hg4=XSteam('hV_p',P4), hf4=XSteam('hL_p',P4), sg4=XSteam('sV_p',P4), sf4=XSteam('sL_p',P4), T4=XSteam('T_ps',P4,s4).
- Now, we got all the values of enthalpy, entropy, and the temperature and then we are going to calculate work done at the turbine, wor done at the pump, net-work done and the efficiency of the cycle, back work ratio, and specific steam consumption at the turbine. That is work done at the turbine W_T=(h1-h2), pump work will be W_P=(h4-h3), net-work done will be W_NET=(W_T-W_P), and the heat input will be Q_input=(h1-h4), Work_efficiency=((W_T-W_P)/(Q_input))*100, and back work ratio will be B_WR=W_P/W_T, and SSC=W_NET/3600 this consumption of steam will be for one hour.
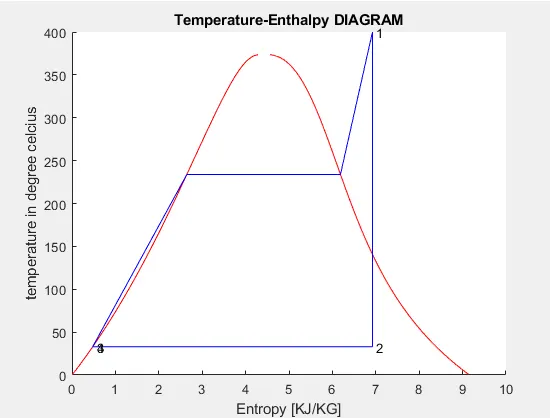
- Now, we have to draw the T-s, and h-s plots so to make the plots we are taking the values for temperature using the 'linspace' command and we are taking 500 values of temperature between 0 and 400 and we are storing it in t, i.e, t=linspace(0,400,500) next we need to calculate for the entropy of the fluid and vapor for 500 values of temperature so, we are creating a 'for' loop and then we are going to calculate for 1 to the length of t, i.e, i=1:length(t) thais will be for 500 values and then we are going to fetch the values from the steam table i.e, s_L(i)=XSteam('sL_T',t(i)), s_V(i)=XSteam('sV_T',t(i)) and here we can end the loop. And then we will plot the saturation curve in T-s plot in figure 1 and also we need to plot the Rankine cycle for that we need to calculate the saturation entropies of the fluid and vapor stage at the constant pressure heat addition process, and we can get it from the steam table only i.e, s_sat2 = XSteam('sV_p',P1), s_sat1 = XSteam('sL_p',P1) and then only we can able to make the cycle plot. The cycle plot can be done by using the plot command i.e, plot([s1,s2,s3,s4,s_sat1,s_sat2,s1],[T1,T2,T3,T4,Tsat1,Tsat1,T1],'b') here the entropies and temperature values are in their respective points.
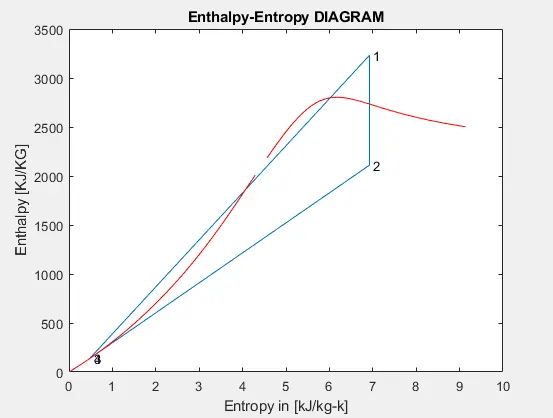
- And we also need to make the h-s plot for that we are using the plot command and plotting it in figure 2 i.e, plot([s1,s2,s3,s4,s1],[h1,h2,h3,h4,h1]) the entropies values are with respect entalpies values. And also we need to draw the saturation curve for h-s plot so that can be done by calculating the values of enthalpies at the taken temperature t and we already know the values for entropies and that can be done by creating a 'for' loop to get the values for enthalpies and then we can draw the saturation curve. Using plot command i.e, plot(s_L,h_L,'color','r'), plot(s_V,h_V,'color','r').
CODE
clear all
close all
clc


% WORKING PROCESS OF RANKINE CYCLE.

fprintf('             RANKINE CYCLE SIMULATOR  ');
fprintf('\n\n1-2 ISENTROPIC EXPANSION PROCESS AT THE TURBINE');
fprintf('\n2-3 CONSTANT PRESSURE HEAT REJECTION AT THE CONDENSOR');
fprintf('\n3-4 ISENTROPIC COMPRESION AT THE PUMP');
fprintf('\n4-1 CONSTANT PRESSURE HEAT AT THE BOILER ADDITION');


% USER INPUTS

P1=input('\n Enter the pressure at the inlet of turbine (in bar) :')
T1=input('\n Enter the temperature at the inlet of turbine (in degree celcius) :')
P2=input('\n Enter the pressure at the outlet of turbine (in bar) :')

% STATE VARIABLES AT THE STATE POINT1.
disp('STATE VARIABLES AT THE STATE POINT1.')
% CALCULATING THE h,s, and T values or EXTRACTING FROM THE XSteam table.

hg1 = XSteam('hv_p',P1);
hf1 = XSteam('hL_p',P1);
h1 = XSteam('h_pt',P1,T1);
s1 = XSteam('s_pt',P1,T1);
sf1 = XSteam('sL_p',P1,T1);
sg1=XSteam('sV_p',P1,T1);
vf1 = XSteam('v_pt',P1,T1);
cps = XSteam('cp_pt',P1,T1);
Tsat1=XSteam('Tsat_p',P1);
fprintf('\n P1 is: %f bar',P1)
fprintf('\n T1 is: %f Deg celcius',T1)
fprintf('\n h1 is: %f kj/kg',h1)
fprintf('\n s1 is: %f kj/kg-k',s1)


% STATE VARIABLES AT THE STATE POINT2.

fprintf('\n\n STATE VARIABLES AT THE STATE POINT2.')

hg2 = XSteam('hv_p',P2);
hf2 = XSteam('hL_p',P2);

s2=s1;
sf2=XSteam('sL_p',P2);
sg2=XSteam('sV_p',P2);

hfg2=hf2-hg2;

% INORDER TO FIND THE DRY FRACTION
x=((s2-sf2)/(sf2-sg2));

h2=(hf2+x*hfg2);

T2=XSteam('T_ph',P2,h2);

Tsat2=XSteam('Tsat_p',P2);

fprintf('\n P2 is: %f bar',P2)
fprintf('\n T2 is: %f Deg celcius',T2)
fprintf('\n h2 is: %f kj/kg',h2)
fprintf('\n s2 is: %f kj/kg-k',s2)

% STATE VARIABLES AT THE STATE POINT3.
fprintf('\n\n STATE VARIABLES AT THE STATE POINT3.')
P3=P2;
T3=T2;

hg3=XSteam('hV_p',P3);
hf3=XSteam('hL_p',P3);
h3=hf3;

sg3=XSteam('sV_p',P3);
sf3=XSteam('sL_p',P3);
s3=sf3;

vf3=XSteam('vL_p',P3);

fprintf('\n P3 is: %f bar',P3)
fprintf('\n T3 is: %f Deg celcius',T3)
fprintf('\n h3 is: %f kj/kg',h3)
fprintf('\n s3 is: %f kj/kg-k',s3)

% STATE VARIABLES AT THE STATE POINT4.
fprintf('\n\n STATE VARIABLES AT THE STATE POINT4.')
% HERE WE ARE CONSIDERING THE WORK DONE BY THE PUMP TO GET THE VALUE FOR
% h4.
P4=P1;

h4=(vf3*(P4-P3))+h3;
hg4=XSteam('hV_p',P4);
hf4=XSteam('hL_p',P4);


s4=s3;
sg4=XSteam('sV_p',P4);
sf4=XSteam('sL_p',P4);
T4=XSteam('T_ps',P4,s4);

fprintf('\n P4 is: %f bar',P4)
fprintf('\n T4 is: %f Deg celcius',T4)
fprintf('\n h4 is: %f kj/kg',h4)
fprintf('\n s4 is: %f kj/kg-k',s4)

fprintf('\n\n CALCULATIONS')
% CALCULATIONS
% WORK DONE AT THE TURBINE.
W_T=(h1-h2);
fprintf('\n W_T : %f kj/kg',W_T)

% WORK DONE AT THE PUMP.
W_P=(h4-h3);
fprintf('\n W_P : %f kj/kg',W_P)

% NET WORK DONE.
W_NET=(W_T-W_P);
fprintf('\n W_NET : %f kj/kg',W_NET)

% HEAT INPUT
Q_input=(h1-h4);

% HEAT OUTPUT OR THE HEAT REJECTED
Q_out=(h2-h3);

% EFFICIENCY OF THE RANKINE CYCLE.
Work_efficiency=((W_T-W_P)/(Q_input))*100;
fprintf('\n Work efficiency : %f ',Work_efficiency)

% BACK WORK RATIO.
B_WR=W_P/W_T;
fprintf('\n Back work ratio : %f ',B_WR)

% SPECIFIC STEAM CONSUMPTION BY THE TURBINE.
SSC=W_NET/3600;
fprintf('\n SSC : %f kj/kg',SSC)

% PLOTTING TEMPERATURE VS ENTROPY.

% SATURATION CURVE PLOT.
t=linspace(0,400,500);
figure(1)
hold on
for i=1:length(t)

    s_L(i)=XSteam('sL_T',t(i));
    s_V(i)=XSteam('sV_T',t(i));

end

plot(s_L,t,'color','r')
plot(s_V,t,'color','r')

% CYCLE PLOT
s_sat2 = XSteam('sV_p',P1);
s_sat1 = XSteam('sL_p',P1);
%
% plot([s_sat2 s_sat1 s1 s2 s3 s4 s_sat2],[Tsat1 Tsat1 T1 T2 T3 T4 Tsat1],'b')
ylabel('temperature')
xlabel('Entropy [KJ/KG]')
title('Temperature-Enthalpy DIAGRAM')
plot([s1,s2,s3,s4,s_sat1,s_sat2,s1],[T1,T2,T3,T4,Tsat1,Tsat1,T1],'b')
text(s1,T1,' 1')
text(s2,T2,' 2')
text(s3,T3,' 3')
text(s4,T4,' 4')


figure(2)
plot([s1,s2,s3,s4,s1],[h1,h2,h3,h4,h1])
ylabel('Enthalpy [KJ/KG]')
xlabel('Entropy in [kJ/kg-k]')
title('Enthalpy-Entropy DIAGRAM')
text(s1,h1,' 1')
text(s2,h2,' 2')
text(s3,h3,' 3')
text(s4,h4,' 4')

hold on
for j=1:length(t)

    h_L(j)=XSteam('hL_T',t(j));
    h_V(j)=XSteam('hV_T',t(j));

end
plot(s_L,h_L,'color','r')
plot(s_V,h_V,'color','r')
OUTPUT
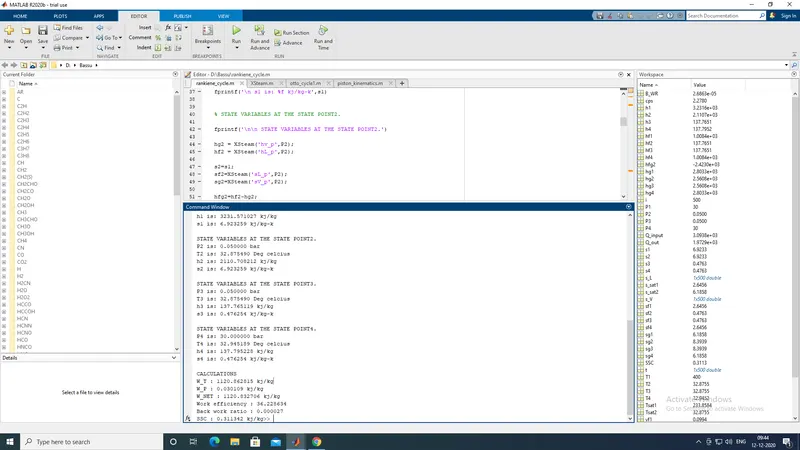
The screenshot attached here is the output shown in the command window.
Plots
CONCLUSION
It was due to this project I came to know how does the Rankine cycle works in practice and then,
Created the Rankine cycle simulator using Matlab.
Created the plots for T-s and h-s diagram.
REFERENCES
https://energyeducation.ca/encyclopedia/Rankine_cycle
http://thermopedia.com/content/1072/