Project 1 - Parsing NASA thermodynamic data
PROJECT 1 : PARSING NASA THERMODYNAMIC DATA
AIM:
1. To parse the 'THERMO.dat' file which contains data extracted by the NASA.
2. Write a code to extract 14 temperature co-efficients(7 high and 7 low temperature)
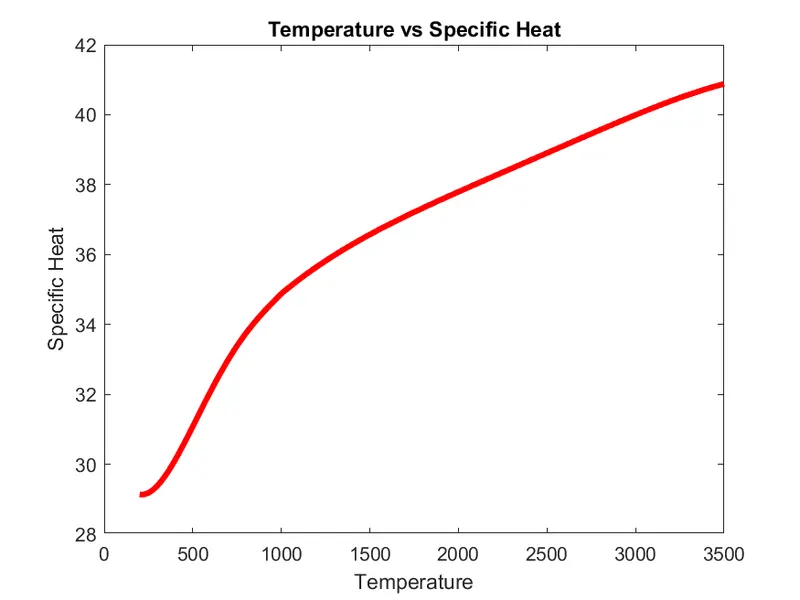
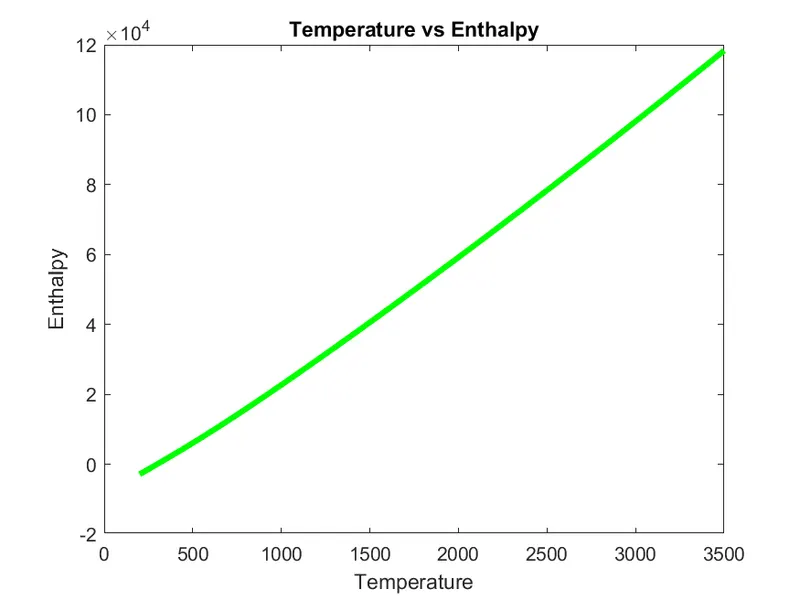
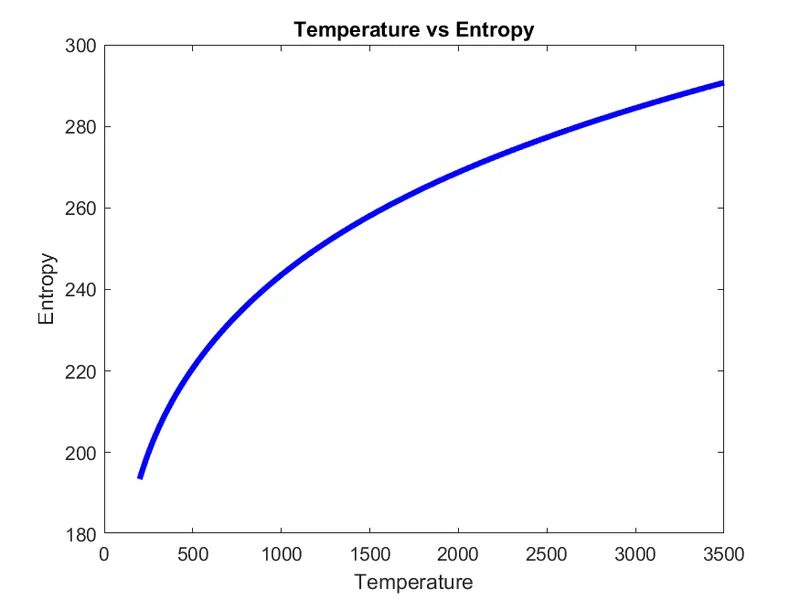
3. Write a code to plot T vs Cp, S, H for all the 53 species given in the dat file.
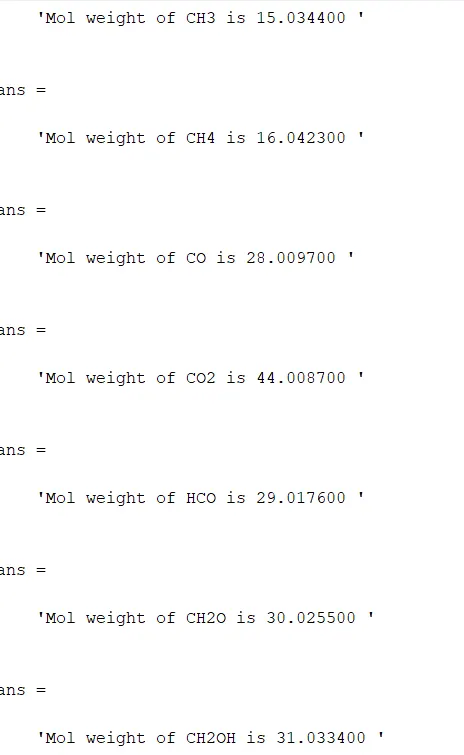
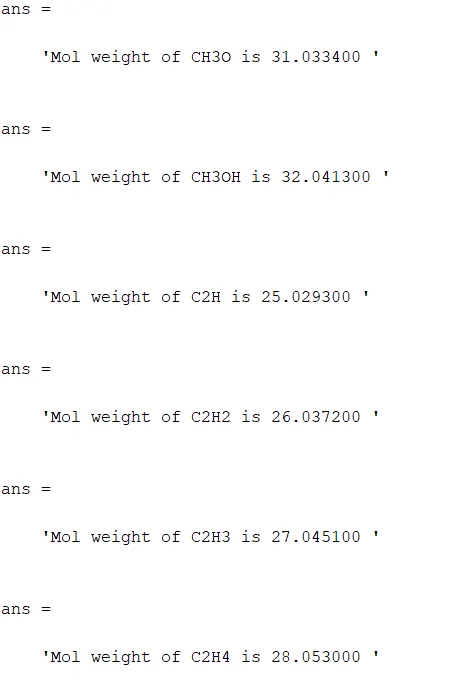
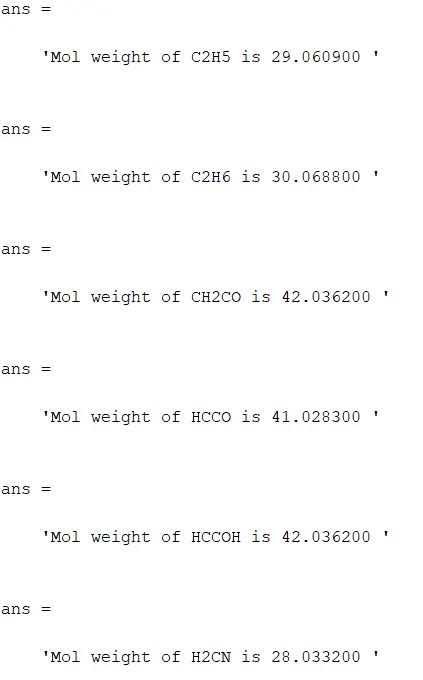
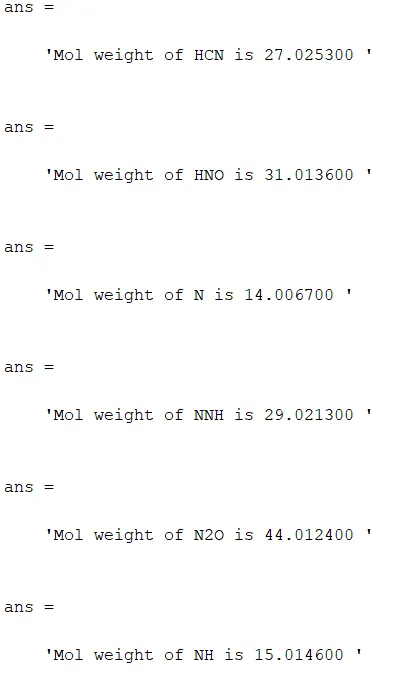
4. Write a code to calculate the molecular weight of the species.
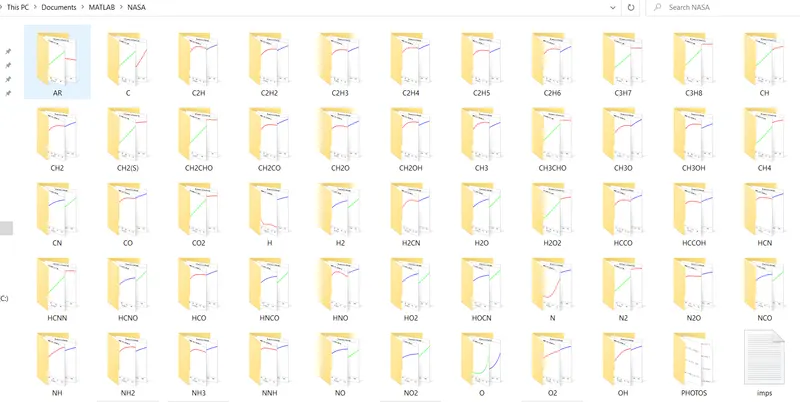
5. Write a code to save the plots for all the 53 species in a folder and attach the folder location.
PROCEDURE:
1. Opening the data file THERMO.dat using fopen.
2. Ignoring the first 5 lines as it does not have useful data for the program.
3. Writing a code for one species and then doing the same for the next 52 species.
4. Reading the 6th line or the 1st line of the species data for getting the species name and Global temperature range which will be plotted in x-axis
5. Reading the 2nd 3rd and 4th line of the species data using string commands (findstr,str2num) to find the temperature co-efficients from (a1 - a14)
6. Finding the values of CP , H and S.
7. Plotting the graph for temperature vs CP,H and S.
8. Finding the molecular weight of the species using strcmp and atomic weights concepts.
9. Saving the figures in a folder with the name of its respective species name
10. Repeating the same for 52 other species using forloop
MATLAB CODE:
%PARSING NASA DATA

clear all;
close all;
clc

T = fopen('THERMO.dat','r'); %read THERMO.dat file

for i = 1:5                 %ignore first 5 lines
ignore = fgetl(T);
end

for i = 1:53


%SPECIES NAME

St = fgetl(T);              %getting the 6th line (1st line after 5th line)
Q = strfind(St,' ');        %searches for the space in the line and assigns num of character before the space as a value)
species_name = St(1:Q(1)-1); %finds the species name

%extracting temp ranges

t1 = St(49:56);             %49th column to 56th column gives t1
t2 = St(58:66);
t3 = St(68:76);

t1 = str2num(t1);            %str2num converts the string to number (low temperature)
t2 = str2num(t2);            %high temperature
t3 = str2num(t3);            %mid temperature

%extracting co-effs

%FIRST LINE FROM 3 LINES

A = fgetl(T);               %assigns the next line -  7th line to the variable A
a1 = A(1:15);               %writes 2nd column to 15th column string to a1
a2 = A(16:30);
a3 = A(31:45);
a4 = A(46:60);
a5 = A(61:75);

%2ND LINE FROM 3 LINES

B = fgetl(T);               %assigns the next line -  8th line to the variable B
a6 = B(1:15);
a7 = B(16:30);
a8 = B(31:45);
a9 = B(46:60);
a10 = B(61:75);

%3RD LINE FROM 3 LINES

C = fgetl(T);               %assigns the next line -  9th line to the variable C
a11 = C(1:15);
a12 = C(16:30);
a13 = C(31:45);
a14 = C(46:60);


a1 = str2num(a1);
a2 = str2num(a2);
a3 = str2num(a3);
a4 = str2num(a4);
a5 = str2num(a5);
a6 = str2num(a6);
a7 = str2num(a7);
a8 = str2num(a8);
a9 = str2num(a9);
a10 = str2num(a10);
a11 = str2num(a11);
a12 = str2num(a12);
a13 = str2num(a13);
a14 = str2num(a14);

%range calculation

TR = linspace(t1,t2,1000);          %assigns the range from t1 to t2 of 1000 values to the variable TR

%CALCULATION OF ENTHALPY,ENTROPY AND SPECIFIC HEAT

R = 8.314;   %UNIVERSAL GAS CONSTANT

for j = 1:length(TR)

if TR(j) > t3

  CP(j) = (a1 + a2*TR(j) + a3*TR(j)^2 + a4*TR(j)^3 + a5.*TR(j)^4)*R;
  H(j) = (a1 + (a2*TR(j)/2) + ((a3*TR(j)^2)/3) + ((a4*TR(j)^3)/4) + ((a5.*TR(j)^4)/5) + (a6/TR(j)))*R*TR(j);
  S(j) = (a1*log(TR(j)) + a2*TR(j) + (a3*TR(j)^2)/2 + (a4*TR(j)^3)/3 + (a5*TR(j)^4)/4 + a7)*R;

else
  CP(j) = (a8 + a9*TR(j) + a10*TR(j)^2 + a11*TR(j)^3 + a12*TR(j)^4)*R;
  H(j) = (a8 + (a9*TR(j)/2) + ((a10*TR(j)^2)/3) + ((a11*TR(j)^3)/4) + ((a12.*TR(j)^4)/5) + (a13/TR(j)))*R*TR(j);
  S(j) = (a8*log(TR(j)) + a9*TR(j) + (a10*TR(j)^2)/2 + (a11*TR(j)^3)/3 + (a12*TR(j)^4)/4 + a14)*R;

end
end


%Molecular weight calculation

elements = ['H','C','O','N','A','S'];
atomic_weight = [1.0079 12.0107 15.999 14.0067 39.948 32.065];
mol_mass = 0;

for l = 1:length(species_name)
    for m = 1:length(atomic_weight)
        if strcmp(species_name(l),elements(m))
            mol_mass = mol_mass + atomic_weight(m);
            position = m;
        end
    end
    n = str2double(species_name(l));
    if n>1
        mol_mass = mol_mass + atomic_weight(position)*(n-1);
    end
end

%printing the molecular weight

sprintf('Mol weight of %s is %f ',species_name,mol_mass)

%creating a folder to save plots

mkdir(species_name)
cd(sprintf(species_name))

figure(1)
plot(TR,CP,'linewidth',3,'color','r')
xlabel('Temperature')
ylabel('Specific Heat')
title('Temperature vs Specific Heat')
saveas(figure(1),'temp vs CP.png')

figure(2)
plot(TR,H,'linewidth',3,'color','g')
xlabel('Temperature')
ylabel('Enthalpy')
title('Temperature vs Enthalpy')
saveas(figure(2),'temp vs H.png')

figure(3)
plot(TR,S,'linewidth',3,'color','b')
xlabel('Temperature')
ylabel('Entropy')
title('Temperature vs Entropy')
saveas(figure(3),'temp vs S.png')

%to change the cur directory

oldfolder = cd('C:\Users\vipre\Documents\MATLAB\NASA');

end
CODE DEFINITION:
T = fopen('THERMO.dat', 'r')
For i= 1: 5
IGNORE = fgetl(T)
end
The above command ignores the first 5 lines of the file since there is no inportant data to be extracted.
A= fgetl(T) %getting the 6th line
St= strfind(A, ' ')
This command searches for the first space and returns as a value which says number of characters till the first space.
SPECIES_NAME = A(1:AA(1) -1)
In this command, the AA(1) consists of value 2 which says the number or characters till the 1st space.
The command takes the value as
SPECIES_NAME = A(1:1)
that is 'O'
Extracting the global temperature range
The same line (6th) consists of temperature data which is unique to every 53 species. This data is extracted in the same way.
str2num(t1)
this command converts the string to number.
strcmp(str1,str2)
this command compares the 2 strings and assigns value 1 to true and 0 to false
str2double(str)
this command converts the string into double precision values
OUTPUT:
Folder Location:
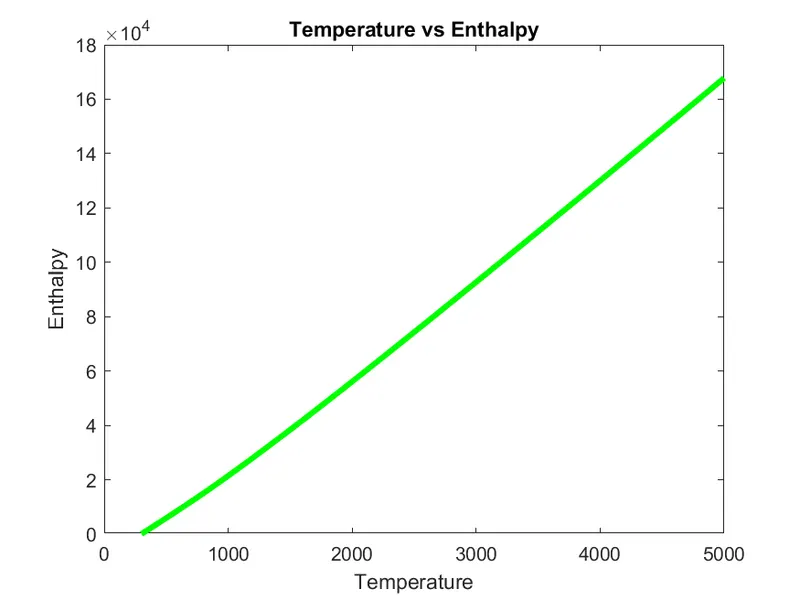
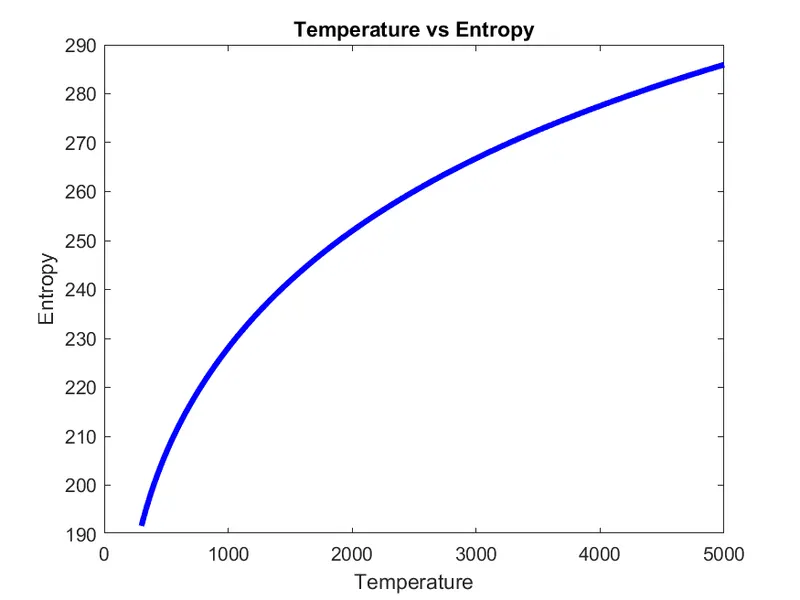
O2 plots
CO2 Plots:
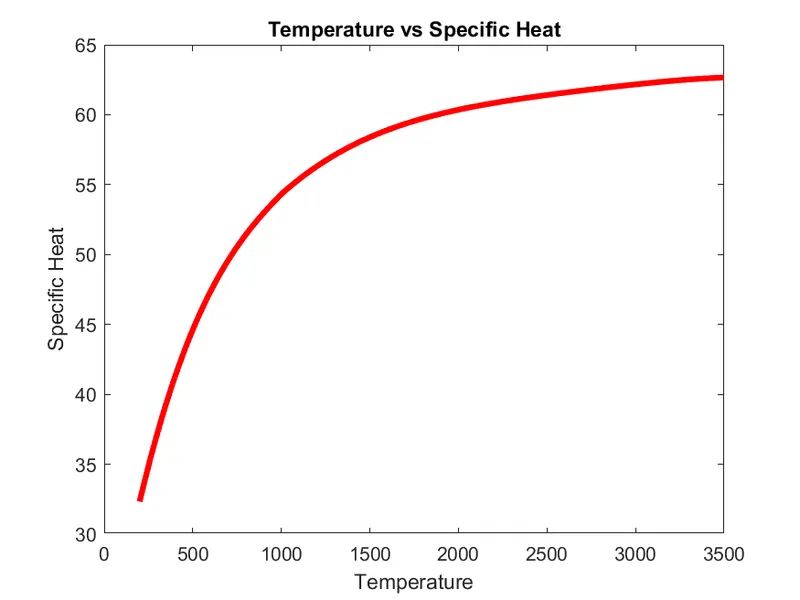
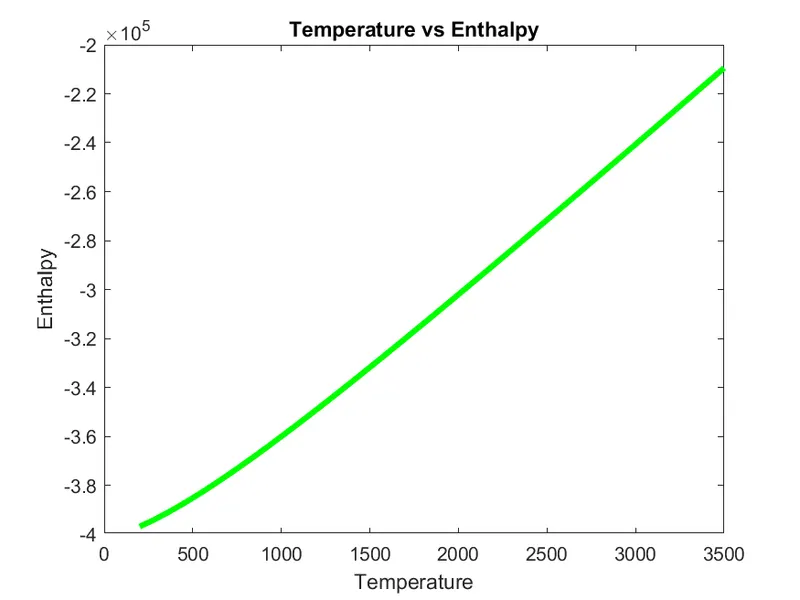
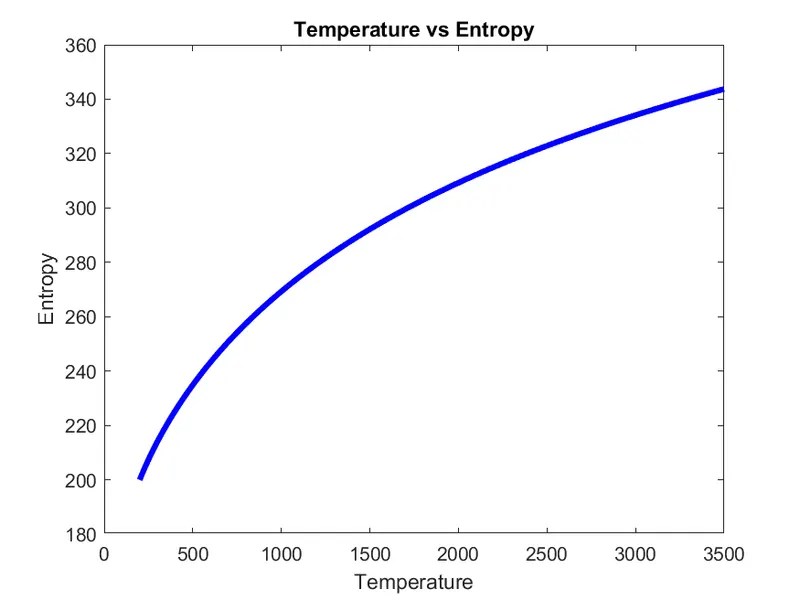
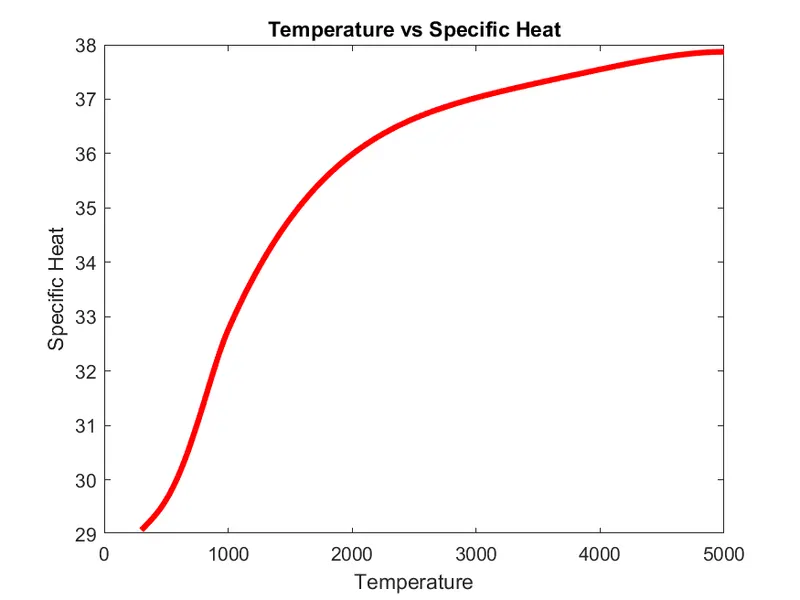
N2 Plots:
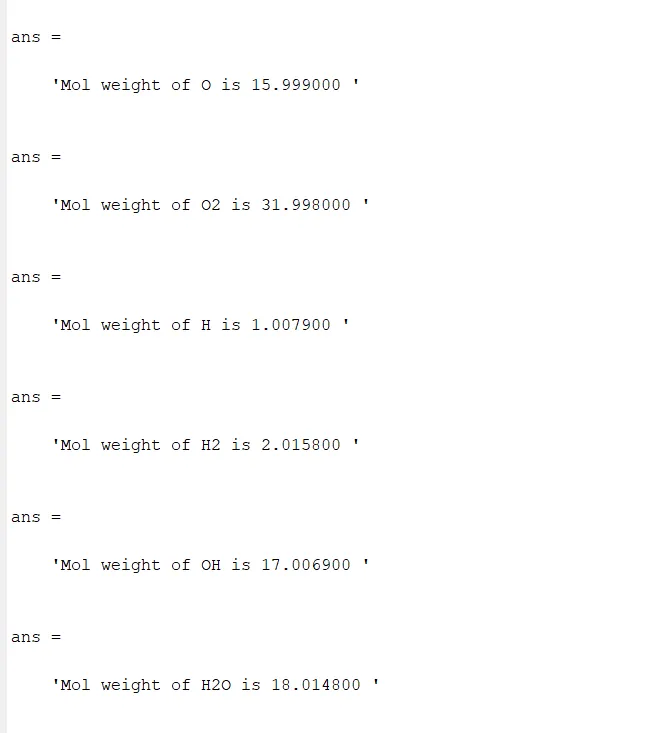
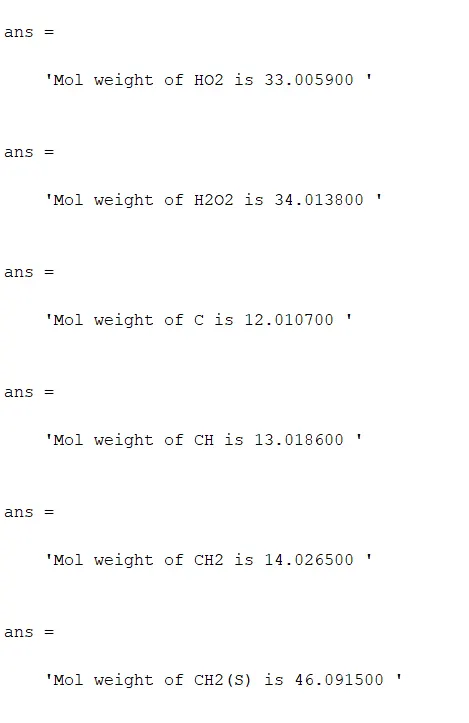
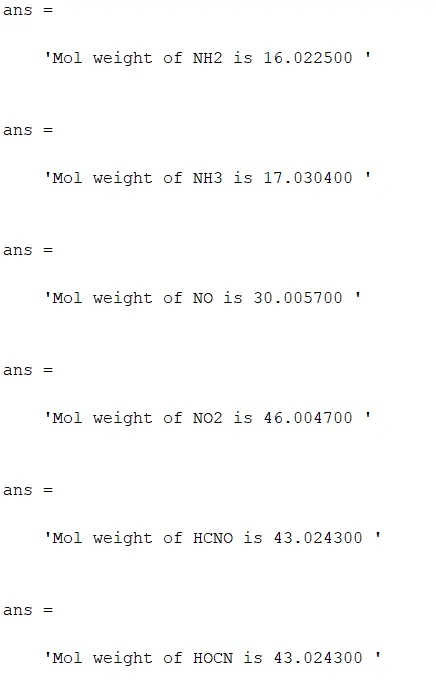
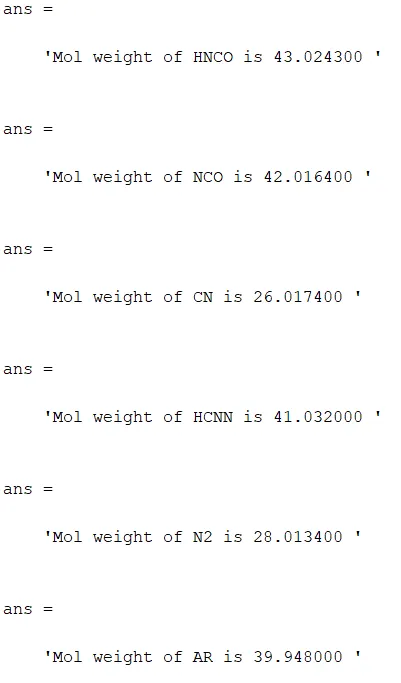
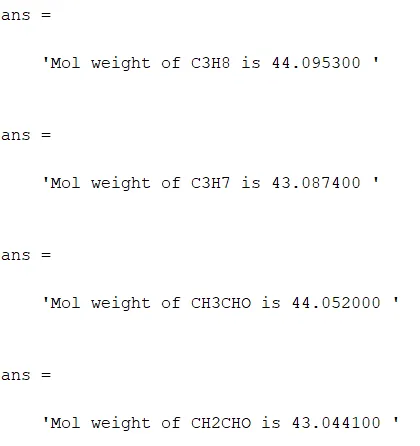
Molecular weight:
Error:

This error occured during the run as the formulas were not written in a correct format using brackets.
Conclusion:
1. The THERMO.dat file is read and the species specific datas are plotted for temperature vs CP. H and S and saved in a folder and the location is attached.
2. The molecular weight of each species is found and shown in the commabnd window.
3. The plots for O2,CO2 and N2 are attached.