Basics of Probability and Statistics Week 1 Challenge
1. Why there is a difference in formula of variance for population and sample.
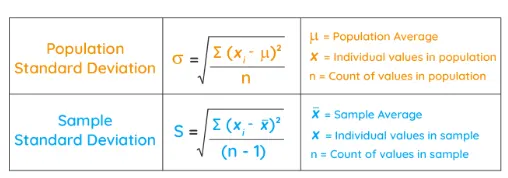
POPULATION STANDARD DEVIATION:
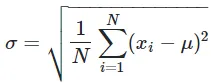
µ is the mean of the population of N values and xi denotes the values of the population.
SAMPLE STANDARD DEVIATION:
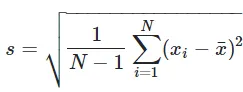
x(bar) is the mean of the sample of N values and xi denotes the values of the sample.
In some examples, when the mean of the population is unknown, it is difficult to find the standard deviation of the population. So in that case, we will take the samples and find the mean of the samples (xbar) to find the sample standard deviation. In such cases, the samples taken and the mean subtracted would give less results as the mean would be closer to the x value of the sample which would result in a biased answer. Hence dividing the numerator by N-1 would give approximately correct answer when compared to the biased answer with Denominator N.
2. Difference between stratified and clustered sampling
The major classification of sampling is as follows
1. Probability sampling method
Probability sampling technique involves selecting a random group of people from the population from which we can infer strong statistical data
2. Non probabality sampling method.
Non- probability sampling method involves selecting a non random group of people from the population based on the convenience or other criteria allowing to simply collect data
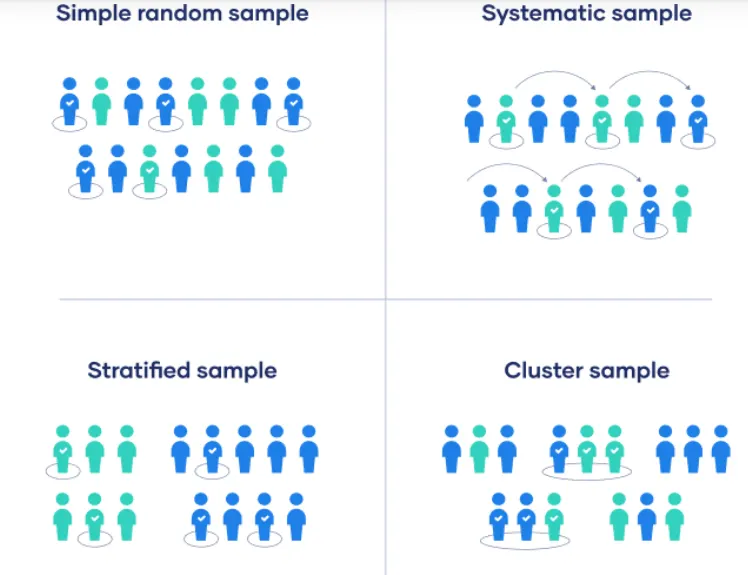
STRATIFIED SAMPLING:
It involves dividing the population into subpopulations that may differ in important ways. It allows you draw more precise conclusions by ensuring that every subgroup is properly represented in the sample.
To use this sampling method, you divide the population into subgroups (called strata) based on the relevant characteristic (e.g. gender, age range, income bracket, job role).
Based on the overall proportions of the population, you calculate how many people should be sampled from each subgroup. Then you use random or systematic sampling to select a sample from each subgroup.
Example:
The company has 800 female employees and 200 male employees. You want to ensure that the sample reflects the gender balance of the company, so you sort the population into two strata based on gender. Then you use random sampling on each group, selecting 80 women and 20 men, which gives you a representative sample of 100 people.
CLUSTERED SAMPLING:
It also involves dividing the population into subgroups, but each subgroup should have similar characteristics to the whole sample. Instead of sampling individuals from each subgroup, you randomly select entire subgroups.
If it is practically possible, you might include every individual from each sampled cluster. If the clusters themselves are large, you can also sample individuals from within each cluster using one of the techniques above. This is called multistage sampling.
This method is good for dealing with large and dispersed populations, but there is more risk of error in the sample, as there could be substantial differences between clusters. It’s difficult to guarantee that the sampled clusters are really representative of the whole population.
Example:
The company has offices in 10 cities across the country (all with roughly the same number of employees in similar roles). You don’t have the capacity to travel to every office to collect your data, so you use random sampling to select 3 offices – these are your clusters.
3. How many different samples can be created out of population of size n
Ans : C(N,n) - where N denotes the total population and n denotes the sample size
For example : 5,7,9,10,13,15 is the population , then for 3 samples, what is the number of possible sample of size 3? - 6c3 = 20 samples
4. What is the probability of drawing 2 jacks from a pack of card
Probability of drawing 2 jacks:
(Favorable events)
n = 4 jacks of 4 different color available. out of 4 , 2 to be selected hence the combination 4C2
(Total sample)
N = 52 cards
P(drawing 2 jacks) =4C2/52 = (4*3)/(1*2)/52 = 6/52
5. What is the probability that both the numbers on the dice are same while rolling two dice
Total number of events (N) = 6^2 (As 2 dice are rolled)
(1,1) (1,2) (1,3) (1,4) (1,5) (1,6)
(2,1) (2,2) (2,3) (2,4) (2,5) (2,6)
(3,1) (3,2) (3,3) (3,4) (3,5) (3,6)
(4,1) (4,2) (4,3) (4,4) (4,5) (4,6)
(5,1) (5,2) (5,3) (5,4) (5,5) (5,6)
(6,1) (6,2) (6,3) (6,4) (6,5) (6,6)
Favorable events (n) = (1,1) (2,2) (3,3) (4,4) (5,5) (6,6) = 6
P(both are same) = 6/36 = 1/6
6. Why standard deviation when variance can find the dispersion in the data?
Variance can give the dispersion or distribution of data in the population from the mean, where as the standard deviation tells the deviation of data from a mean.
Variance will have a square of the unit wheras the standard deviation will have the same unit as the sample units
eg. speed (m/s) , unit of mean (m/s) , unit of variance (m2/s2) , unit of standard deviation (m/s)
With standard deviation, one can infer how much the values are deviated from the mean better than variance.