Week 3 - Solving second order ODEs
AIM:
1) Show the characteristics of the pendulum for the given BCs
2) Create an animation
REPORT:
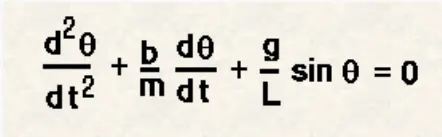
g = gravity in m/s2,
L = length of the pendulum in m,
m = mass of the ball in kg,
b=damping coefficient.
Given
L=1 metre,
m=1 kg,
b=0.05.
g=9.81 m/s2.
Initial conditions:
@t=0 s , ang disp = 0 , ang velocity = 3 rad/s
Converting higher order differntiation to lower order:
theta1 = dtheta/dt-------------1
theta2 = dtheta1/dt------------2
sub 1 and 2 in main equation:
dtheta1/dt + (b/m)theta1 + g/l*theta = 0
PYTHON CODE WITH STEP WISE EXPLANATION
import math        					#for sin and cosine functions
import matplotlib.pyplot as plt     #plotting the graphs
from scipy.integrate import odeint	#for integrating the ODE
import numpy as np					#to use linspace command

#2nd order characterestic equation

def model(theta,t,b,g,m,l): 							#defining the function which has variables - time,mass,length and damping
	theta1 = theta[0]									#storing theta1 values in 1st row
	theta2 = theta[1]									#storing theta1 values in 2nd row
	dtheta1_dt = theta2
	dtheta2_dt = (-b/m*theta2)-(g/l)*math.sin(theta1)
	dtheta_dt = [dtheta1_dt,dtheta2_dt]					#assigning theta values to dtheta_dt
	return dtheta_dt

#initial conditions

theta_0 = [0,3]											#initial ang.displacement - 0 and ang.velocity 3 rad/s @ time = 0 seconds

#time

t = np.linspace(0,20,100)								#100 time values betwee 0 and 20

#ball characteristics

m = 1 												    #mass of the ball
b = 0.05 												#damping characteristic 10%
l = 1													#length of the pendulum
g = 9.81												#gravity

theta = odeint(model,theta_0,t,args=(b,g,l,m))

#plot results

plt.plot(t,theta[:,0],'g-',label='angular displacement')#plotting time vs angular displacement
plt.plot(t,theta[:,1],'b-',label='angular velocity')	#plotting time vs angular velocity
plt.xlabel('time')
plt.ylabel('plot')
plt.legend()
plt.show()

#TO CREATE ANIMATION

ct = 1
x0 = 0 			#initial ball position x axis
y0 = 0 			#initial ball position y axis

for i in theta[:,0]:
	x1 = x0+(l*math.sin(i))
	y1 = y0+(-l*math.cos(i))

	filename = str(ct)+'.png'   	#saves filename as *.png (* - 150 numbers between 1 and 10)
	ct = ct+1

	plt.figure()

	plt.plot([-3,3],[0,0],"black") 	#black line which holds the pendulum
	plt.plot([x0,x1],[y0,y1],"red") #red line as the rope color
	plt.plot(x1,y1,'o',markersize = '20') #marker is the ball
	plt.xlim([-2,2])
	plt.ylim([-2,0.5])
	plt.savefig(filename)
Erros faced:
1.odeint

syntax of odeint corrected
Results:
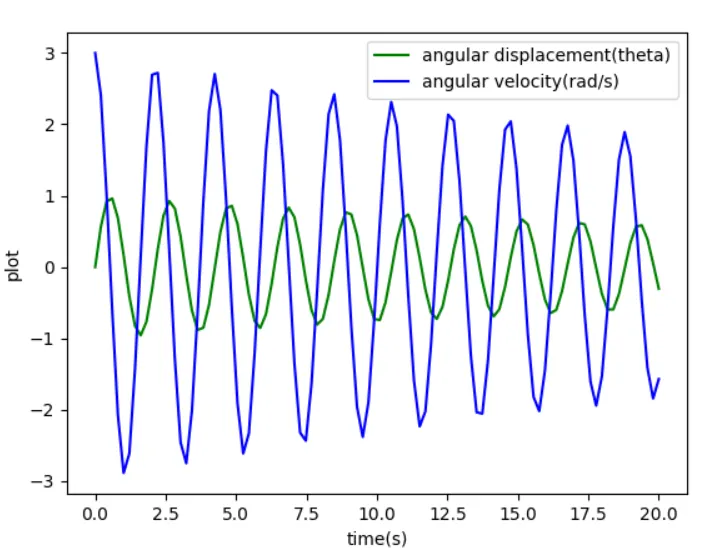
Time vs Angular displacement and velocity
Pendulum Animation code (command prompt)
In cmd after installing image magick software, write this code to get the animation of the pendulum
convert - converts png to gif
delay - delays the shifting between the picture by 1 ms
loop 0 - loops infinite times
*.png - searches for the .png files
output.gif - saves the multiple png files in output.gif
move all the png files to a seperate folder where gif to be created
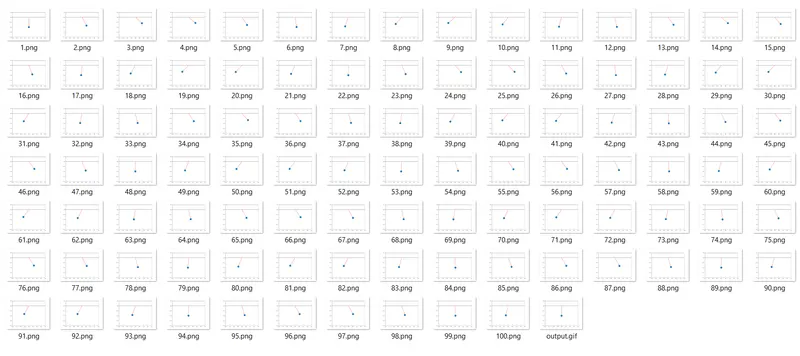
Folder which contains all the png files
Gif file:
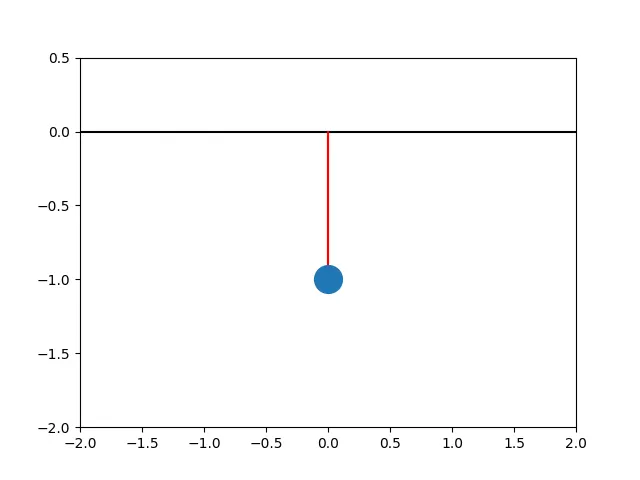
ANIMATION ERROR : When checked with the photos one by one, the behaviour looks correct, but in animation due to the loop command , it is not coming properly, tried with different options and still not resolved
YOUTUBE LINK : PENDULUM ANIMATION