Project 1
Data cleaning on Automobile 1985 dataset and perform descriptive analytics
The dataset was taken from the file 1985_Automobile_dataset

https://www.kaggle.com/fazilbtopal/auto85

Descriptive analysis in python:
Code snippets:
1. Importing the pandas, numpy and matplotlib libraries

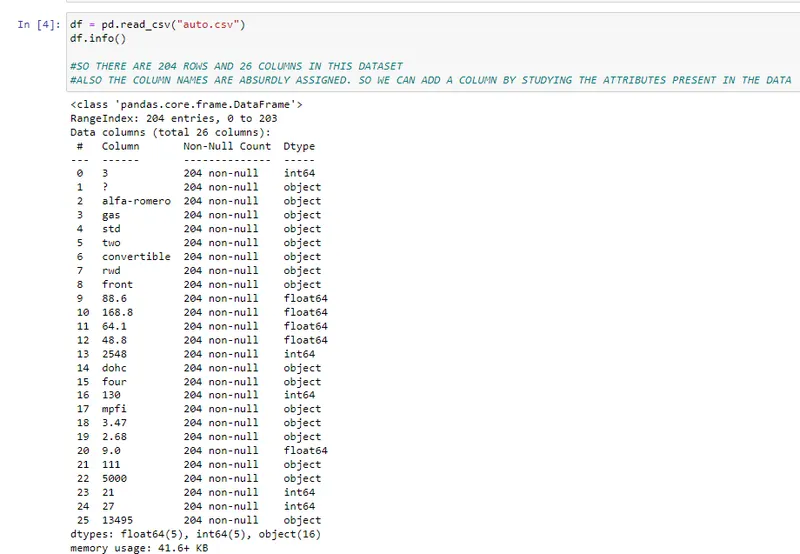
2. The downloaded file 'auto.csv' is read using the below commands and information of that file is gathered
There are 204 rows and 26 columns in the auto.csv file.
3. Checking the header file using df.head()
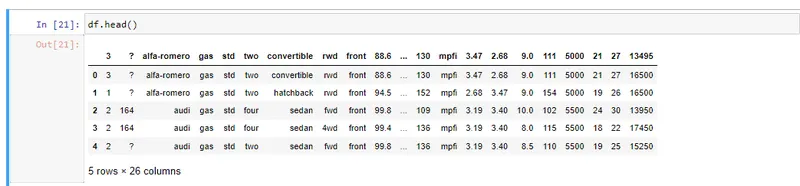
It was found that the column names are not correctly assigned and hence proper column names are assigned
4. The corresponding column names are assigned using column variable and is appended to the df dataset

5. The next step in the data preprocessing is to find the null values and replace it with appropriate values (using isnull())
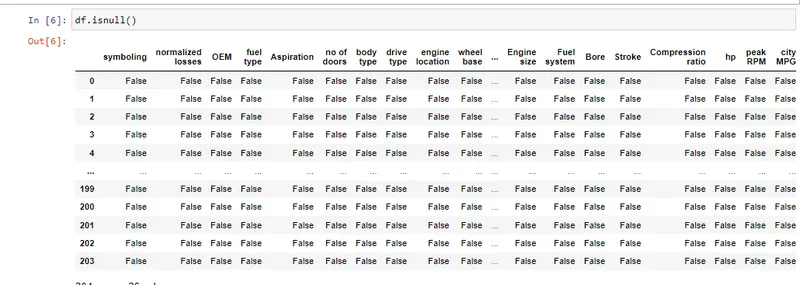
Since the null values are represented as '?' in the dataset , all the values are considered as non-null values and hence '?' should be replaced with 'NaN'
6. The '?' are replaced with NaN to find the correct null values in the dataset
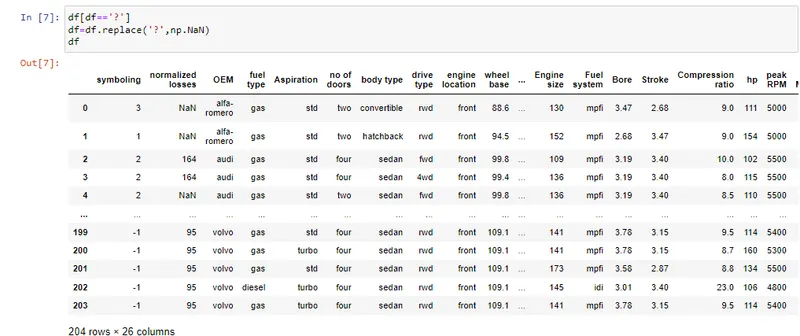
7. Now the same snippet is used and the null values are checked
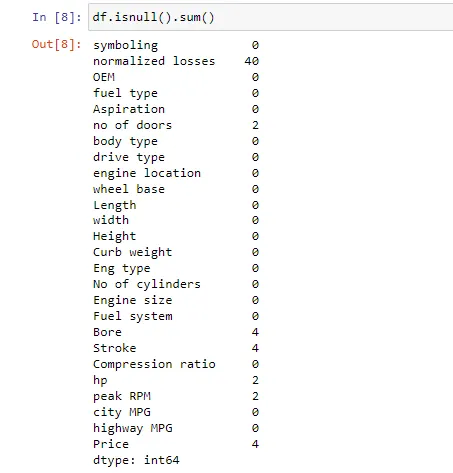
It is observed that we have
1. 40 null values in normalized losses column
2. 2 null values in 'no of doors','hp' and 'peak rpm' columns
3. 4 null values in bore, stroke and 'price' column
8. Before replacing the null values with some values , all the attributes in the dataset should be floating type and hence converting the data into floating datatype

9. Now all the data is converted to floating datatype and describe() is used to do the descriptive analysis (to find mean,std etc)
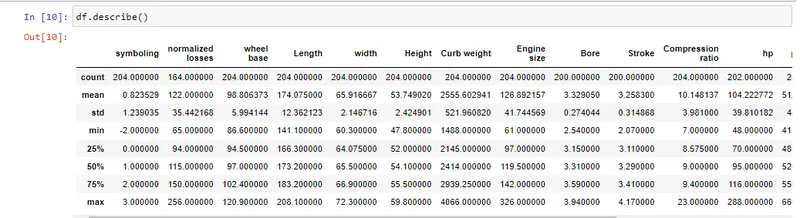
10. The values in the normalized losses, bore , stroke , hp , peak rpm and price are continuous variable and hence the missing values are replaced with mean values of the corresponding target column

11. After replacing the null values , the nullvalues in each column is checked
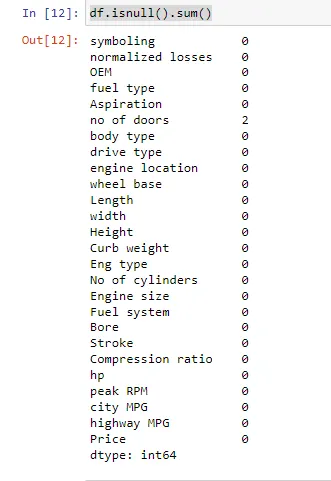
It is found that 'number of doors' column has a categorical values and hence the majority value is replaced for the null value
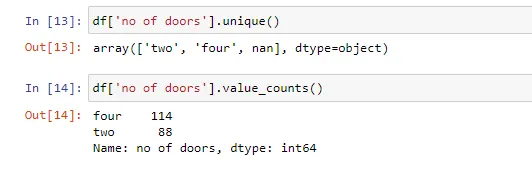
since 'four' door type has majority value, the null values in the 'number of doors' column are replaced with 'four' doors

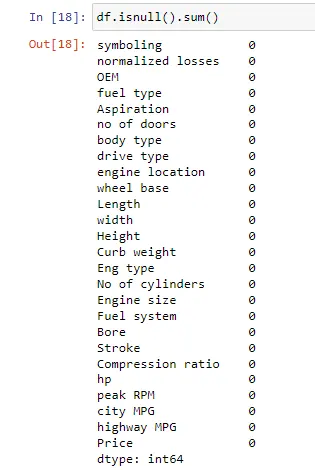
Now the data is cleaned and all the columns are given proper data
Hence the dataset is exported to a new csv file using


Hence descriptive analysis is performed and dataset is cleaned
python code:
import pandas as pd
import numpy as np
import matplotlib.pyplot as plt


df = pd.read_csv("auto.csv")
df.info()

#SO THERE ARE 204 ROWS AND 26 COLUMNS IN THIS DATASET
#ALSO THE COLUMN NAMES ARE ABSURDLY ASSIGNED. SO WE CAN ADD A COLUMN BY STUDYING THE ATTRIBUTES PRESENT IN THE DATA

df.head()

column = ['symboling','normalized losses','OEM','fuel type','Aspiration','no of doors','body type','drive type',
         'engine location','wheel base','Length','width','Height','Curb weight','Eng type','No of cylinders',
         'Engine size','Fuel system','Bore','Stroke','Compression ratio','hp','peak RPM','city MPG','highway MPG','Price']
df.columns = column
df

#after column is added, the null values are found and should be replaced with the mean values of the respective column
# but the null values are represented as ? instead of NaN and hence replacing ? with NaN

df.isnull()

df[df=='?']
df=df.replace('?',np.NaN)
df

df.isnull().sum()

# it is observed that we have
# 40 null values in normalized losses column
# 2 null values in 'no of doors','hp' and 'peak rpm' columns
# 4 null values in bore, stroke and 'price' column

# replacing the null values with the mean values of the particular column

#for this condition all the columns should be in floating type, so converting the columns to the floating type


df[['normalized losses','Bore','Stroke','hp','peak RPM','Price']] =
df[['normalized losses','Bore','Stroke','hp','peak RPM','Price']].apply(pd.to_numeric)

df.describe()

df.loc[:,'normalized losses'].fillna(df['normalized losses'].mean(),inplace = True)
df.loc[:,'Bore'].fillna(df['Bore'].mean(),inplace = True)
df.loc[:,'Stroke'].fillna(df['Stroke'].mean(),inplace = True)
df.loc[:,'hp'].fillna(df['hp'].mean(),inplace = True)
df.loc[:,'peak RPM'].fillna(df['peak RPM'].mean(),inplace = True)
df.loc[:,'Price'].fillna(df['Price'].mean(),inplace = True)

df.isnull().sum()

# since the number of doors column is categorical we will count the unique values in that column and assign the majority value to the missing values

df['no of doors'].unique()

df['no of doors'].value_counts()

#since four doors are majority, we can assign the four to the missing values

df.loc[:,'no of doors'].fillna('four',inplace = True)


df.isnull().sum()

#hence all the data's null value is replaced and now the dataset is cleaned
#hence exporting the data to an excel sheet named 'automobie_cleaned.csv'

df.to_csv('automobile_cleaned.csv')
FILE ATTACHMENT :