Basics of ML & AL Week 2 Challenge
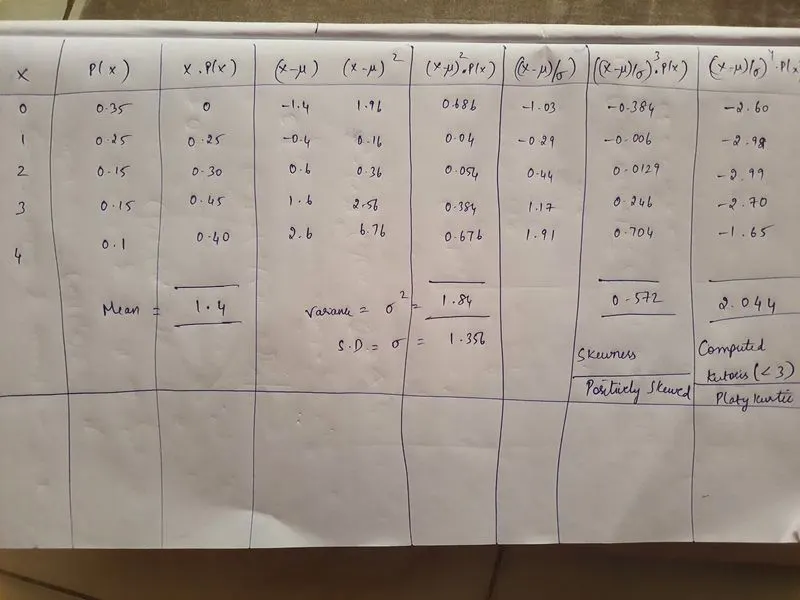
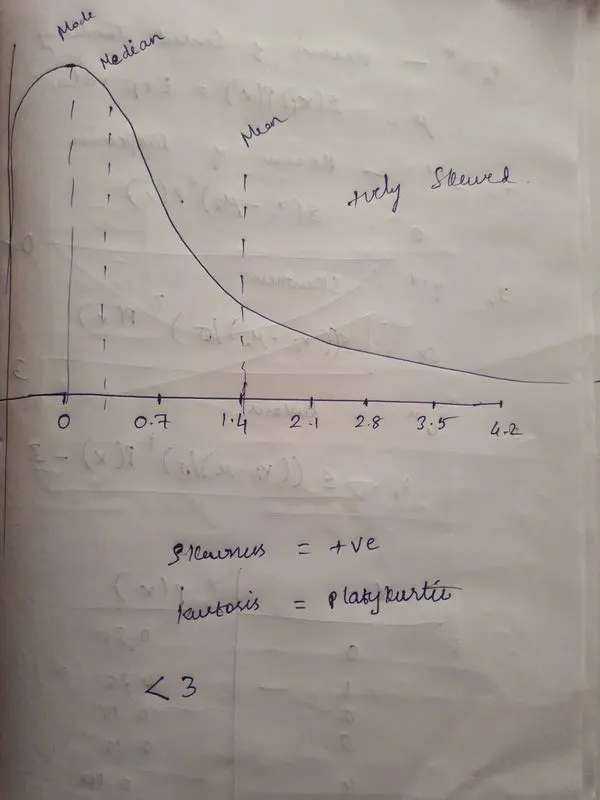
1)Calculate all 4 business moments using pen and paper for the below data set?
2)What is the significance of expected value when simple mean (Sum of all observations/number of observations) is already in place
The simple mean is highly influenced by the outliers of the data and it can overpredict based on the higher and lower values of a given data. Hence including or multiplying with the probability value will measure the correct central tendancy of the problem
3)Having skewness in the curve considered to be bad in the analysis?
In, skewed data, the tail region may act as an outlier for the statistical model and we know that outliers adversely affect the model’s performance especially regression-based models. There are statistical model that are robust to outlier like a Tree-based models but it will limit the possibility to try other models. So there is a necessity to transform the skewed data to close enough to a Gaussian distribution or Normal distribution. This will allow us to try more number of statistical model.
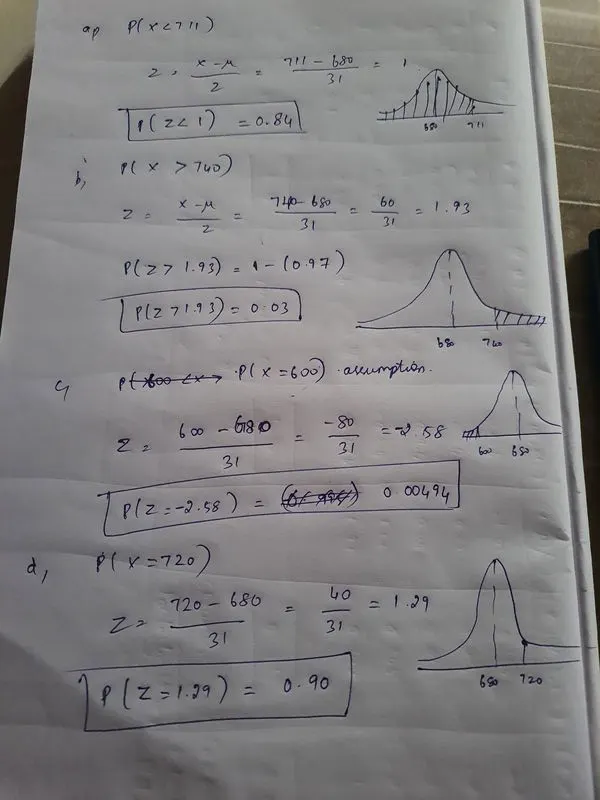
4)Evaluate the probabilities for continuous normal distribution with given mean = 680 and standard deviation = 31
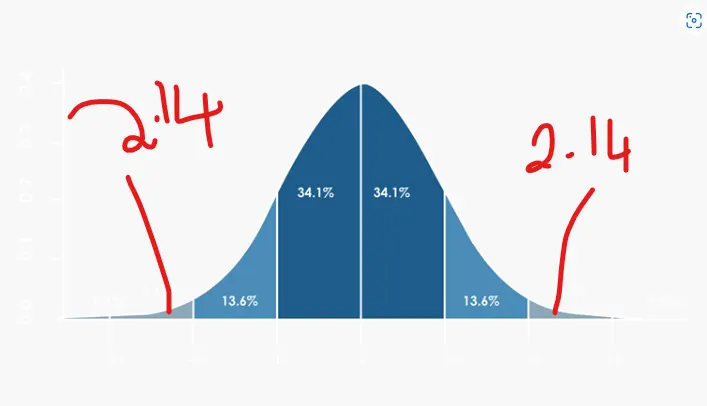
5)Explain the curve on the right side
The left out portion is the 3 sigma boundary. - 2.14% on both sides