Project 1 - Parsing NASA thermodynamic data
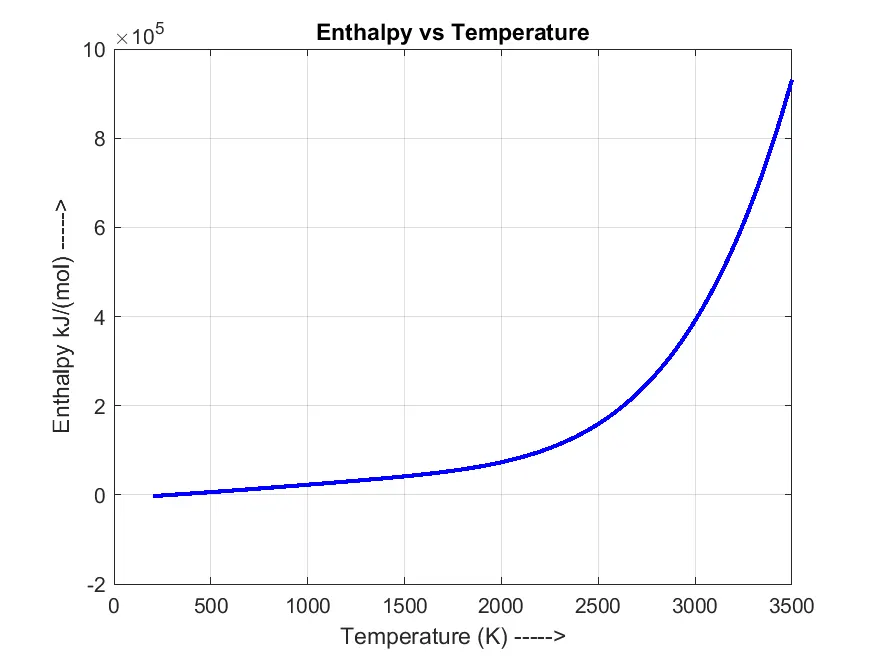
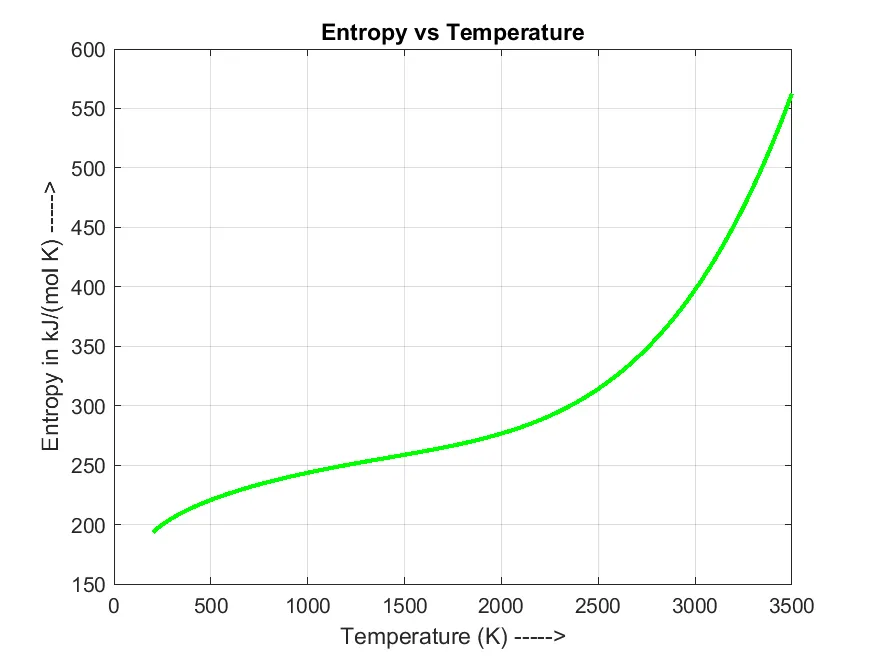
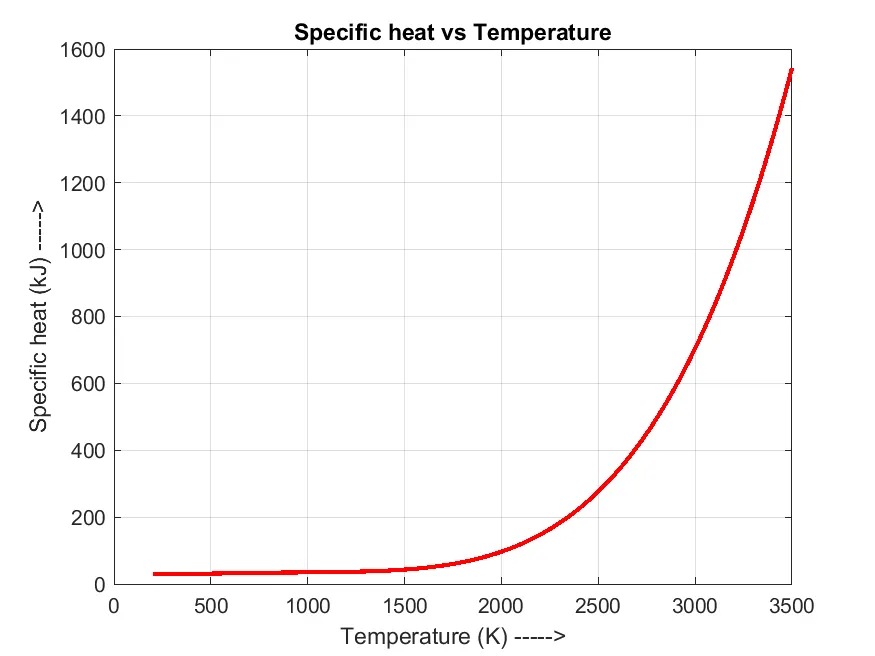
The above 3 pics are for O2, below 3 for CO2
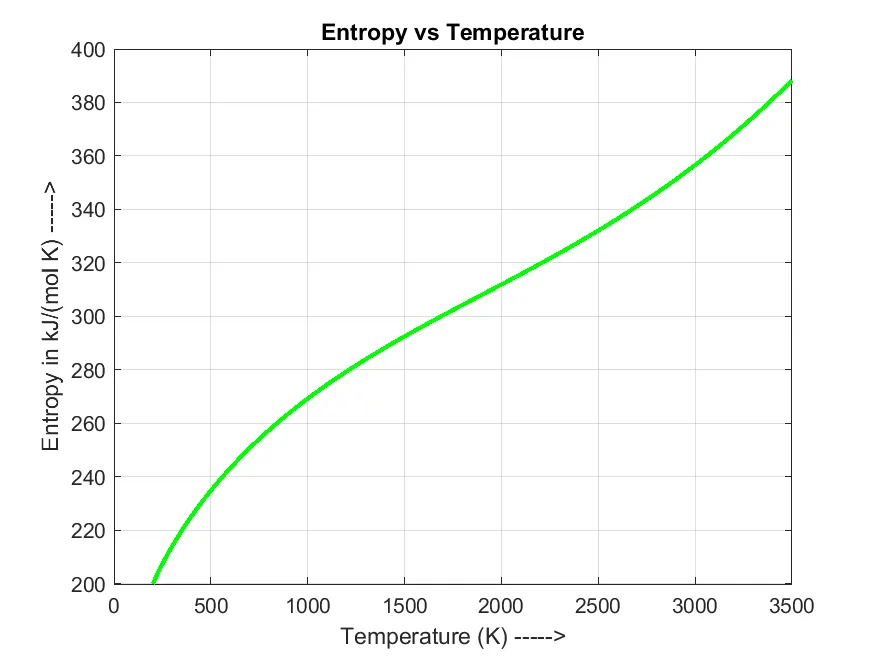
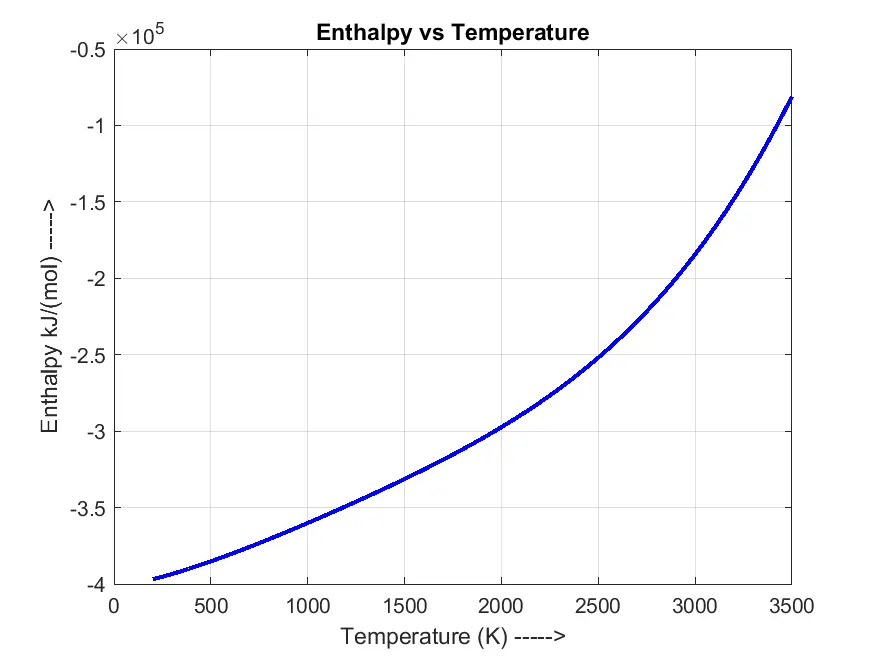
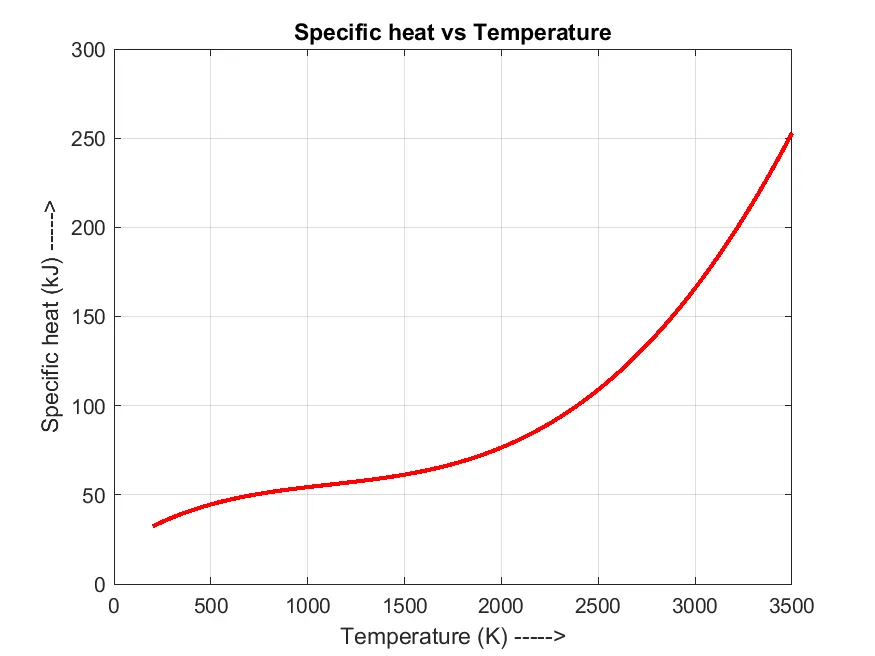
The below one is for N2
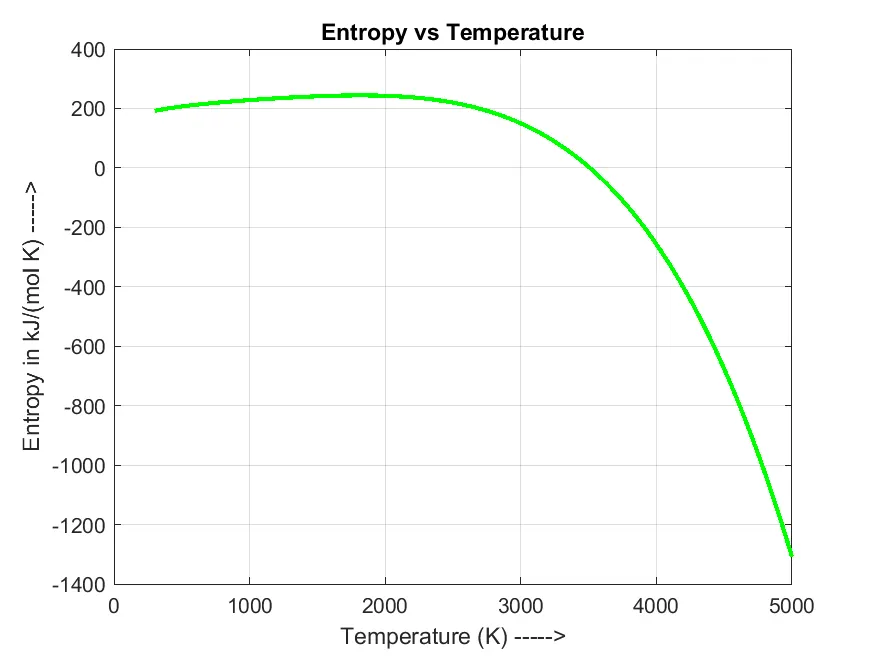
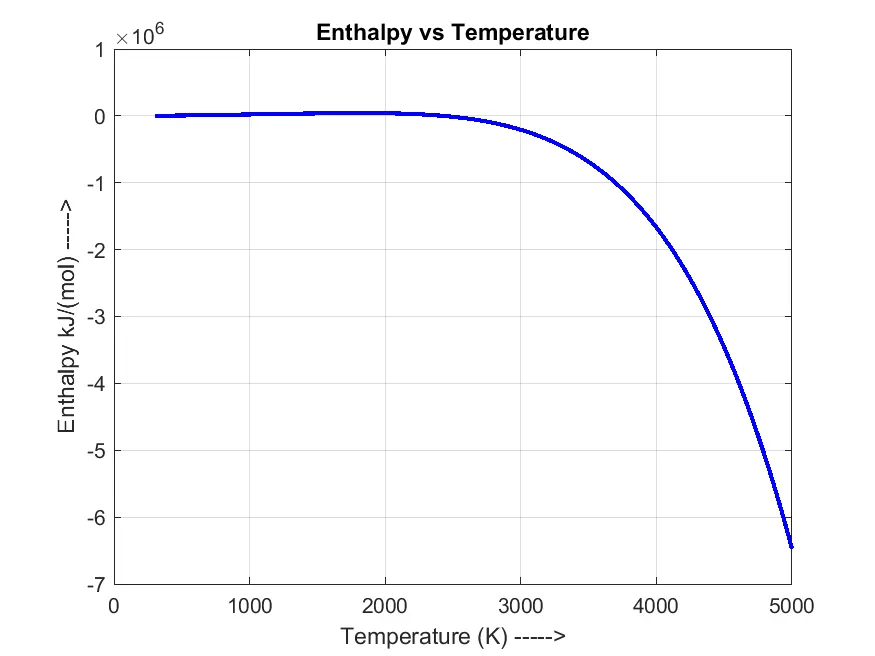
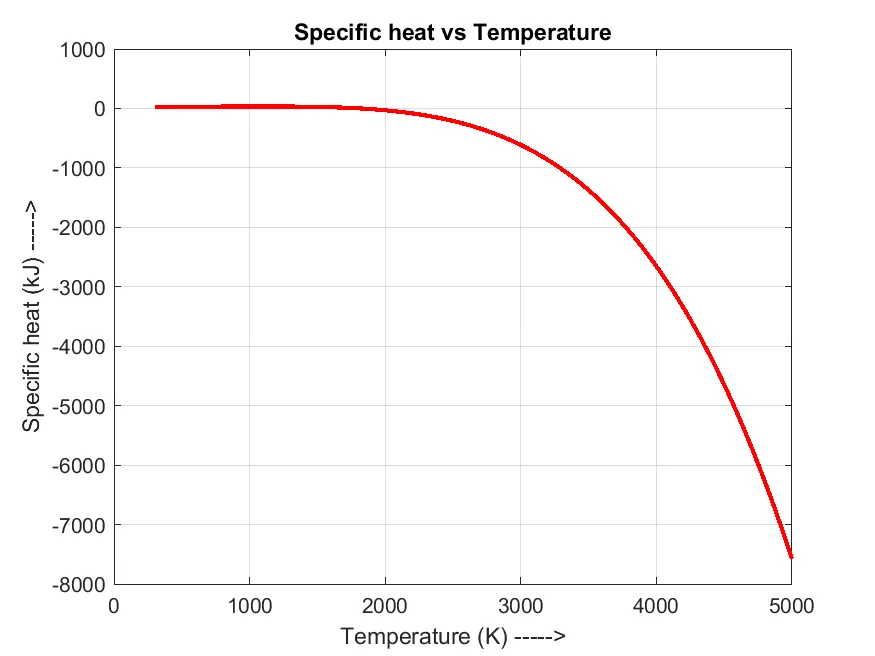


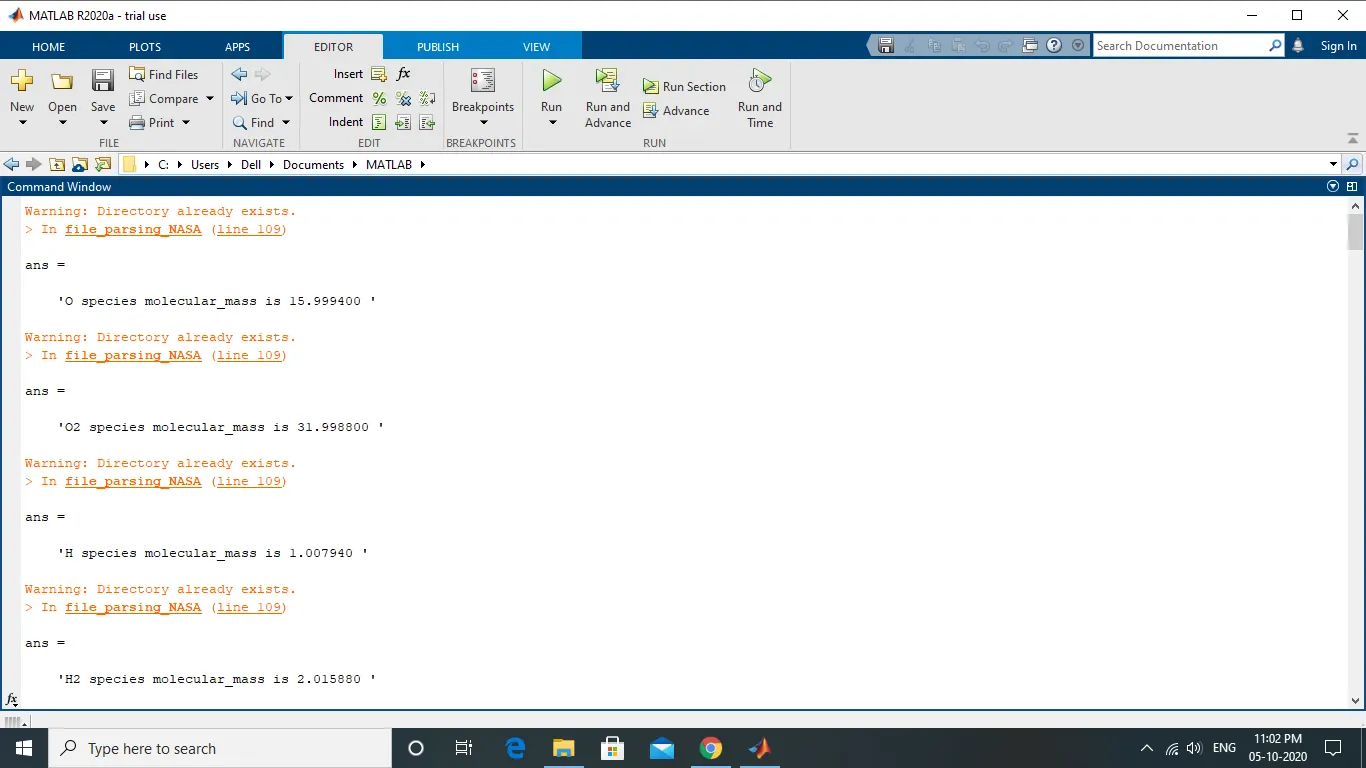
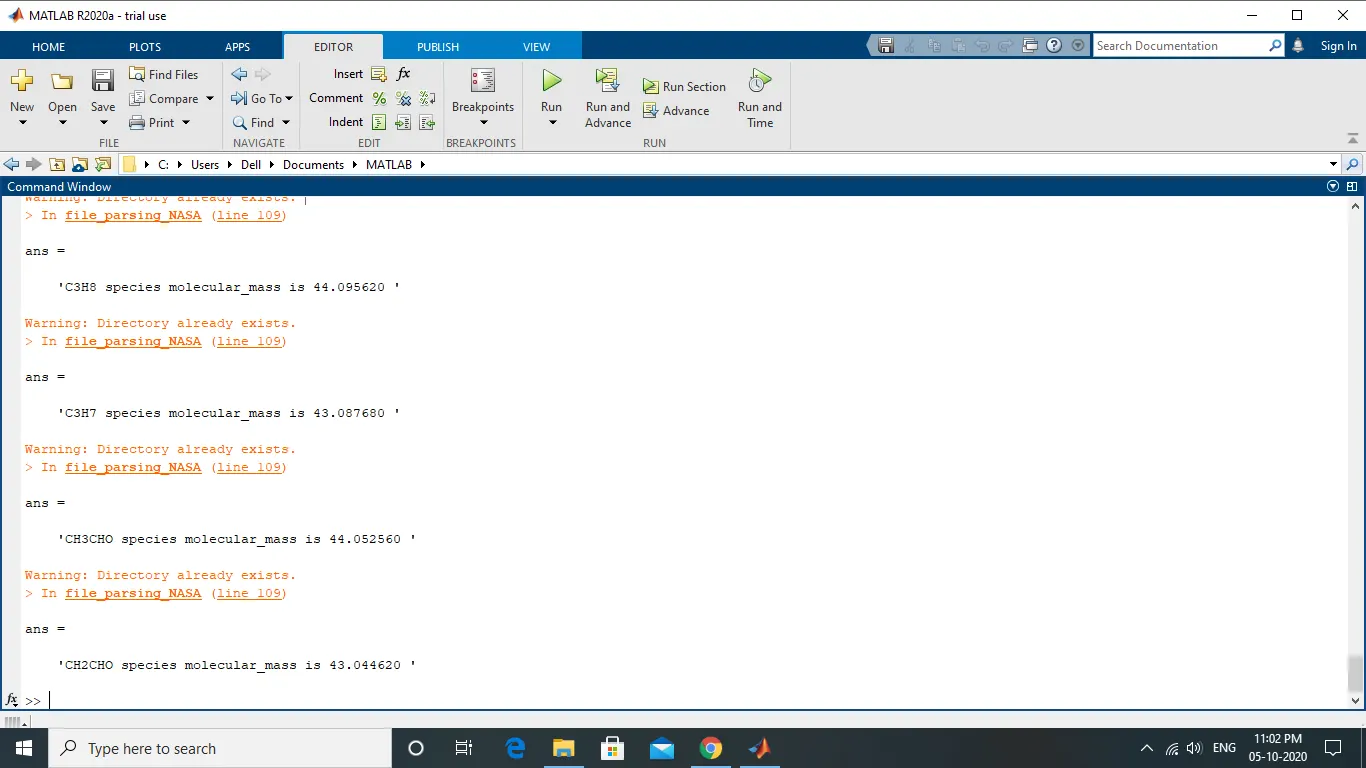
AIM : File parsing the NASA thermodynamic data and to plot the variation of parameters like enthalpy,entropy,specific heat against temperature and to determine the molecular masses of individual species mentioned in the data file .
THEORY : Parsing means to break it down into component parts so that its syntax can be analyzed, categorized, and understood.
When the temperature of a system increases, the kinetic and potential energies of the atoms and molecules in the system increase. Thus, the internal energy of the system increases, which means that the enthalpy of the system increases– this is true under constant pressure or constant volume.
Entropy, the measure of a system’s thermal energy per unit temperature that is unavailable for doing useful work. Because work is obtained from ordered molecular motion, the amount of entropy is also a measure of the molecular disorder, or randomness, of a system. The concept of entropy provides deep insight into the direction of spontaneous change for many everyday phenomena
Changes in temperature will lead to changes in entropy. The higher the temperature the more thermal energy the system has; the more thermal energy the system has, the more ways there are to distribute that energy; the more ways there are to distribute that energy, the higher the entropy. Increasing the temperature will increase the entropy.
Specific heat, ratio of the quantity of heat required to raise the temperature of a body one degree to that required to raise the temperature of an equal mass of water one degree. The term is also used in a narrower sense to mean the amount of heat, in calories, required to raise the temperature of one gram of a substance by one Celsius degree.
Specific heat is a measure of the ability of the substance to absorb heat.The heat goes first into increasing the kinetic energies of the molecules.Molecules can also store energy in vibrations and rotations. These energies are quantized.For example, the O-H bonds in water can stretch and bend, and the whole molecule can rotate about its x-, y-, and z-axes.At low temperatures, collisions do not provide enough energy to get out of the ground states for rotation or vibration.The average energy increases only from translation.As the substance heats up, the average kinetic energy of the molecules increases.The collisions impart enough energy to allow rotation to occur.Rotation then contributes to the internal energy and raises the specific heat.The vibrational energy states are farther apart than the rotation energy states.Vibration does not jump out of the ground state until high temperatures (≈ 1000 K).It then contributes to the specific heat.
FOMULAE REQUIRED :
`C_p/R=a_1+a_2T+a_3T^2+a_4T^3+a_5T^4`
`H/(RT)=a_1+(a_2T)/2+(a_3T^2)/3+(a_4T^3)/4+a_5T^4+a_6/T`
`s/R=a_1ln(T) +a_2T+(a_3T^2)/2+(a_4T^3)/3+(a_5T^4)/4+a_7`
CODE :
clear all
close all
clc
% universal gas constant, to get array of specific heat, enthalpy and entropy
R = 8.314 ;
%Reading header
f1 = fopen('THERMO.dat','r');
Header= fgetl(f1);
%Reading Global Temperature Line
Global_temp = fgetl(f1);
C = strsplit(Global_temp,' ');
global_low_temp =str2double(C{2}); %Global Low Temperature
global_mid_temp =str2double(C{3}); %Global Mid Temperature
global_high_temp =str2double(C{4}); %Global High Temperature
%%skipping 3 lines
fgetl(f1);
fgetl(f1);
fgetl(f1);
%using for loop to consider 53 elements
for i = 1:53
line= fgetl(f1); %Reading the line
A=strsplit(line,' '); %Seperating Variable
species_name=(A{1}); %Naming First Variable as 'Species'
z=length(A);
local_low_temp = (A{z-3});
local_high_temp =(A{z-2});
local_mid_temp =(A{z-1});
lt = str2double(local_low_temp); %Local Low Temperature
ht = str2double(local_high_temp); %Local Mid Temperature
mt = str2double(local_mid_temp); %Local High Temperature
%line 1-Reading the coefficient data
cfline1= fgetl(f1);
X = strfind(cfline1,'E');
a1 = cfline1(1:X(1)+3);
a1 = str2double(a1); %storing 1st coefficient
a2 = cfline1(X(1)+4:X(2)+3);
a2 = str2double(a2); %storing 2nd coefficient
a3 = cfline1(X(2)+4:X(3)+3);
a3 = str2double(a3); %storing 3rd coefficient
a4 = cfline1(X(3)+4:X(4)+3);
a4 = str2double(a4); %storing 4th coefficient
a5 = cfline1(X(4)+4:X(5)+3);
a5 = str2double(a5); %storing 5th coefficient
%line 2-Reading coefficient data of 2nd line
cfline2 = fgetl(f1);
G = strfind(cfline2,'E');
a6 = cfline2(1:G(1)+3);
a6 = str2double(a6); %storing 6th coefficient
a7 = cfline2(G(1)+4:G(2)+3);
a7 = str2double(a7); %storing 7th coefficient
a8 = cfline2(G(2)+4:G(3)+3);
a8 = str2double(a8); %storing 8th coefficient
a9 = cfline2(G(3)+4:G(4)+3);
a9 = str2double(a9); %storing 9th coefficient
a10 = cfline2(G(4)+4:G(5)+3);
a10 = str2double(a10); %storing 10th coefficient
%line 3-Reading coefficient data of 3rd line
cfline3 = fgetl(f1);
I = strfind(cfline3,'E');
a11 = cfline3(1:I(1)+3);
a11 = str2double(a11); %storing 11th coefficient
a12 = cfline3(I(1)+4:I(2)+3);
a12 = str2double(a12); %storing 12th coefficient
a13 = cfline3(I(2)+4:I(3)+3);
a13 = str2double(a13); %storing 13th coefficient
a14 = cfline3(I(3)+4:I(4)+3);
a14=str2double(a14); %storing 14th coefficient
%Ranging the temperature low temperature to high temperature
T=linspace(lt,ht,500);
if T>=mt
% to compare the species temperature to assign the coefficients
%a1-a7 (high temperature coefficients), a8-a14(low temperature coefficients)
%Specific Heat
Cp=(a1+a2.*(T)+a3.*(T.^2)+a4.*(T.^3)+a5.*(T.^4))*R;
%Entropy
S=(a1.*log(T)+a2.*T+a3.*(T.^2)./2+a4.*(T.^3)./3+a5.*(T.^4)./4+a7)*R;
%Enthaphy
H=(a1.*T+a2.*(T.^2)./2+a3.*(T.^3)./3+a4.*(T.^4)./4+a5.*(T.^5)./5+a6)*R;
else
Cp=(a8+a9.*(T)+a10.*(T.^2)+a11.*(T.^3)+a12.*(T.^4))*R;
S=(a8.*log(T)+a9.*T+a10.*(T.^2)./2+a11.*(T.^3)./3+a12.*(T.^4)./4+a14)*R;
H=(a8.*T+a9.*(T.^2)./2+a10.*(T.^3)./3+a11.*(T.^4)./4+a12.*(T.^5)./5+a13)*R;
end
%Saving as a folder
fd = sprintf('%s',species_name);
cur_dir=pwd;
mkdir(species_name);
cd(species_name);
%Plot 1, Specific heat (Cp) vs Temperature (T)
figure(1);
plot(T,Cp,'linewidth',2,'color','r');
xlabel('Temperature (K) ----->');
ylabel('Specific heat (kJ) ----->');
title('Specific heat vs Temperature');
grid on;
%Plot 2, Enthalpy (H) vs Temperature (T)
figure(2);
plot(T,H,'linewidth',2,'color','b');
xlabel('Temperature (K) ----->');
ylabel('Enthalpy kJ/(mol) ----->');
title('Enthalpy vs Temperature');
grid on;
%Plot 3, Entropy (S) vs Temperature (T)
figure(3);
plot(T,S,'linewidth',2,'color','g');
xlabel('Temperature (K) ----->');
ylabel('Entropy in kJ/(mol K) ----->');
title('Entropy vs Temperature');
grid on;
% saving the plots that got generated
saveas(figure(1),'cp.png');
saveas(figure(2),'h.png');
saveas(figure(3),'s.png');
cd(cur_dir);
%Calculating the Molecular mass of species
atoms=['H','C','N','O','S','A'];
AtomicWeight=[1.00794 12.0107 14.0067 15.9994 32.065 39.948];
M=0;
for i=1:length(species_name)
for j=1:length(AtomicWeight)
if strcmp(species_name(i),atoms(j))
M=M+AtomicWeight(j);
u=j;
end
end
% Adding the weights of the repeating atoms
n=str2num(species_name(i));
if n>1
M=M+AtomicWeight(u)*(n-1);
end
end
sprintf('%s species %s is %f ',species_name,'molecular_mass',M)
end
fclose(f1);
CONCLUSION : The graphs of specific heat , entropy and enthalpy has been plotted with the use of ‘THERMO.dat’ file and molecular weight has also being calculated.