Flow over a cylinder
AIM:
To simulate flow over a cylinder at different Reynold's number conditions. Increase Reynold's number by a factor of 20%, 40%, and 100% then run the transient simulation. Create animations for pressure-velocity for all the three Reynolds number.
THEORY:
The Reynolds number (Re) is an important dimensionless quantity in fluid mechanics used to help predict flow patterns in different fluid flow situations. It is defined as the ratio of inertial force to viscous force. At low Reynolds numbers, flows tend to be dominated by laminar (sheet-like) flow, while at high Reynolds numbers flows tend to be turbulent.
For flow over a cylinder, the Reynolds number is generally defined as
`Re=(rho*U_i*D)/mu`
where `rho` is the density of the fluid `((kg)/m^3)`
`U_i` is the inlet velocity of the fluid `(m/s)`
`D` is the characteristic length (diameter in this case) of cylinder (m)
`mu` is the dynamic viscosity of the fluid `(Pa*s)`
Parameters:
Cylinder Diameter: 40mm
Cylinder Height: 50mm
Baseline velocity: 10m/s
Working Fluid: Air
Density of Air: 1.225 `((kg)/m^3)`
Dynamic viscosity of Air: 1.81 x `10^-5 (Pa*s)`
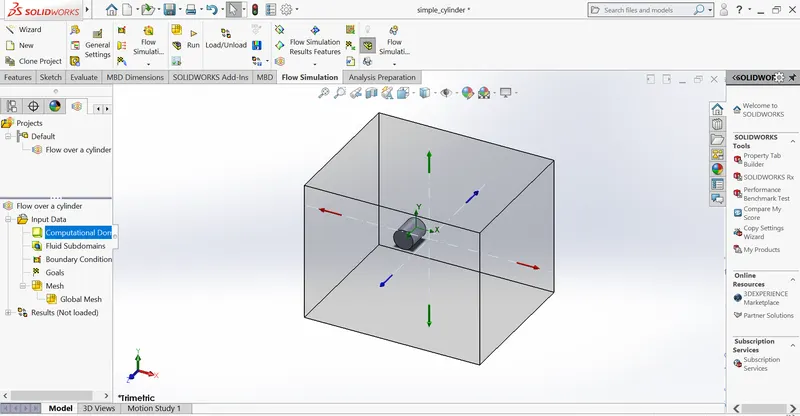
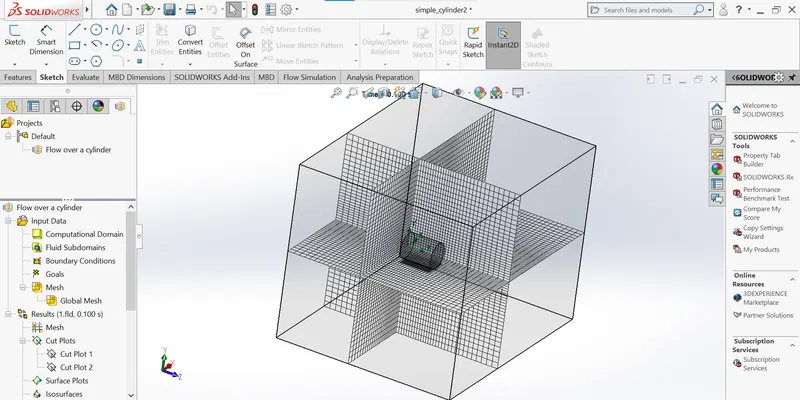
Automatic meshing at level 5
Geometry & Meshing :
Calculations:
For all three cases, initial pressure and temperature are 101325 Pa and 293.2 K
Diameter and length are 40 mm and 50 mm. All conditions are the same except velocity. So Increasing Reynold's number will increase the velocity proportionally.
The initial velocity is 10 m/s.
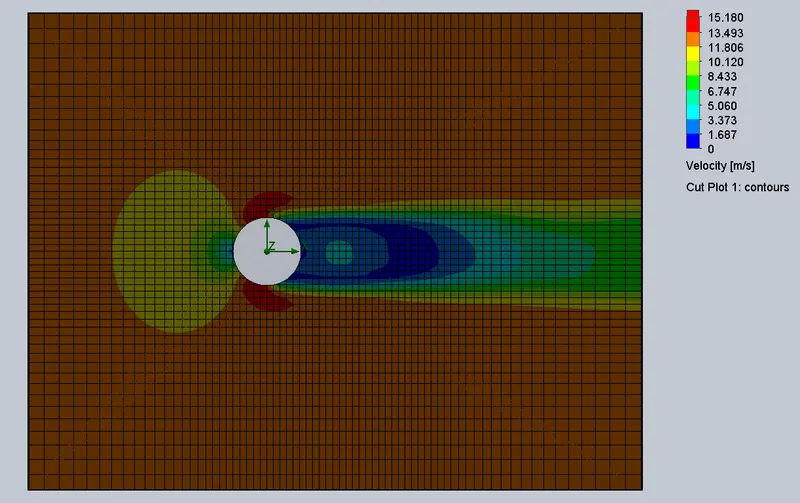
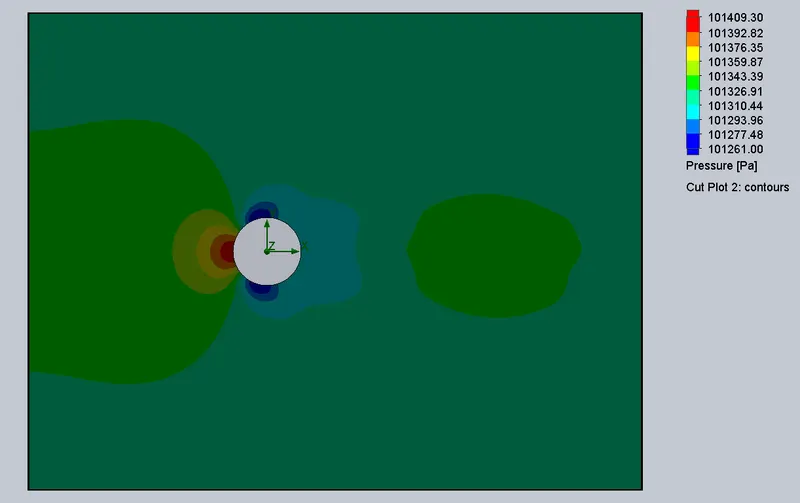
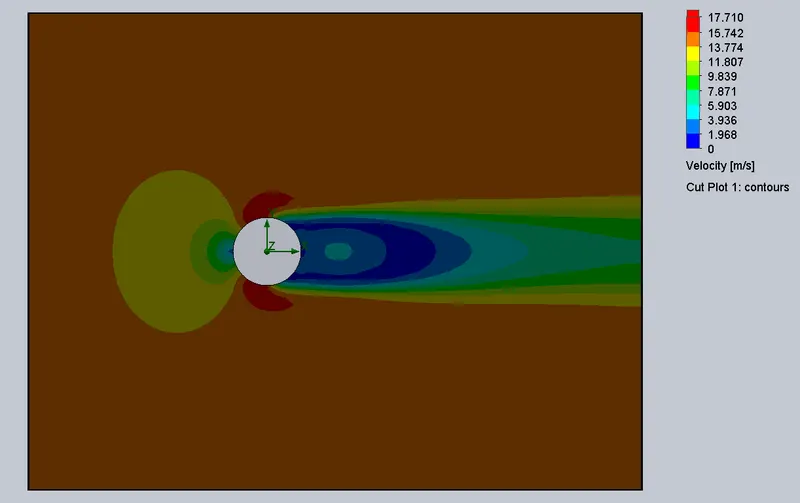
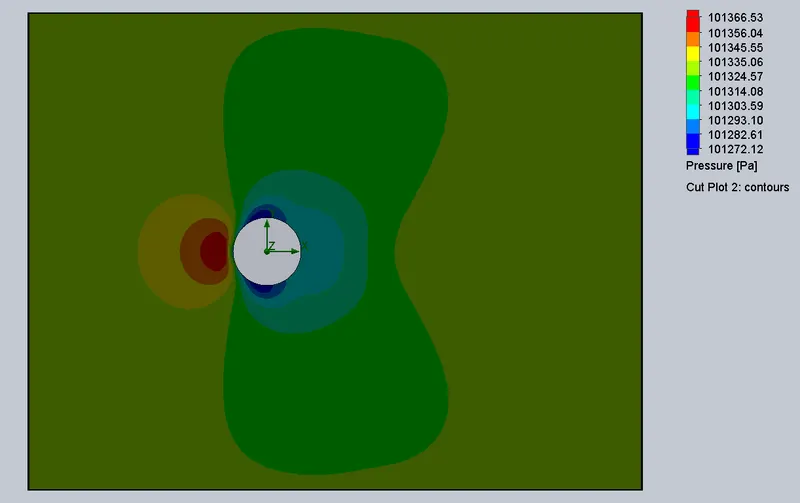
Case 1: At 20% increase in Reynolds number, flow velocity would be 12 m/s.
Case 2: At 40% increase in Reynolds number, flow velocity would be 14 m/s.
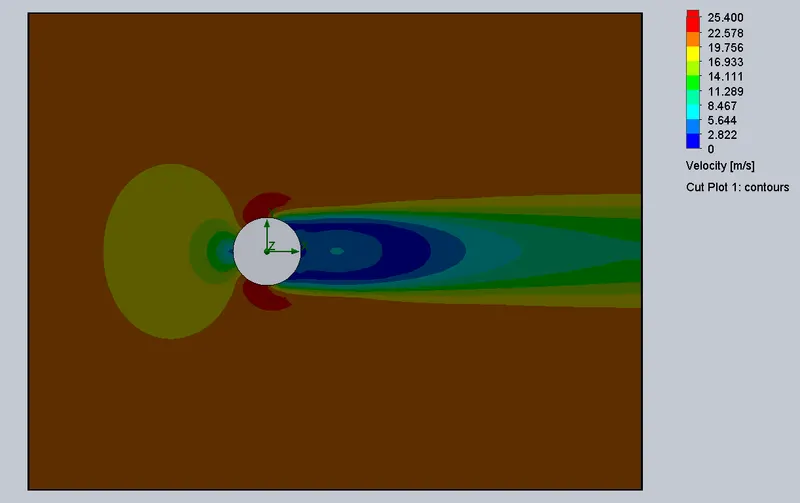
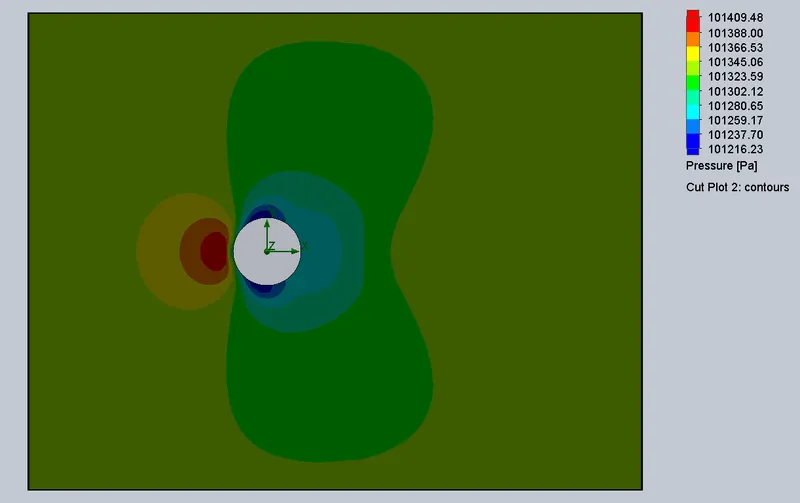
Case 3: At 100% increase in Reynolds number, flow velocity would be 20 m/s.
Case 1: (at 20%)
Velocity cutplot
Pressure cutplot
Animation video of velocity distribution:
https://drive.google.com/file/d/1hiaMZEEElDrG8jPuh-yI5TbSQj3qf3fM/view?usp=sharing
Animation video of pressure distribution:
https://drive.google.com/file/d/1hj0-TULkGhrWJHTBwnYBcKqy5o_eA9kz/view?usp=sharing
Case 2: (at 40%)
Velocity cutplot
Pressure cutplot
Animation video of velocity distribution:
https://drive.google.com/file/d/1dbEUAVJGxNDH-709E6yGl5ppP5fV22H-/view?usp=sharing
Animation video of pressure distribution:
https://drive.google.com/file/d/1Hnw1oShYLe-yursAf5DdjIb-Zp2S_K7z/view?usp=sharing
Case 3: (at 100%)
Velocity cutplot
Pressure cutplot
Animation video of velocity distribution:
https://drive.google.com/file/d/1Svj3F8zxfdqmbkOplrrOLTxgpgxHFGiF/view?usp=sharing
Animation video of pressure distribution:
https://drive.google.com/file/d/1--SOt2ipF_xqbiO0iRaJdgdYfO0UdYCN/view?usp=sharing
INFERENCE:
As we increase the Reynold's Number, velocity of external flow of air increases and time required to obtain a steady velocity & pressure profile decreases.