Week 6 - Data analysis
AIM :
To write a python script to analyze the data available in the given file.
OBJECTIVE :
- Check the compatibility of the file
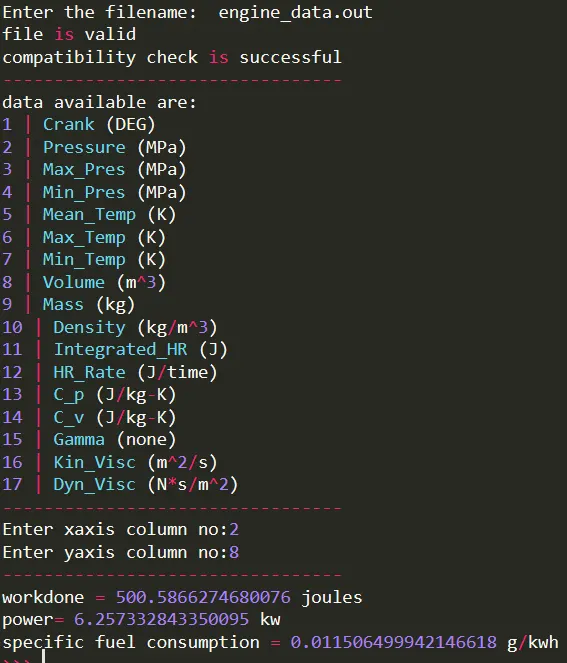
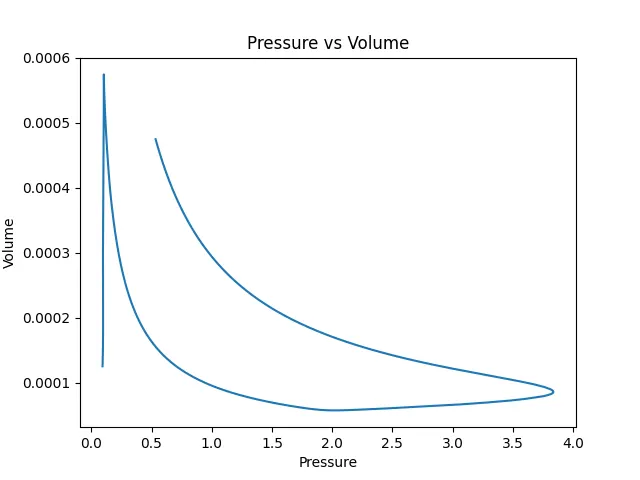
- Calculate the area under the P-V diagram.
- Calculate the power output of this engine assuming that RPM is 1500
- Calculate its specific fuel consumption.
THEORY :
Parsing means to break it down into component parts so that its syntax can be analyzed, categorized, and understood. By doing this we are going to break a string into parts then recognizing the parts to convert it into something simpler than a string. File parsing is to resolve the things into component or subpart form and describe the syntactic file.
This data file consists of 17 columns of the various recorded engine and thermodynamic parameters for more than 8000 instants. These are the output parameters from an IC engine simulation.
CODE :
import matplotlib.pyplot as plt
import numpy as np
from numpy import trapz

fname = input("Enter the filename:  ")

if fname == 'engine_data.out':
	print('file is valid')

else:

	print('file is invalid')

	exit()

def compatibility_check(a):

	if 'CONVERGE' not in a:

		print('please provide converge output file to process')

		exit()

	else:

		print('compatibility check is successful')
		print('---------------------------------')

		pass

FILE = []


for line in open(fname):

	if '#' in line:

		FILE.append(line.split())

compatibility_check(FILE[0])

noc = len(FILE[1])
head = len(FILE[2])
col_no = []
col_val = []
col_units = []

z = FILE[1].index('column')
for i in range(z,noc-1):

	col_no.append(i)

for j in FILE[2]:

	if j is not '#':

		col_val.append(j)

for k in FILE[3]:

	if k is not '#':

		col_units.append(k)

print('data available are:')

for a in range(0,len(col_no)):

	print(a+1,"|",col_val[a],col_units[a])

print('---------------------------------')
xaxis = int(input('Enter xaxis column no:'))-1
yaxis = int(input('Enter yaxis column no:'))-1

x = []
y = []

for line in open(fname):

	if '#' not in line:

		x.append(float(line.split()[xaxis]))
		y.append(float(line.split()[yaxis]))

plt.plot(x,y,linewidth=1.5)
plt.xlabel(col_val[xaxis])
plt.ylabel(col_val[yaxis])
plt.title(col_val[xaxis] +' vs ' + col_val[yaxis])
plt.show()

pressure = []
vol = []

for line in open(fname):
	if '#' not in line:

		pressure.append(float(line.split()[1]))
		vol.append(float(line.split()[7]))

Pressure = 1e6*np.array(pressure)
Volume = np.array(vol)
area = np.trapz(Pressure,Volume)
print('---------------------------------')
print('workdone =',area, 'joules')
cyclepersec = 750/60
power = area*(cyclepersec/1000)
print('power=',power,'kw')
mass_flow = 20e-6
sfc = mass_flow*3600/power
print('specific fuel consumption =',sfc,'g/kwh')
OUTPUT :

INFERENCE :
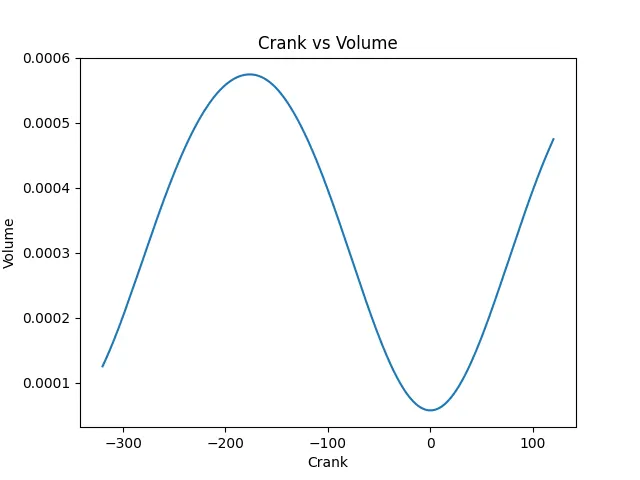
This program helps to plot any graph according to our choice using the listed parameters and gives the values of work done, power output and specific fuel consumption of the engine.