Project 1 - Parsing NASA thermodynamic data
AIM:- Write a function that extracts the 14 co-efficients and calculates the enthalpy, entropy and specific heats for all the species in the data file. You will be reading this file NASA thermodynamic data
THEORY:- NASA came up with polynomials that can be used to evaluate thermodynamic properties such as Cp, H and S. They have also documented the co-efficients that are required to evaluate these polynomials for 1000+ species.
OBJECTIVE:-
- Writing a function that extracts the 14 co-efficients and calculates the enthalpy, entropy and specific heats for all the species in the data file
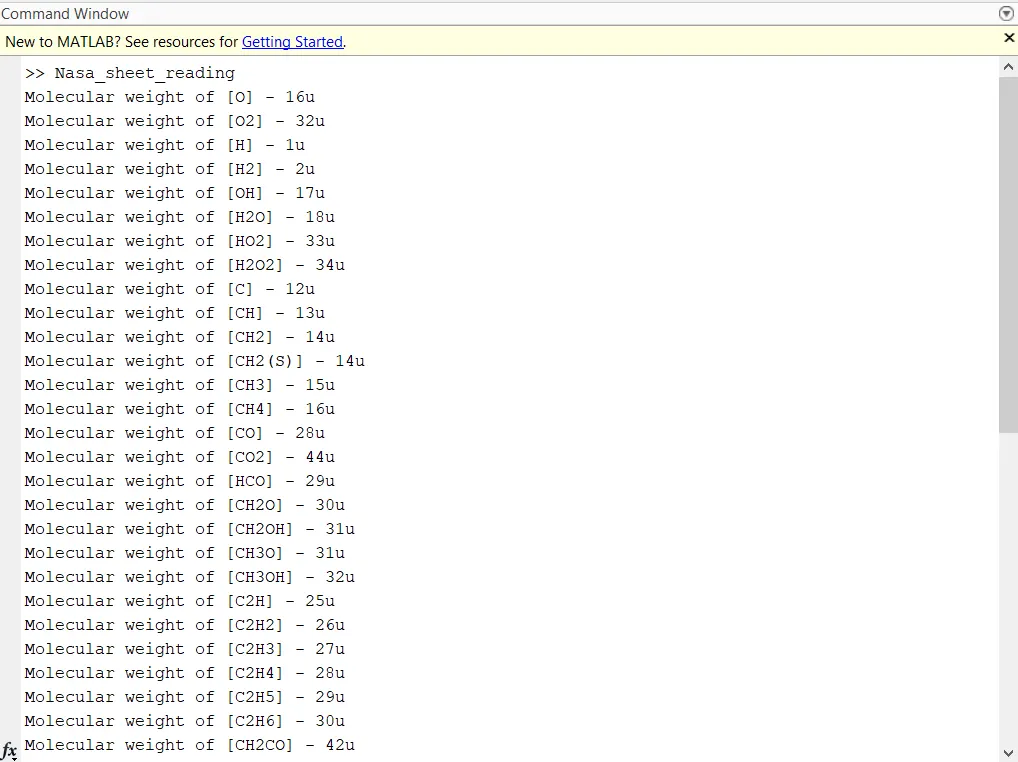
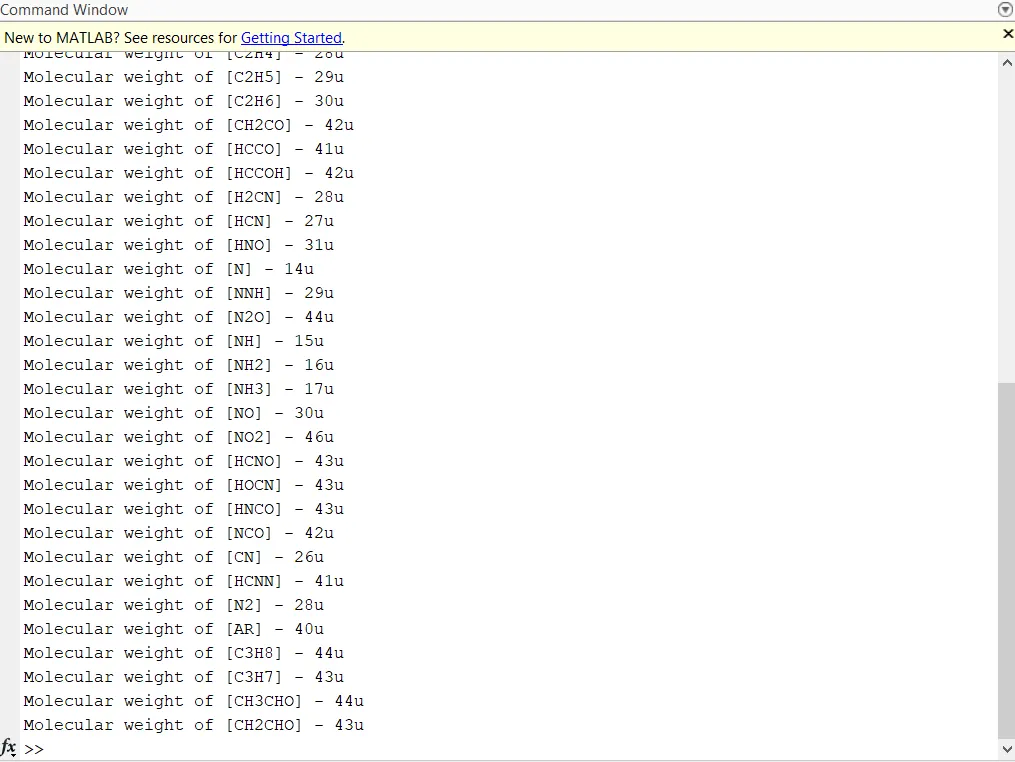
- Calculating the molecular weight of each species and display it in the command window.
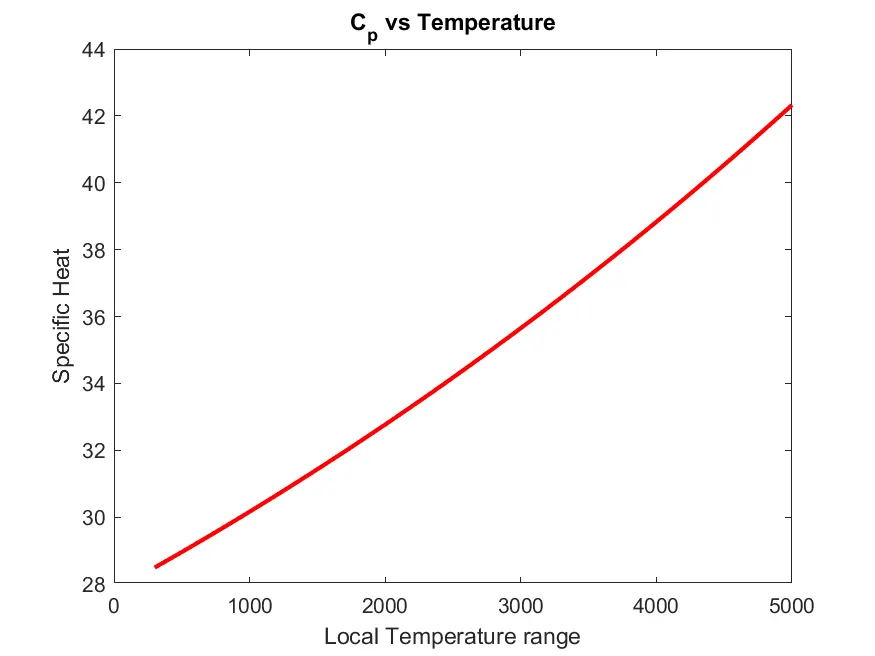
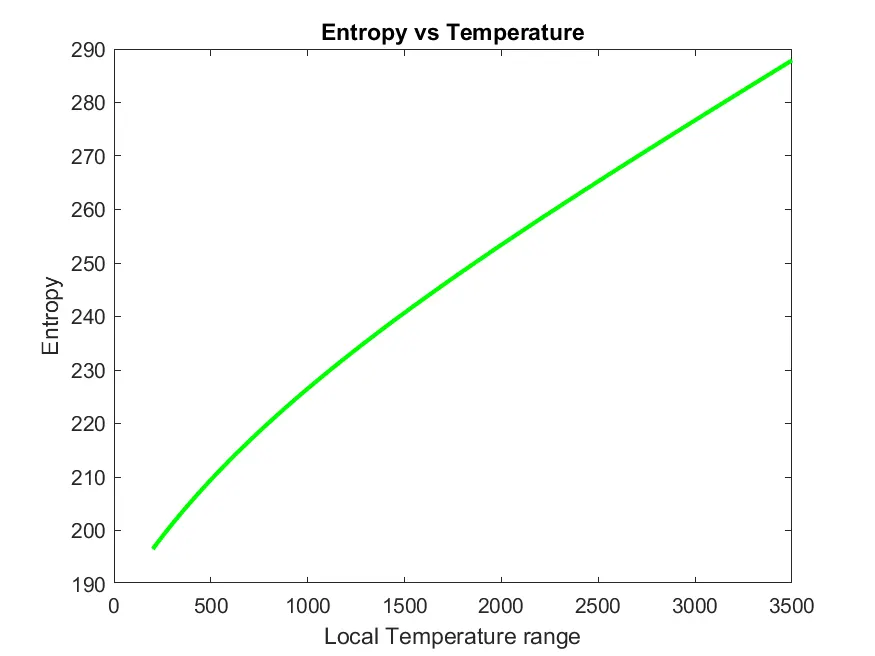
- Plotting the Cp, Enthalpy and Entropy for the local temperature range (low temperature : high temperature) specific for each species.
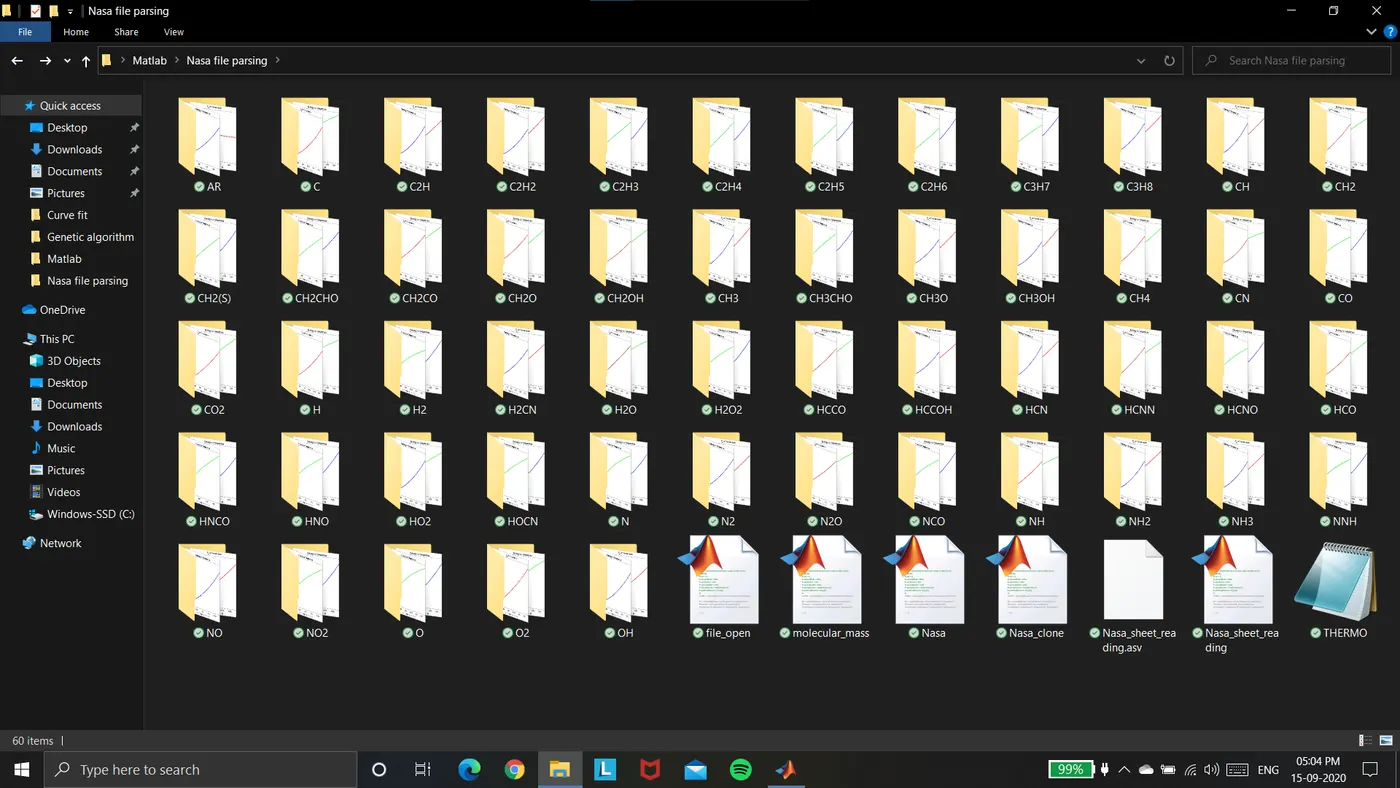
- Saving the plots as images with appropriate names and dumping them in separate folders for each species with suitable name.
- The main program will just take the "THERMO.dat" file as an input and generate Cp, H and S plots.
EQUATIONS:-
Specific heat at constant pressure
`C_p/R = a_1 + a_2*T + a_3*T^2 + a_4*T^3 + a_5*T^4`
Enthalpy (H)
`H/(R*T) = a_1 + (a_2*T)/2 + (a_3*T^2)/3 + (a_4*T^3)/4 + (a_5*T^4)/5 + a_6*T`
Entropy (S)
`S/R = a_1*log(T) + a_2*T + (a_3*(T)^2)/2 + (a_4*(T)^3)/3 + (a_5*(T)^4)/4 + a_7`
Where
R= Universal gas constant(J/mol*K)
T= Temperature (Kelvin)
H= Enthalpy (J)
S= Entropy (J/K)
PROGRAM:-
%loading the data
F1=fopen('THERMO.dat','r');

%defining the global temp
Title=fgetl(F1);
string_temp=fgetl(F1);
strsplit(string_temp,' ');
A=str2num(string_temp);
global_low_temp=A(1);
global_mid_temp=A(2);
global_high_temp=A(3);

%Ignoring the comments
for i=1:3
    ignore=fgetl(F1);
end

for j=1:53
%Defining local temp renge
string_local1=fgetl(F1);
A1=strsplit(string_local1);
Species_name=A1{1};

local_low_temp=str2double(A1(end-3));
local_mid_temp=str2double(A1(end-1));
local_high_temp=str2double(A1(end-2));

%local temperature range of the species
local_temp_range=linspace(local_low_temp,local_high_temp,300);

%Extracting the coefficients as string
A4=fgetl(F1);
A5=findstr(A4,'E');

a1=A4(A5(1)-10:A5(1)+3);
a2=A4(A5(2)-10:A5(2)+3);
a3=A4(A5(3)-10:A5(3)+3);
a4=A4(A5(4)-10:A5(4)+3);
a5=A4(A5(5)-10:A5(5)+3);

A4=fgetl(F1);
A5=findstr(A4,'E');

a6=A4(A5(1)-10:A5(1)+3);
a7=A4(A5(2)-10:A5(2)+3);
a8=A4(A5(3)-10:A5(3)+3);
a9=A4(A5(4)-10:A5(4)+3);
a10=A4(A5(5)-10:A5(5)+3);

A4=fgetl(F1);
A5=findstr(A4,'E');

a11=A4(A5(1)-10:A5(1)+3);
a12=A4(A5(2)-10:A5(2)+3);
a13=A4(A5(3)-10:A5(3)+3);
a14=A4(A5(4)-10:A5(4)+3);

%converting the string coefficients into number
a1=str2num(a1);
a2=str2num(a2);
a3=str2num(a3);
a4=str2num(a4);
a5=str2num(a5);
a6=str2num(a6);
a7=str2num(a7);
a8=str2num(a8);
a9=str2num(a9);
a10=str2num(a10);
a11=str2num(a11);
a12=str2num(a12);
a13=str2num(a13);
a14=str2num(a14);

%calling the function of C_p,H,S
[C_p,H,S]=Nasa(a1,a2,a3,a4,a5,a6,a7,a8,a9,a10,a11,a12,a13,a14,local_low_temp,local_mid_temp,local_high_temp,local_temp_range);

%Creating individual folder for all the species and storing it
Data=sprintf('%s',Species_name);
c_d=pwd;

%making new directory and creating new folders
mkdir(Data);
cd(Data);

%Calculating molecular weight
Element_name={'H','C','N','O','A'};
Atomic_weight=[1,12,14,16,40];
mol_weight=0;


for k=1:length(Species_name)
    for m=1:length(Element_name)
        if strcmp(Species_name(k),Element_name(m))==1
            mol_weight=mol_weight+Atomic_weight(m);
            d=m;
        end
    end
    p=str2double(Species_name(k));
    if p>1
        mol_weight=mol_weight+((Atomic_weight(d))*(p-1));
    end
end

%plotting
%plotting graph for C_p
figure(1)
plot(local_temp_range,C_p,'linewidth',2,'color','r');
xlabel('Local Temperature range');
ylabel('Specific Heat');
title('C_p vs Temperature');

%saving file of C_p as png
getframe(gcf);
saveas(1,'Graph of C_p.png');

%plotting graph for Enthalpy
figure(2)
plot(local_temp_range,H,'linewidth',2,'color','b');
xlabel('Local Temperature range');
ylabel('Enthalpy');
title('Enthalpy vs Temperature');

%saving file of Enthaply as png
getframe(gcf);
saveas(2,'Graph of Enthalpy.png');

%plotting graph for Entropy
figure(3)
plot(local_temp_range,S,'linewidth',2,'color','g');
xlabel('Local Temperature range');
ylabel('Entropy');
title('Entropy vs Temperature');

%saving file of Entropy as png
getframe(gcf);
saveas(3,'Graph of Entropy.png');

%setting current directory as c_d
cd(c_d);

%Displaying the molecular weight
fprintf('Molecular weight of [%s] - %du \n',Species_name,mol_weight)
end
FUNCTION PROGRAM FOR CALCULATING C_p, H, S:-
function [C_p,H,S]=Nasa(a1,a2,a3,a4,a5,a6,a7,a8,a9,a10,a11,a12,a13,a14,local_low_temp,local_mid_temp,local_high_temp,local_temp_range)
R=8.314;
%low temperature range
L_T=linspace(local_low_temp,local_mid_temp,300);

%High temperature range
H_T=linspace(local_mid_temp,local_high_temp,300);

if(local_temp_range>=local_mid_temp)
C_p = (a1 + a2.*H_T + a3.*(H_T).^2 + a4.*(H_T).^3 + a5.*(H_T).^4).*R;
H = (a1 + ((a2.*H_T)./2) + ((a3.*H_T).^2)./3 + ((a4.*H_T).^3)./4 + ((a5.*H_T).^4)./5 + a6.*H_T).*R.*H_T;
S = (a1.*log(H_T) + a2.*H_T + ((a3.*(H_T).^2)./2)+ ((a4.*(H_T).^3)./3) + ((a5.*(H_T).^4)./4) + a7).*R;
else
    C_p = (a1 + a2.*L_T + a3.*(L_T).^2 + a4.*(L_T).^3 + a5.*(L_T).^4).*R;
H = (a1 + ((a2.*L_T)./2) + ((a3.*L_T).^2)./3 + ((a4.*L_T).^3)./4 + ((a5.*L_T).^4)./5 + a6.*L_T).*R.*L_T;
S = (a1.*log(L_T) + a2.*L_T + ((a3.*(L_T).^2)./2)+ ((a4.*(L_T).^3)./3) + ((a5.*(L_T).^4)./4) + a7).*R;
end
end
OUTPUT:-
Plot of O_2:-
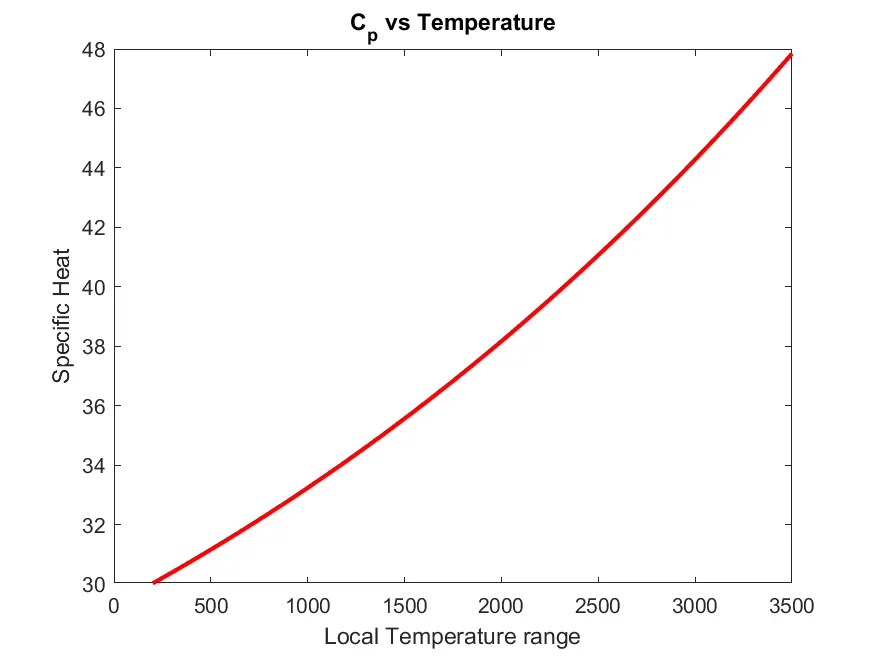
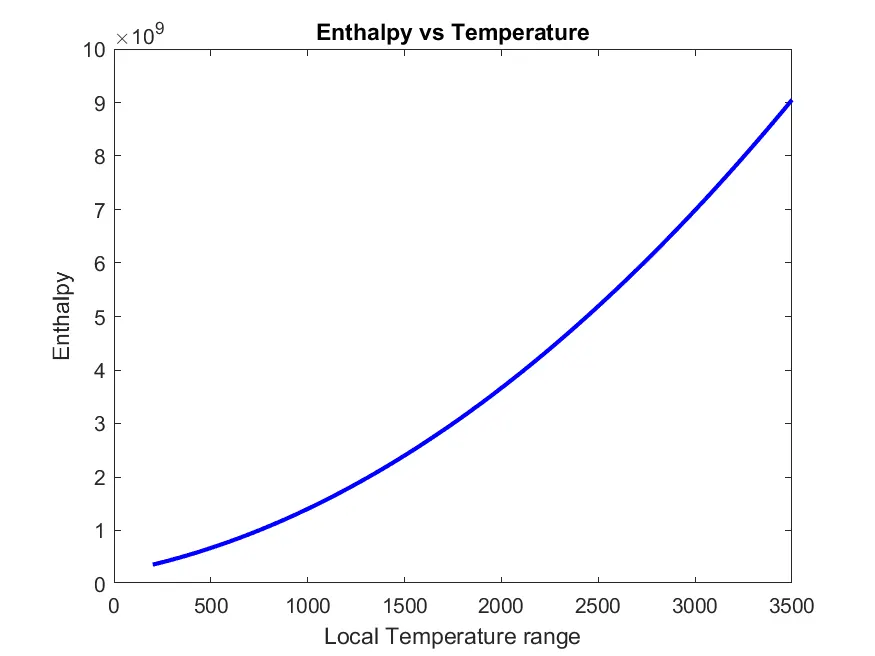
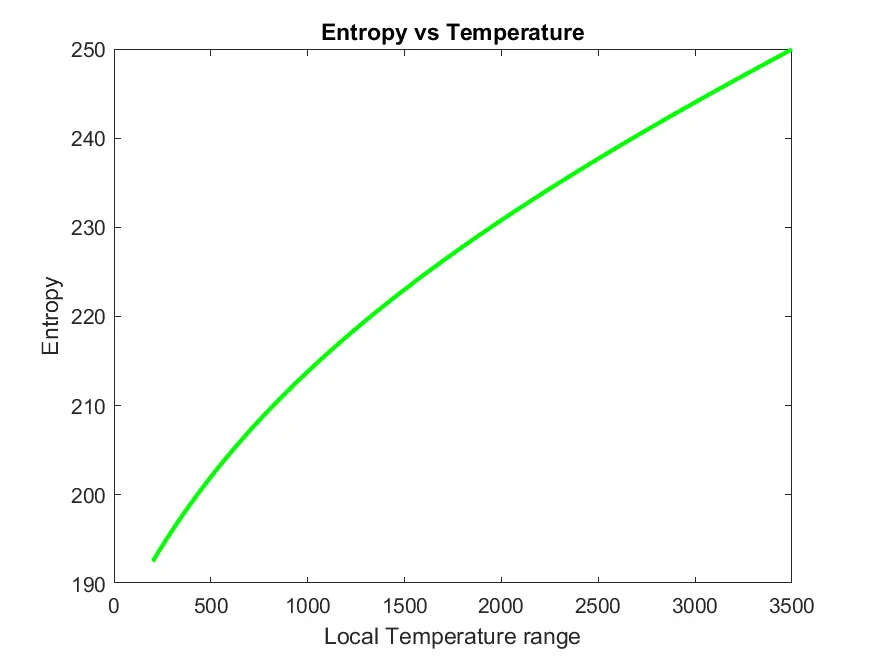
Plot of N_2:-
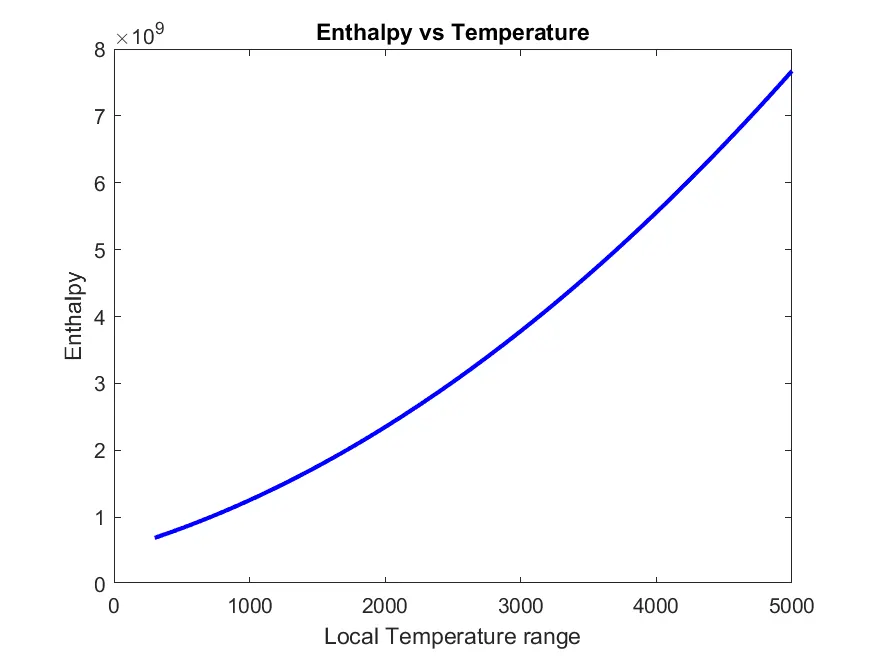
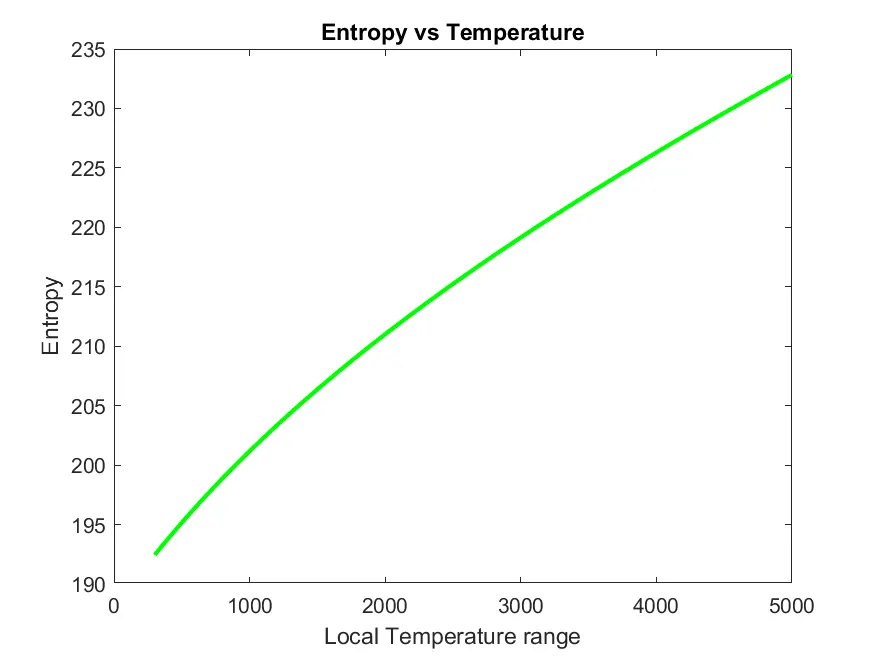
Plot of CO_2:-
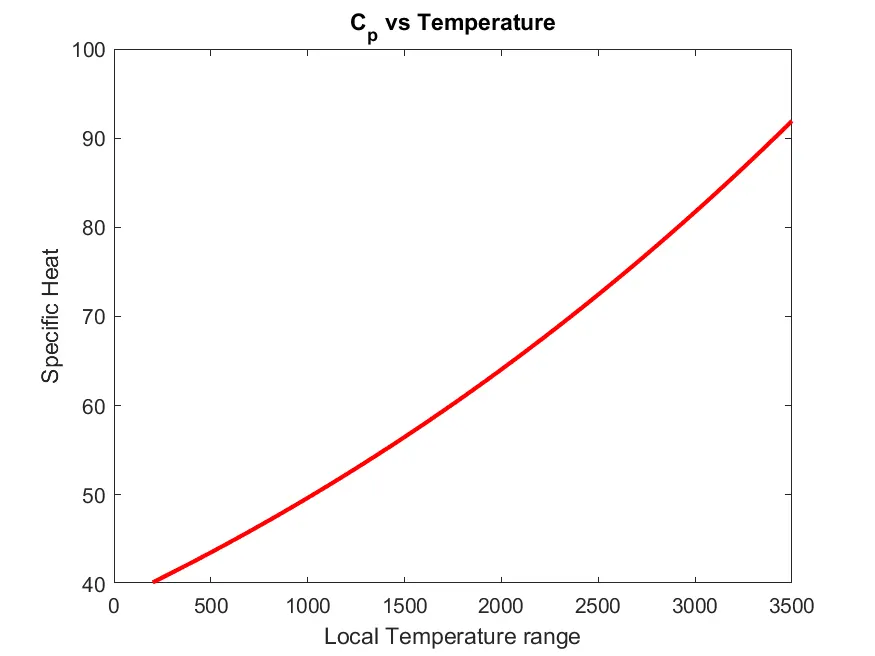
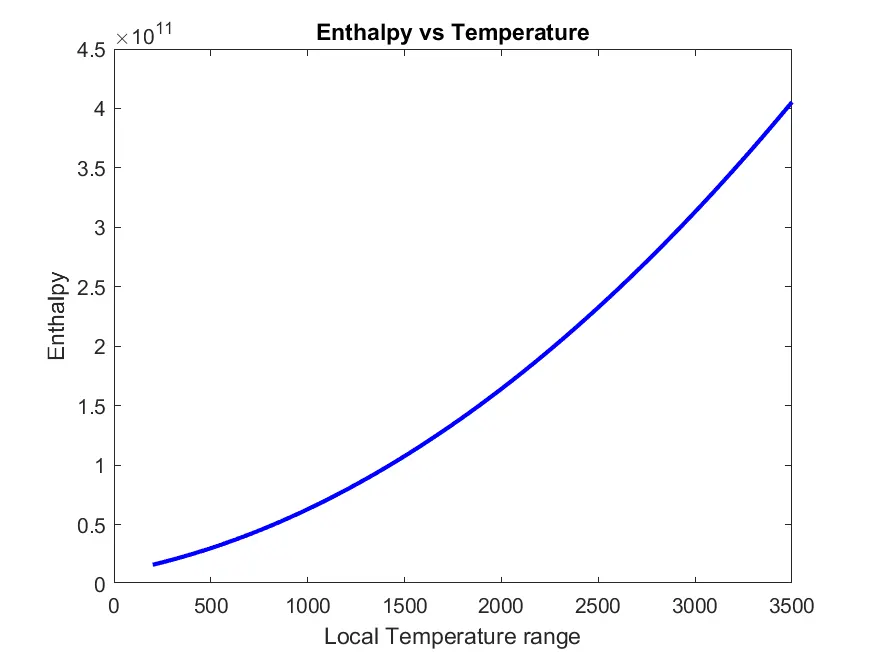
SCREENSHOT OF THE FOLDERS STORED IN PC:-
MOLECULAR WEIGHT:-
ERRORS:-
There were tons of errors made. I have not taken the screenshot of the errors, but I remember all of them
Here below are the errors I faced,
- Didn’t used the ‘.’ Dot operator in the function file i.e ‘Nasa.m’.
- While calculating the molecular weight of ‘Ar’ it was showing an error so I fixed the name of ‘AR’ to ‘A’
- Faced many problems while writing the code for calculating 'molecular weight' of the species.
- Made lots of mistakes while writing the FUNCTION for calculating C_p,H,S.
- While running the program I was not getting the GRAPH of some species because of the errors made in the FUNCTION file.
- Faced error while creating the directory for individual species.