Project 1 - Parsing NASA thermodynamic data
Aim :- 1) To write a function that extracts the 14 co-efficients and calculates the enthalpy, entropy and specific heats for all the species in the data file. We will be reading this file NASA thermodynamic data to obtain all the reults.
(the data given here is for combustion so the Cp,H and S is calculated using the formula given below.)
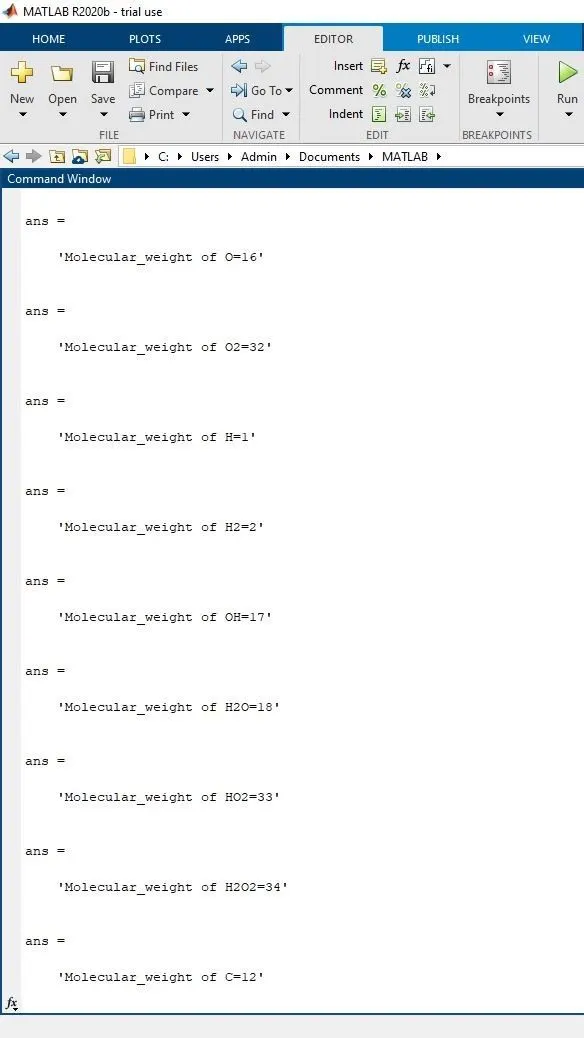
2) Calculate the molecular weight of each species and display it in the command window.
3) Plot the Cp, Enthalpy and Entropy for the local temperature range (low temperature : high temperature) specific for each species.
We use the following formula to formulate the Specific Heat, Entropy, Enthalpy......

Where a1,a2,a3,a4,a5,a6,a7 are temperature co efficients.
Molecular Weight Function Code :-
function [Molecular_weight] = m_wt(species) %calling the functions

elements = ['H','C','N','A','O','S']; %defining the elements
At_Wgt = [1 12 14 40 16 32]; %defining the the atomic of the each species


 Molecular_weight = 0; %lets assume the molecular weight for each species to be zero


for i= 1: length(species); %now for each iteration the species for the length of each species there in the main file

 for j= 1:length(elements); % now for the each iteration of the the elements given above to the length species of each file.


  if strcmp(species(i),elements(j));  % 1)now for each iteration of the species and the elements string the function compares them
                                       %2)if the compare results in a match then it stops the loop and assigns
                                       % molecular weight of the species
                                       % 3)if not it goes to next line for
                                       % 4)futher loop change


  Molecular_weight = Molecular_weight + At_Wgt(j);   %the compared results are then stoped here,if they match.

     k=j;   % position of the loop is stored if the compare results in a mismatch
  end
 end

     n = str2double(species(i));   %then the loop runs comparing again till they results in a match.
  if (n > 1)
     Molecular_weight = Molecular_weight + At_Wgt(k)*(n-1); % then the molecular weight is considered to be this
  end

end
end
Explanation of the function code
1) First the main code calls the molecular weight function.
2) The string is then compared to the elements defined in the function from the main 'Thermo.txt' file.
3) We assume the molecular weight for each species to be zero
4) Now for each iteration the species for the length of each species there in the main file
5) Now for the each iteration of the the elements given above to the length species of each file.
6) For each iteration of the species and the elements string the function compares them
7) If the compare results in a match then it stops the loop and assigns molecular weight of the species
8) If not it goes to next line for
9) Futher loop change
10) The compared results are then stoped here,if they match.
11) Position of the loop is stored if the compare results in a mismatch
12) Then the loop runs comparing again till they results in a match.
13) Then the molecular weight is considered to be this
MAIN CODE :-
clear all
close all
clc

f1 = fopen('Thermo.txt','r');  % The file to  reAd is open

R = 8.314 ; %universal gas constant

for i = 1:5;
tline = fgetl(f1);  %skipping the line 1 - 5 of the file
end

for i = 1:53 %for every iteratio of the the file of all the 53 species

    %to obtain the name of species
    tline2 = fgetl(f1);
    a = strsplit(tline2,' '); % the first line is a string and it si split into indvidul cell array
     species_cell = a(1);   %the species name is the 1 st strinf og the 1st line of every 53 elements
    species= char(species_cell); %converting the string into a charecter


    local_temp = strfind(tline2,'.') ;   % now we find the '.' using the command
     Local_low_temp = str2double(tline2(local_temp(1)-3:local_temp(1)-1));  %local low temp for every species
    Local_high_temp = str2double(tline2(local_temp(2)-4:local_temp(2)-1));  %local high temp for every species
      Local_mid_temp = str2double(tline2(local_temp(3)-4:local_temp(3)-1)); %local mid temp for every species

 %coeffecients 1st line
  tline2 = fgetl(f1);
  coeff_locator = strfind(tline2,'E');
  high1=str2double(tline2(1:coeff_locator(1)+3)); %1st coeefcient
  high2=str2double(tline2(coeff_locator(1)+4:coeff_locator(2)+3));  % 2nd high co efficient
  high3=str2double(tline2(coeff_locator(2)+4:coeff_locator(3)+3));   %3rd high co efficient
  high4=str2double(tline2(coeff_locator(3)+4:coeff_locator(4)+3));  %4th high co efficient
  high5=str2double(tline2(coeff_locator(4)+4:coeff_locator(5)+3));   %5th high co efficient

  %coefficent 2nd line
tline3 = fgetl(f1); %reading the 2nd line

high6=str2double(tline3(1:coeff_locator(1)+3)); %6th high co efficient
high7=str2double(tline3(coeff_locator(1)+4:coeff_locator(2)+3)); %7th low co efficient
low8=str2double(tline3(coeff_locator(2)+4:coeff_locator(3)+3)); %8th low co efficient
low9=str2double(tline3(coeff_locator(3)+4:coeff_locator(4)+3)); %9th low co efficient
low10=str2double(tline3(coeff_locator(4)+4:coeff_locator(5)+3)); %10th low co efficient

%coefficient 3rd line
tline4 = fgetl(f1); %reading the 3rd line

low11=str2double(tline4(1:coeff_locator(1)+3)); %11th low co efficient
low12=str2double(tline4(coeff_locator(1)+4:coeff_locator(2)+3)); %12 low co efficient
low13=str2double(tline4(coeff_locator(2)+4:coeff_locator(3)+3)); %13 low co efficient
low14=str2double(tline4(coeff_locator(3)+4:coeff_locator(4)+3)); %14 low co efficient


Molecular_weight=m_wt(species); % calling the molecular functions
sprintf('Molecular_weight of %s=%d',species,Molecular_weight); % printing the molecular weight in the command window


%obtainig the values for cp,enthaply and entropy using the co-efficient if
 T =Local_low_temp:Local_high_temp; %DEFINinG THE the temperature range


 if (T >Local_mid_temp);  % putting the conditions for plotting of Cp , H , S

 %specific heat
 Cp = R*(high1+(high2*T)+(high3*(T.^2))+(high4*(T.^3))+(high5*(T.^4)));
 %ENTHAPLY
 H = R*(high1)+(high2*T/2)+(high3*(T.^2)/3)+(high4*(T.^3)/4)+(high5*(T.^4)/5)+(a6*(T));
 %ENTROPY
 S = R*((high1*log(T1)+(high2*T)+(high3*(T.^2)/2)+(high4*(T.^3)/3)+(high5*(T.^4)/4)+ high7));

 else

  %specific heat
 Cp = R*(low8+(low9*T)+(low10*(T.^2))+(low11*(T.^3))+(low12*(T.^4)));
 %ENTHAPLY
 H = R*(low8)+(low8*T/2)+(low10*(T.^2)/3)+(low11*(T.^3)/4)+(low12*(T.^4)/5)+(low13*(T));
 %ENTROPY
 S = R*((low8*log(T)+(low9*T)+(low10*(T.^2)/2)+(low11*(T.^3)/3)+(low12*(T.^4)/4)+ low14));

 t=sprintf('%s',species); %specifying the directory of the current folder
 mkdir(t); % making of the directory

 cd(t); %selcting the current directory
 figure(1)
 plot(Cp,T,'R','linewidth',3); %plot the Cp vs T graph
 title('Specific heat vs Temperature');
 xlabel('Specific heat');
 ylabel('Temperature');
 grid on
 saveas(gcf,'cp.jpeg');  %saving the plot in the file as jpeg

 figure(2)
 plot(H,T,'G','linewidth',3);   %plot the H vs T graph
 title('Enthalpy vs Temperature');
 xlabel('Enthaply');
 ylabel('Temperature');
  grid on
 saveas(gcf,'H.jpeg');     %saving the plot in the file as jpeg

 figure(3)
  plot(S,T,'B','linewidth',3)       %plot the S vs T graph
 title('Entropy vs Temperature')
 xlabel('Entropy');
 ylabel('Temperature');
  grid on
 saveas(gcf,'S.jpeg') ;               %saving the plot in the file as jpeg
cd ..         %this command saves the plot and then goes back one step backward in the directory folder.
 end
end
Explanation of the main code
1) The file to read is open.
2) The universal gas constant is defined.
3) The for loop is established to skip the first 5 lines as we donot need.
4) Now for every iteratio of the the file of all the 53 species a loop is made.
5) The first line is a string and is split into indvidul cell array.
6)The species name is the 1 st string of the 1st line of every 53 elements.
7)We are converting the string into a charecter
8)now we find the '.' using the command to find the local (Min : Max) temp of each species respectively
9)local low temp for every species is defined
10)local high temp for every species is defined
11)local mid temp for every species is defined
12)The coeffecients 1st line is defined
`because` First 7 co-efficients are all high temperature .
13)The coeffecients 2nd line is defined
14)The coeffecients 3rdline is defined
`because`Last 7 co-efficients are all low temperature .
15)Next we find the molecular weight of each species
16)We call the molecular functions (Explanation of the function is provieded above)
17)Printing the molecular weight in the command window is then done using sprintf
18)To find the Specific Heat, Enthalpy & Entropy we use an if else statement to put conditional plotting
19)If the local low to high temperature of each species is taken as the reference
20)If the temperature is more than the local mid temperature then the high temperature coeffcient is taken to plot the graph but if the it is low then the lower coefficients are taken into an account
21) We also need to save thoose plots in the specific folder with each individual species being its folder name
22)First the folder directory is setup
23)Then the directory is made by specifying the path.(The last "cd .." command is used to tell the program to save a plot and then come back to the parent folder after saving the plots of all the Entropy,Enthalpy and Specific Heat.)
24)Then we plot the graphs of each individual species
25)We save the plots of each species by the their respective species name
26)While saving the plots the format to which is to be saved needs to be specified.
Attachments (i)
Screenshots of the molecular weights :-
1)
Attachments (ii)

Windows screen shot of all the elements.
Attachments (iii)(O2)
1)
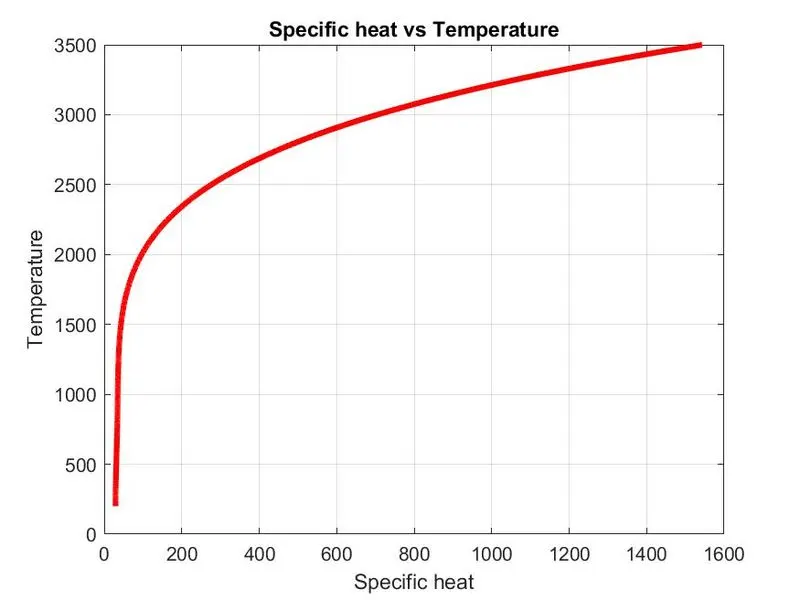
We see that the temperature is inversly proportional to temperature from the plot. We see that the specifc heat rises instantaneously for the combustion. from 1st law of thermodynamics.
2)
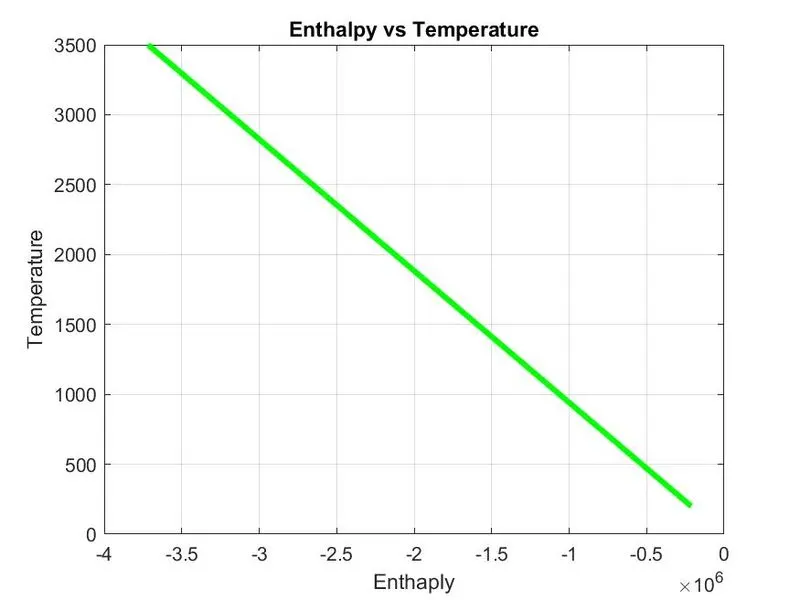
We know enthalpy is linearly proportional to the temperature as the temperature increases the enthalpy increases from the 1st law of thermodynamics
3)
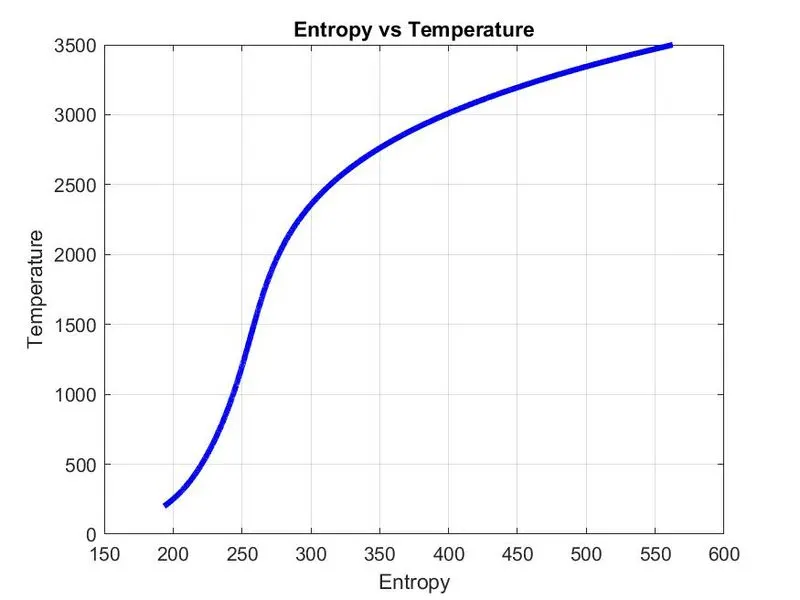
We know that the entropy is directly propotional to the log function of temperature so we should get a asymptotic curve which we are getting.
(N2)
1)
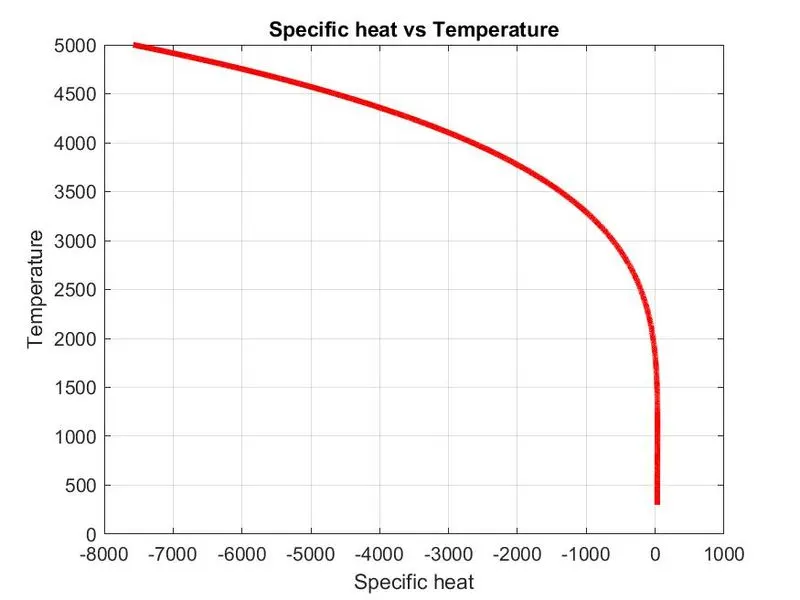
We see that the temperature is inversly proportional to temperature from the plot. We see that the specifc heat is rises instantaneously for the combustion. from 1st law of thermodynamics.
2)
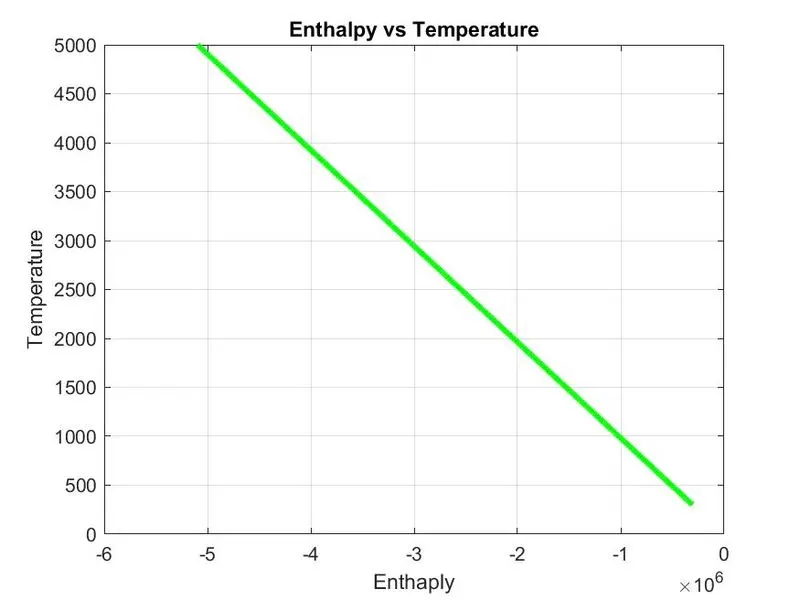
We know enthalpy is linearly proportional to the temperature as the temperature increases the enthalpy increases from the 1st law of thermodynamics
3)
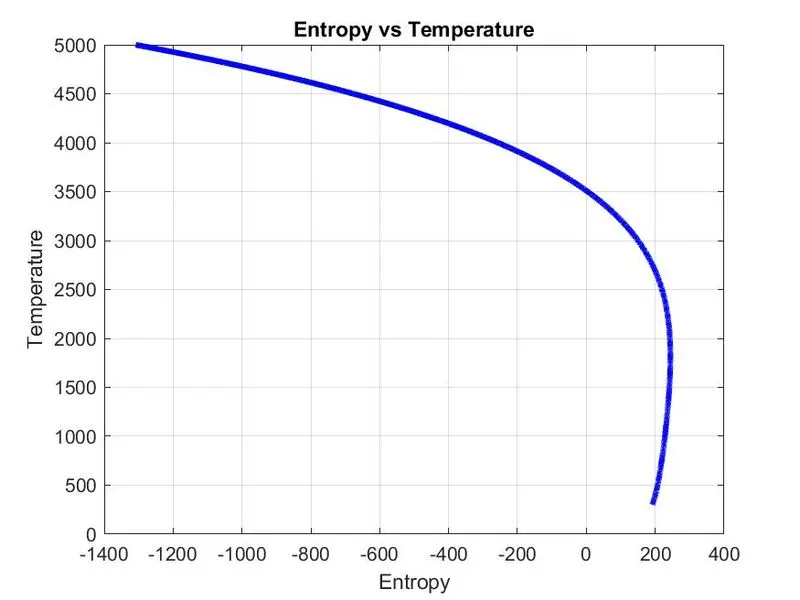
We know that the entropy is directly propotional to the log function of temperature so we should get a asymptotic curve which we are getting.
(Co2)
1)
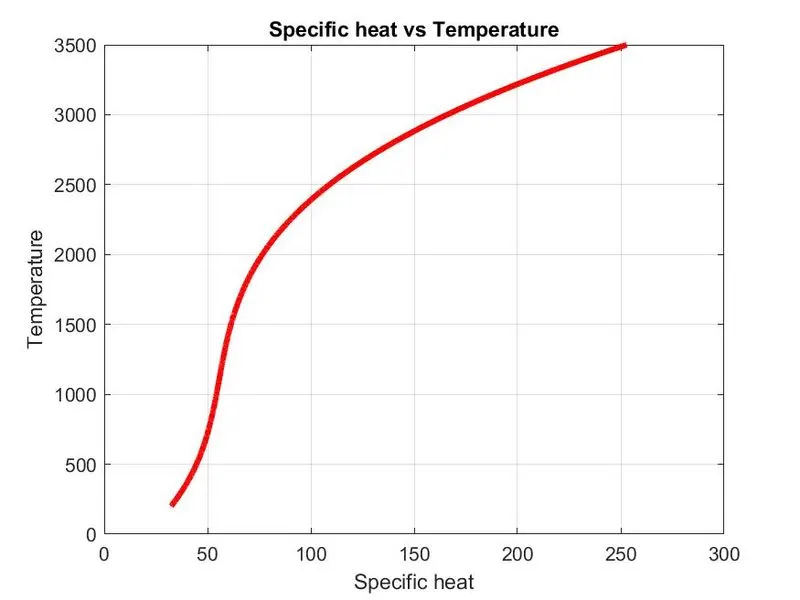
We see that the temperature is inversly proportional to temperature from the plot. We see that the specifc heat is rises instantaneously for the combustion. from 1st law of thermodynamics.
2)
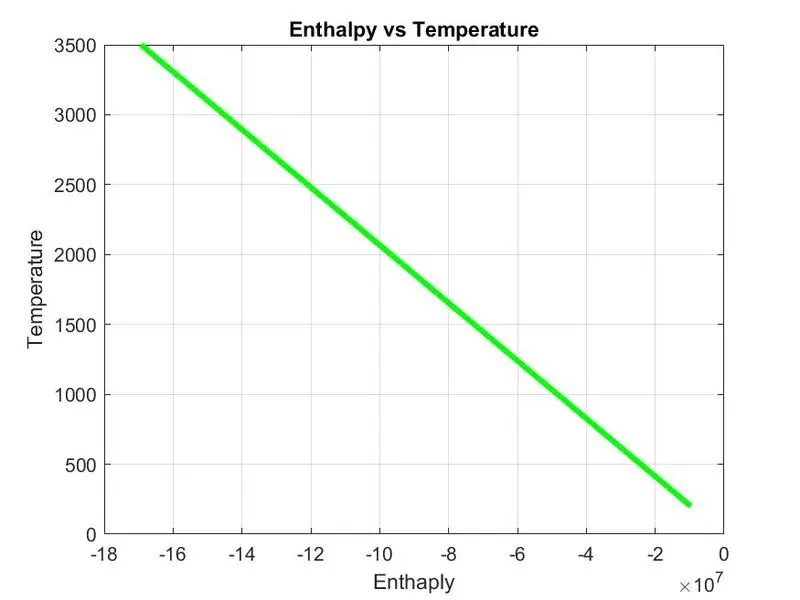
We know enthalpy is linearly proportional to the temperature as the temperature increases the enthalpy increases from the 1st law of thermodynamics
3)
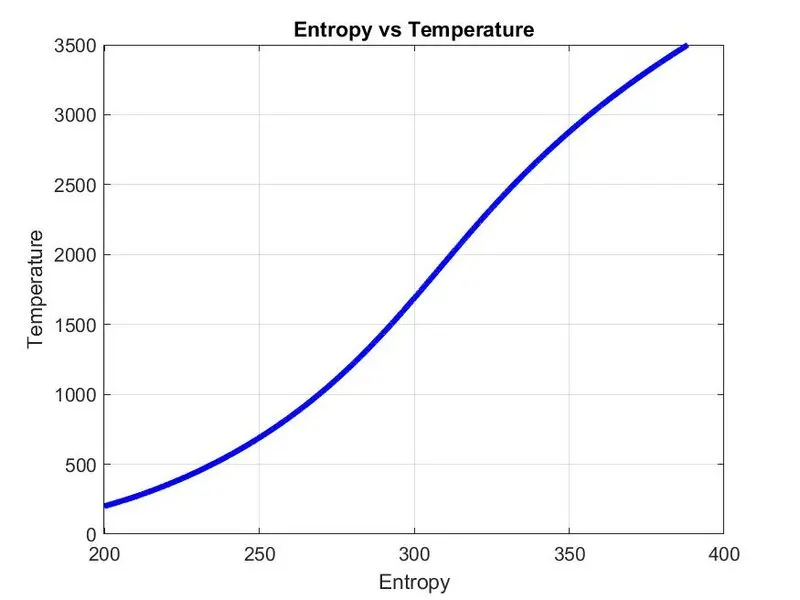
We know that the entropy is directly propotional to the log function of temperature so we should get a asymptotic curve which we are getting.
References