Project 1
1.ans.:- Objective:- To Develop a Hydraulic Model for a Major River selected from particular area i.e. Entering cross sectional data, creating geometry of river, Calculating catchment area over a River reach of 10 Km and do flow calculations for the river using UH method. Considering Steady flow analysis and run the simulation model for different profiles.
Tools used:- Toposheets, Google Earth Pro, MS excel, Cross sectional data, Flood estimation report by CWC, HEC-RAS, Autocad, 25 and 100 year isopluvial data etc.
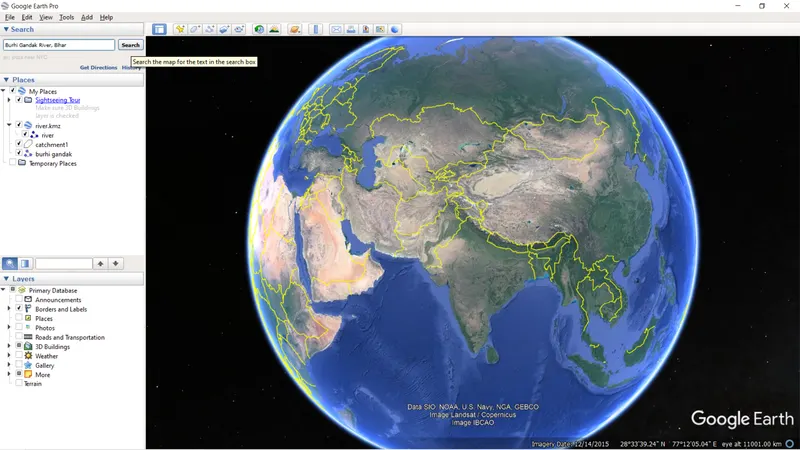
At first we need to to select a river for developing hydraulic model. For this, launch the google earth pro and look for a major river in the desired area or search for a river you desire in the area.
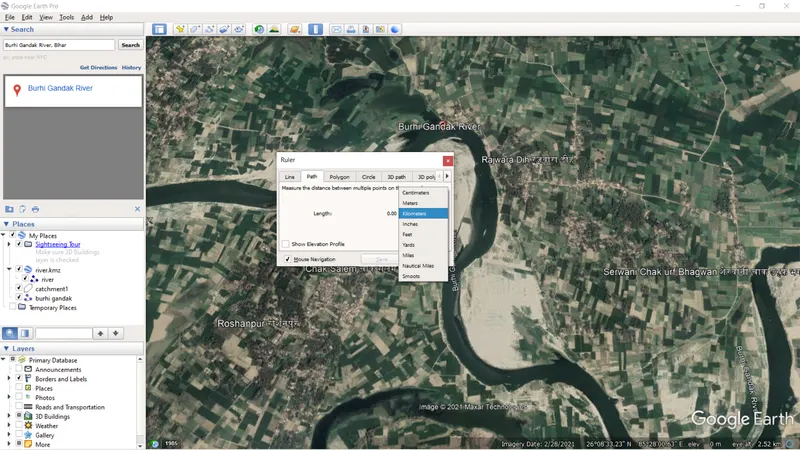
- Now, we have to create the path for considering reach of the river. For this we will select ruler option from google earth window and select path option in ruler dialog box. Keep unit of path in Kilometers.
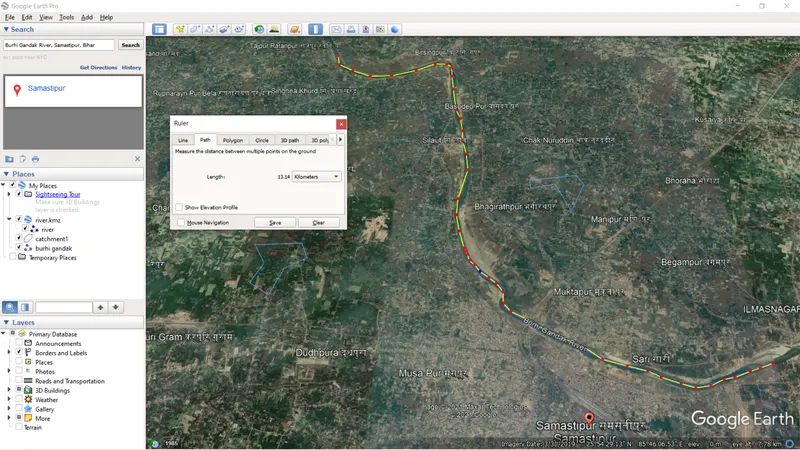
- Using ruler tool, keep drawing a path for the reach of the river we want to consider. After path is completed select save option from ruler window.
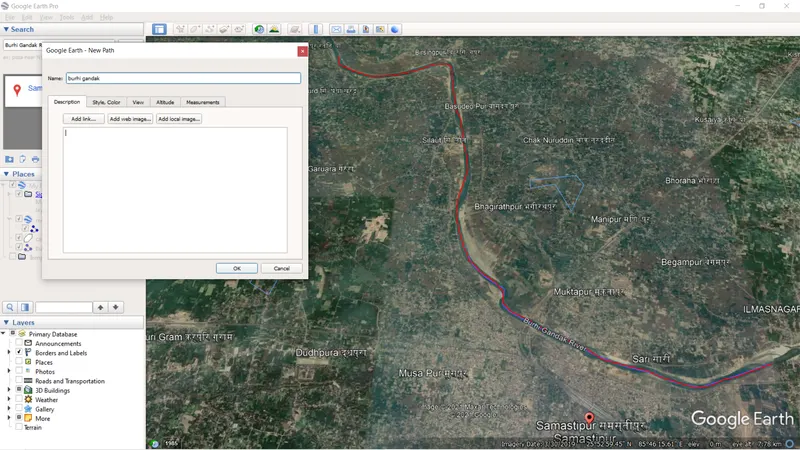
- Give a name to the drawn reach and select OK button.
Now to find catchment area we will use toposheets of the desired area and use it in autocad to find area.
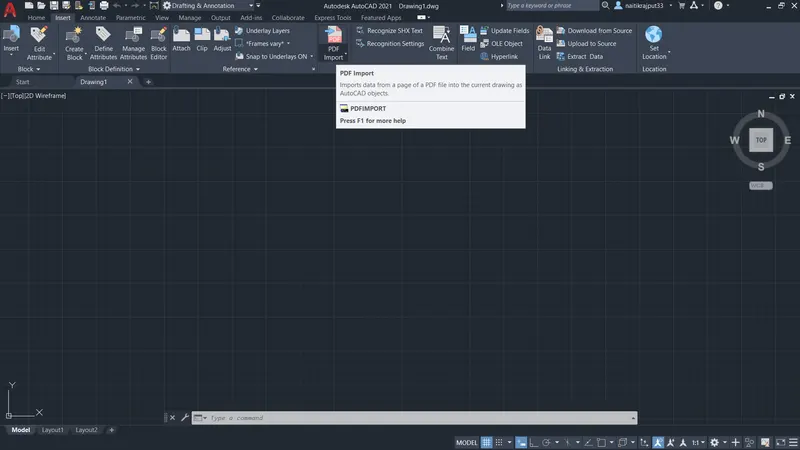
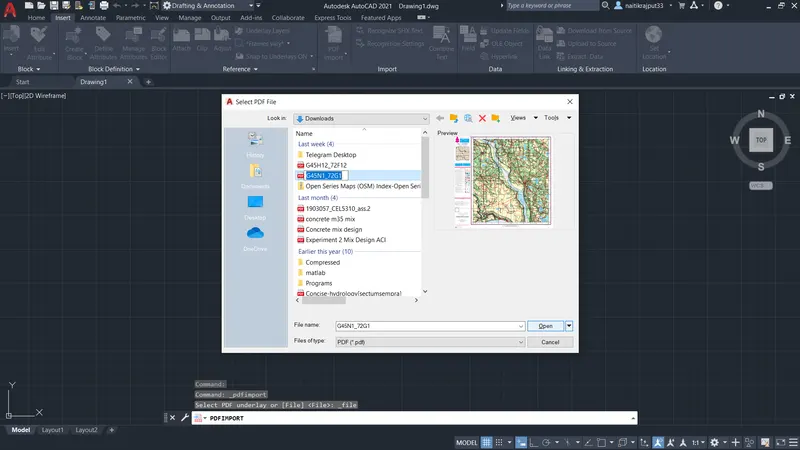
- On main window of Autocad, click on the insert option from menu bar. In insert menu, search pdf import option and select it. A dialog box will appear to select desired pdf file. In look in option select downloads folder and select the downloaded toposheet. After selecting file click on Open button.
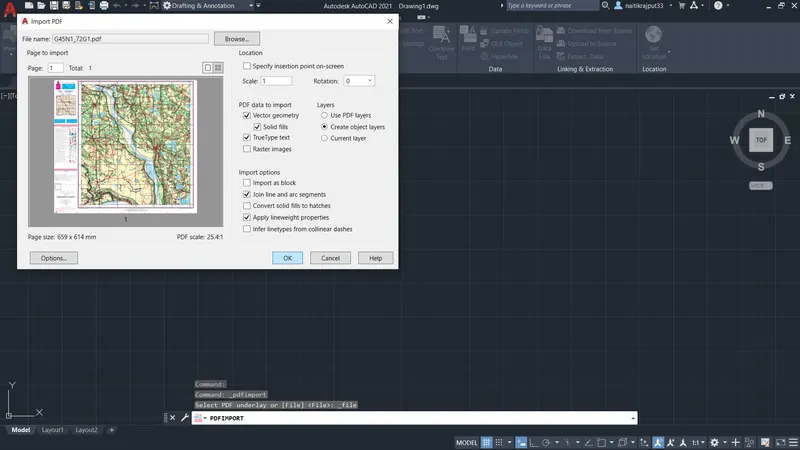
- An import pdf dialog box will appear asking various properties for import. Select and modify properties such as layer etc. as you desire and click on OK button. It will take some time then after to load in autocad.
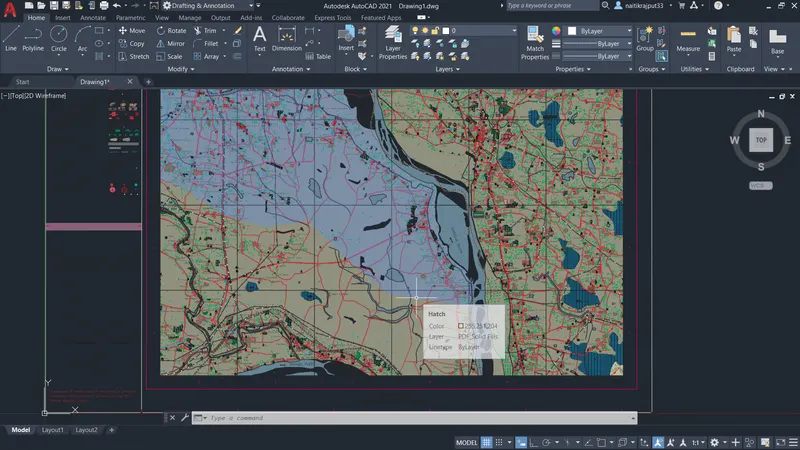
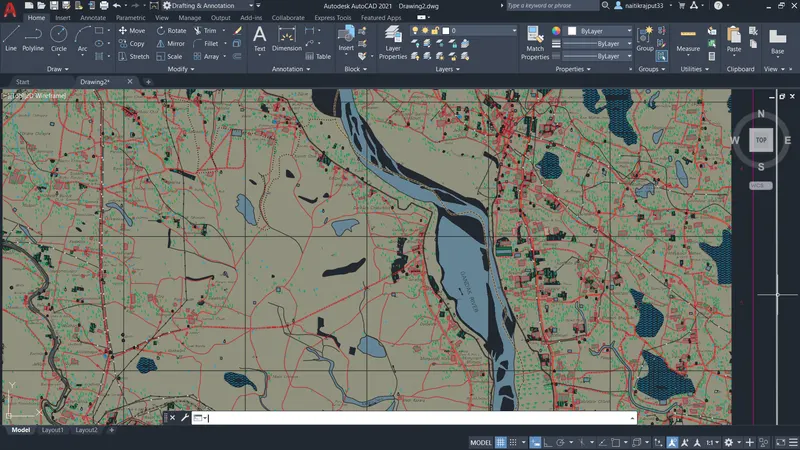
- After being loaded, now we need to select a catchment find its area. For this, zoom in the sheet an look for a river in the sheet.
- By zooming in, we see a river named gandak river as shown below. trace its whole path and see properly.
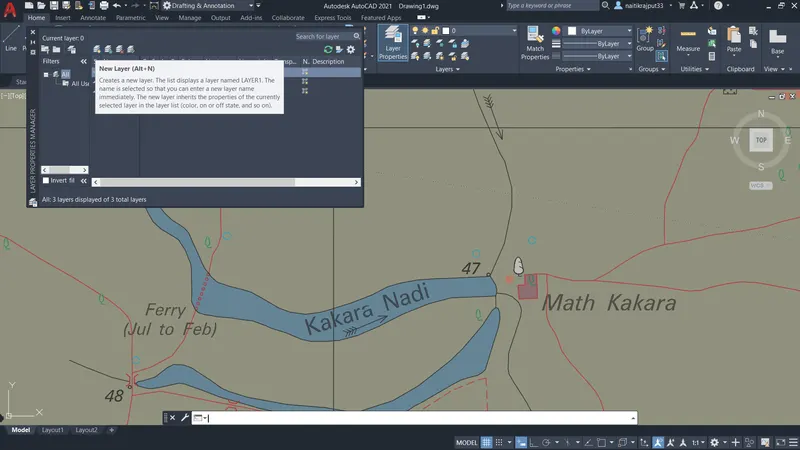
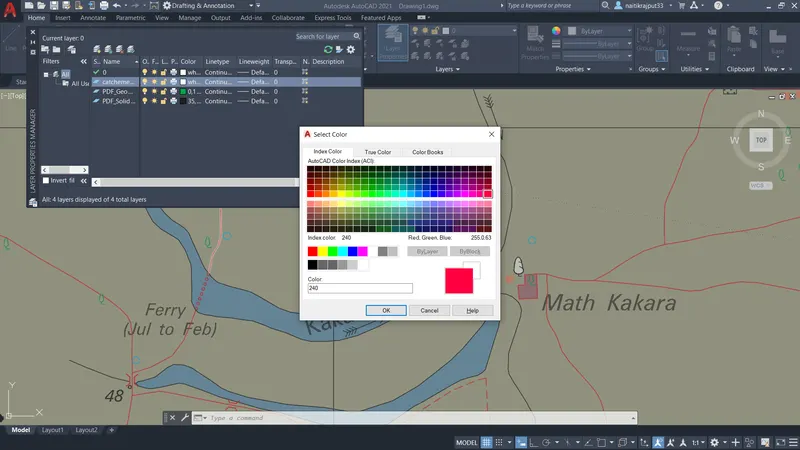
- Now for our convienience, create a new layer so that we can distinguish our catchment area from sheet. Go to layer properties and select create a new layer logo. Give a name say, catchment area to new layer and slect a colour for layer, say yellow.
- Now select Catchment area layer in layer option to work on. Click polyline tool to draw a catchment over selected river.Click on starting point in gandak river and draw a desired catchment.
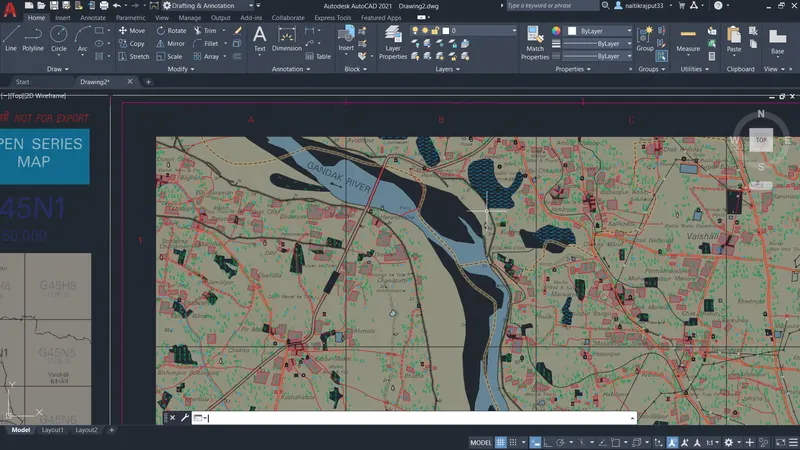
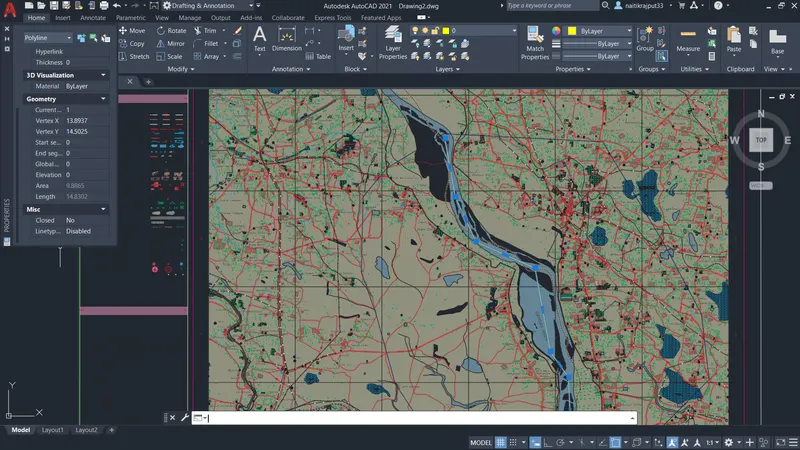
- After drawing a catchment exit from polyline tool. Select the drawn catchment and search properties or list tool and select either of two. In bottom part of properties dialog box, that will appear after selecting properties option we will look for area option. There we will find required area of catchment in unit of sq kms. For our selected part as shown above it comes out to be 130.8415 sq. kms.
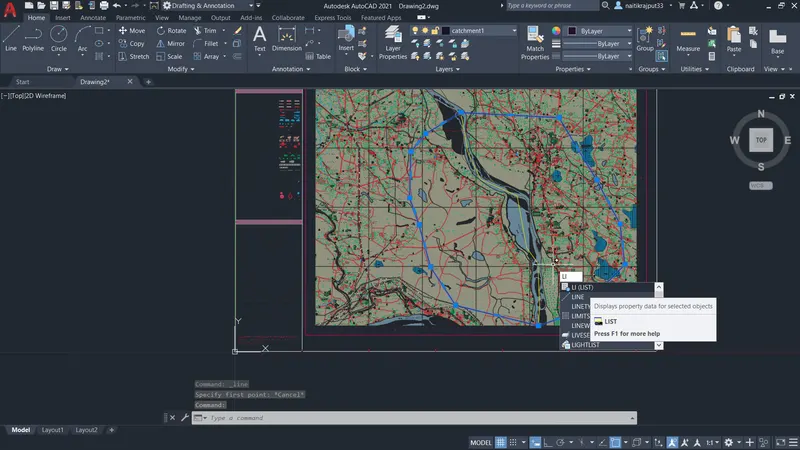
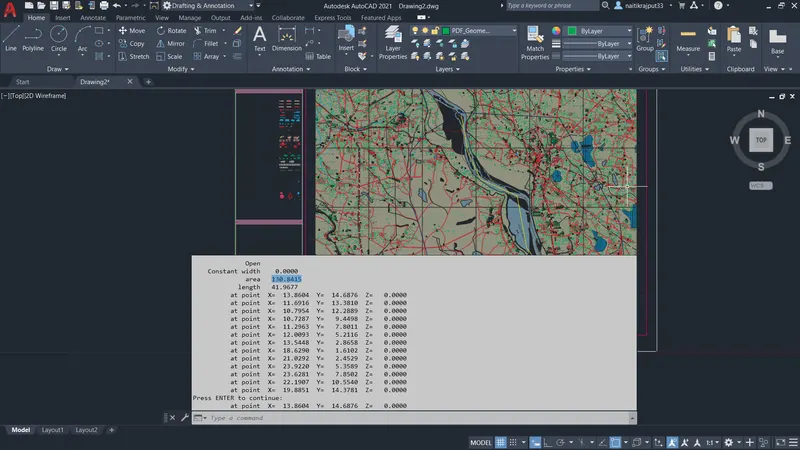
Thus all these steps will give us Area for a required catchment, selected from a toposheet of a particular area.
Now we have to go on HEC-RAS for our project of developing a Hydraulic model of the river. For this at first we need to define a project.
- Launch HEC-RAS and go on to file menu --> New project. Give a name to your project say PROJECT1 and specify a location to save project. Then after click OK button. A box as shown will appear.
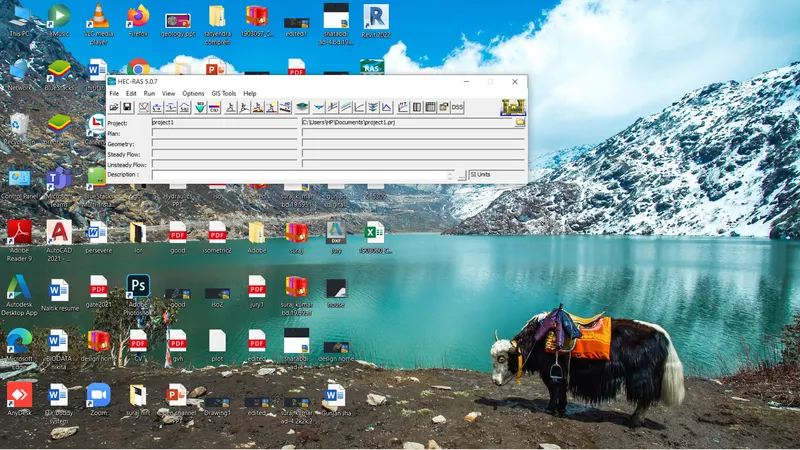
- Now we need to define geometry of the river and enter cross section data for our project. Go on to view/edit geometric data option and select river reach button. Draw a river as per selected and give a proper name to river and its reach.
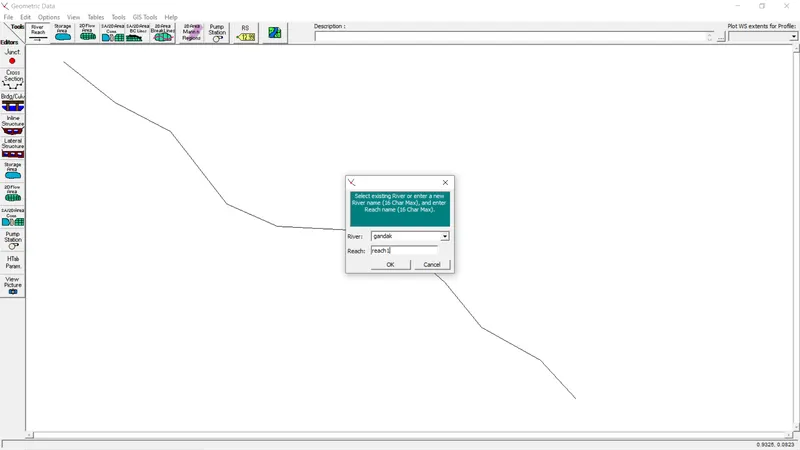
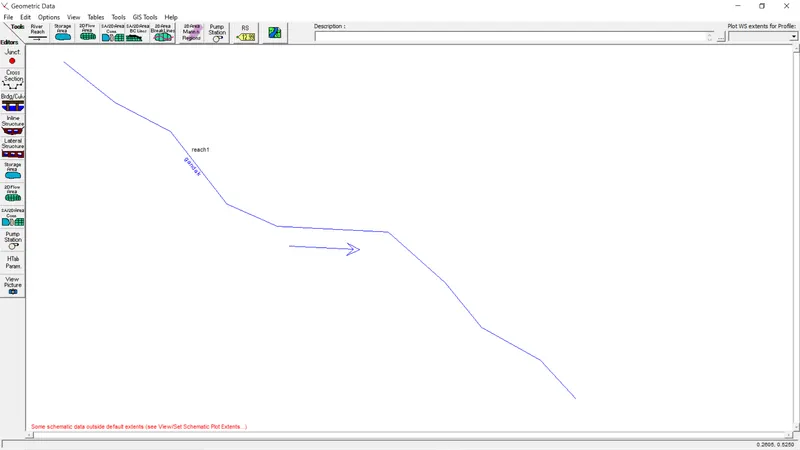
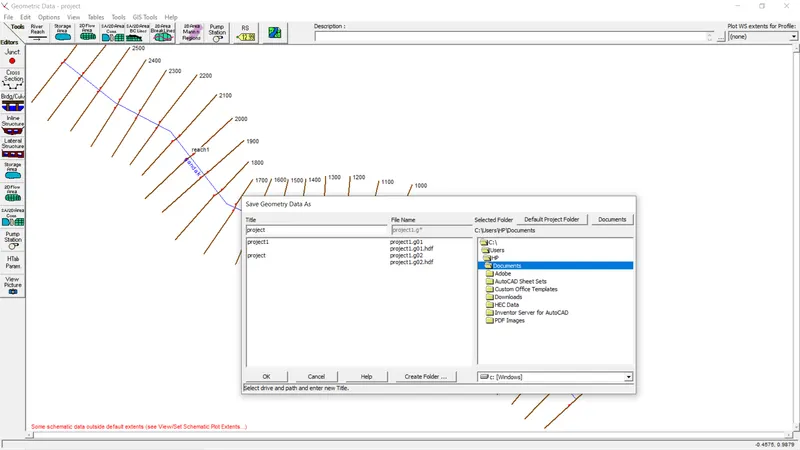
- Now save the geometry by going to file menu--> Save geometry data as option. Give a name and location to your geometry and click on ok button.
- After this data is saved, go on to Cross section option in middle left corner of Geometry data box. Cross section data dialog box will appear. go on to options menu and then select add a new cross section.
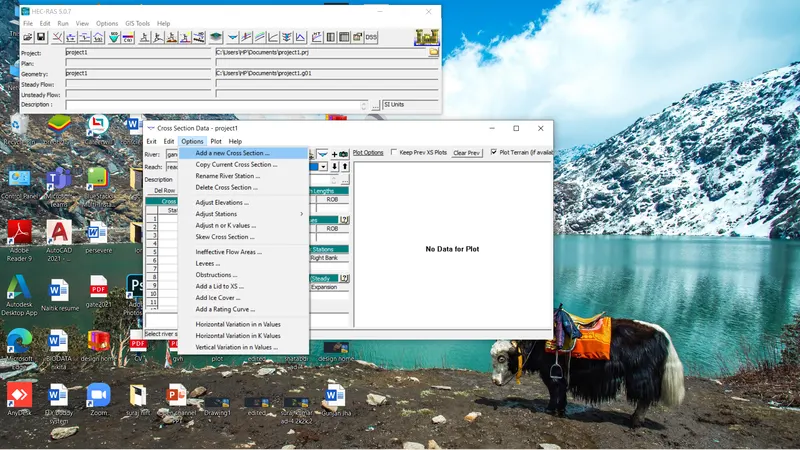
- Then a dialog box will appear asking name of station for which data is to be entered. Enter the name of River Station for which data is to be entered and click OK.
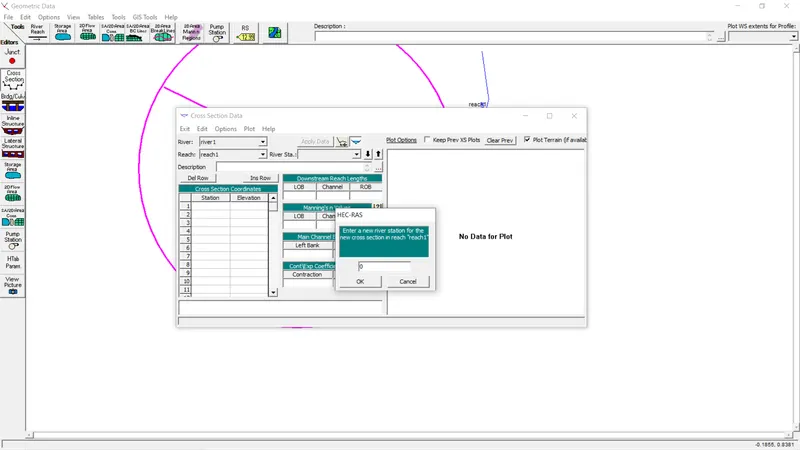
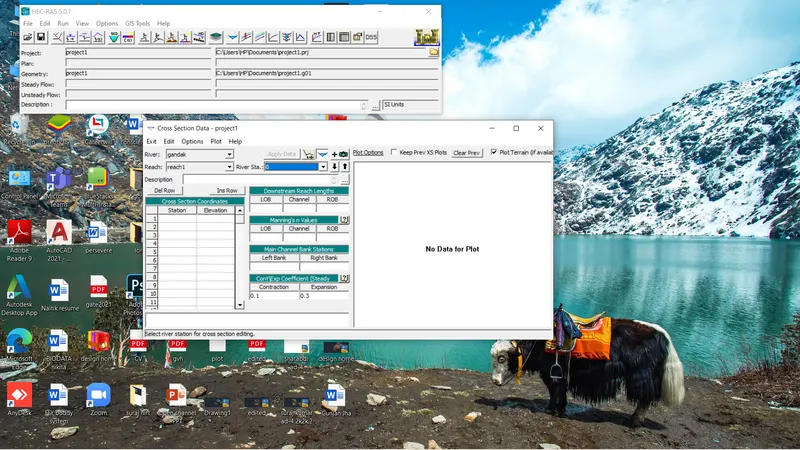
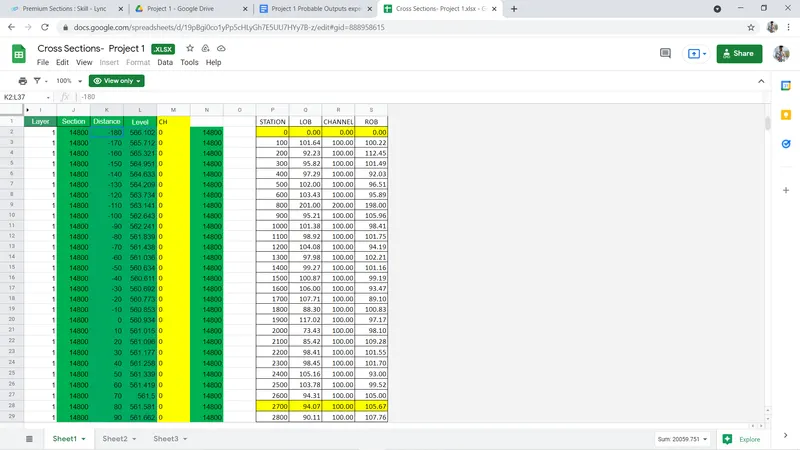
- Now select the data from the excel file where it is stored and Copy from there complete data for a given river station say station 0 at first. Then come to Cross Section Data window and click on empty block before of station block and above of serial 1 block. This will select complete rows and columns for entering of data. Paste using ctrl+v. Now enter dwnstream reach lengths LOB ROB for a Channel form the excel sheet and Manning's n Values as obtained.
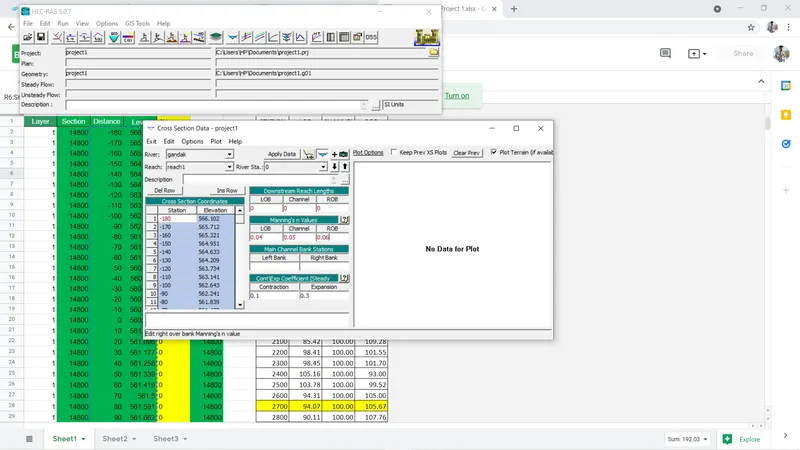
- After entering all data, click on Apply Data button. Data will be plotted in same window. Now select a Main channel bank station in the plot and select a Left Bank and Right Bank and enter data in cross section data window. Again click on Apply Data and final data will be plotted.
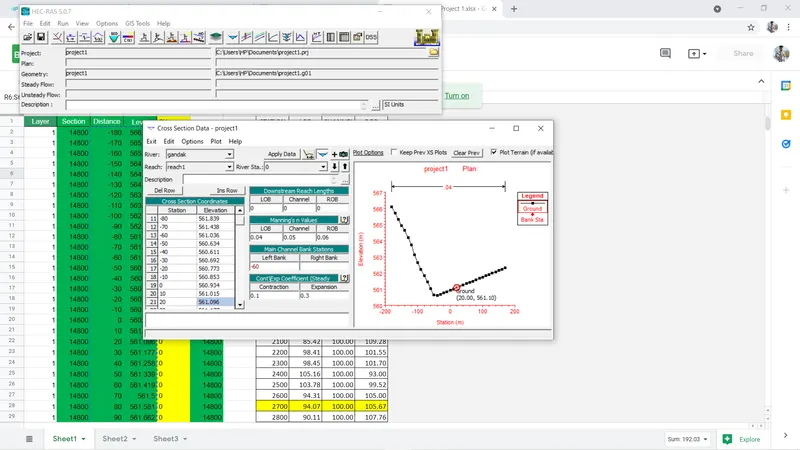
- Now Data for river station 0 is plotted. Again go to Options-->Add a New Cross Section. Enter a new River station and Repeat the steps above to plot the data.
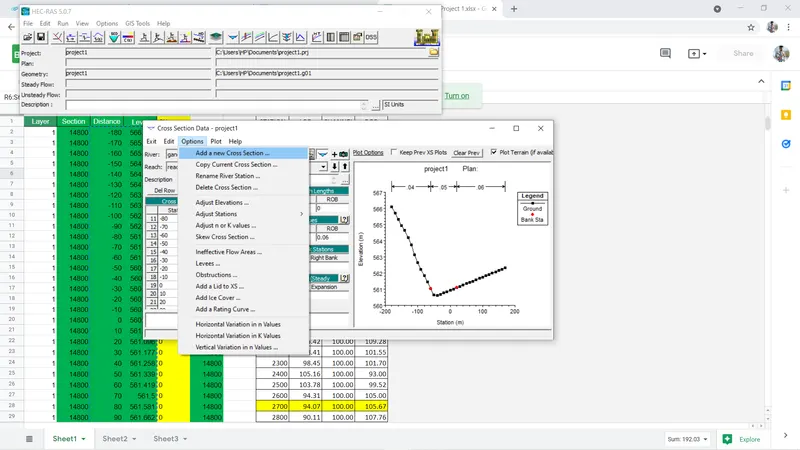
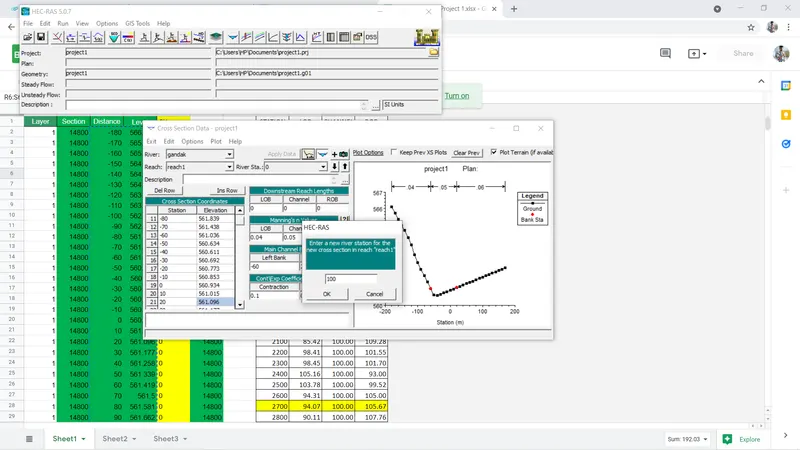
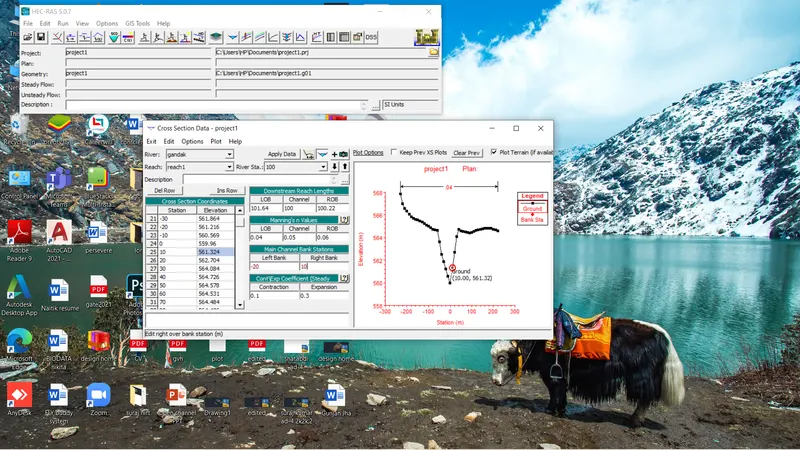
- Repeat the steps above until all stations data are inserted and plotted.
-
After entering all the cross section data for all river reaches and river stations we need to save our geometry data. For this exit the cross section data window and click on File menu on Geometry data window. Select Save the geometry file as button. Sava as dialog box will appear.
Give desired name to your geometry project file under title option and select desired location to save the geometry file and click on OK. Geometry File is saved under given project.
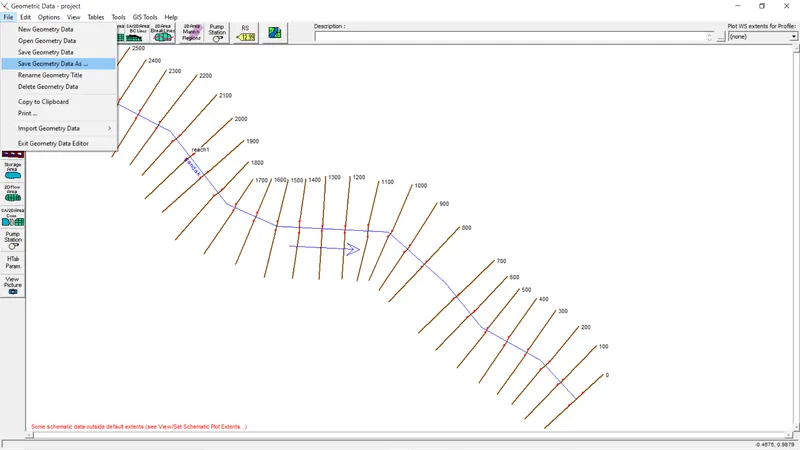
Now, we need to calculate flow of the river using UH method. For this we will need raw data and parameters to draw a UH for a river flow. We need to download flood estimation report by CWC for any desired river basin as per our choice and use it, as shown below.
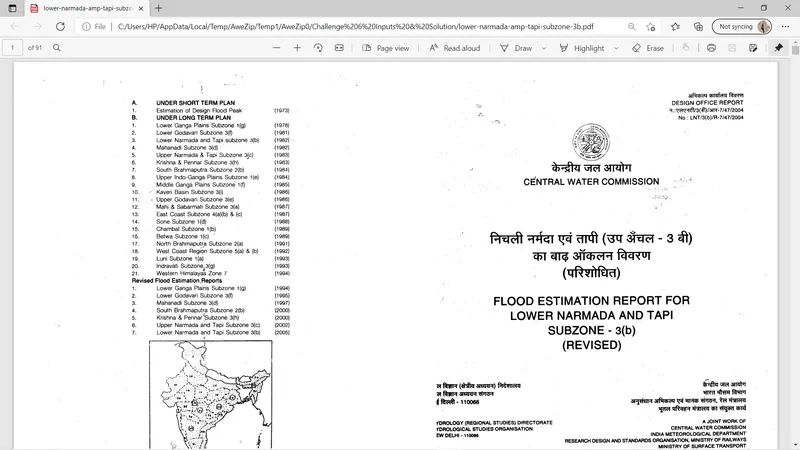
In this file we will find all data required fo our calculations and will use it as per our need as shown in steps below:
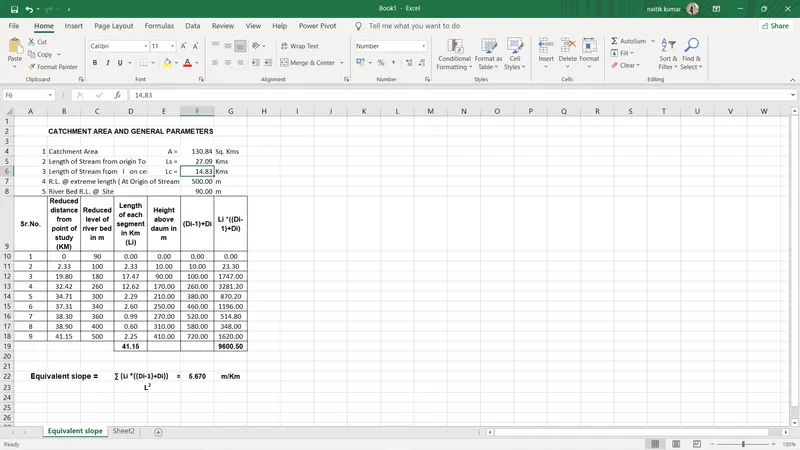
- First of all we need to find Equivalent Slope. For this we calculate catchment area and length of stream from origin to site and from Centroid to side Using Autocad as shown above and store it in a Excel sheet. Reduced distance from point of study and reduced level of river bed, Height above Datum at certain points are found by survey and stored. Now we will find formula to derive equivalent slope in mentioned manual and will calculate it using Excel.
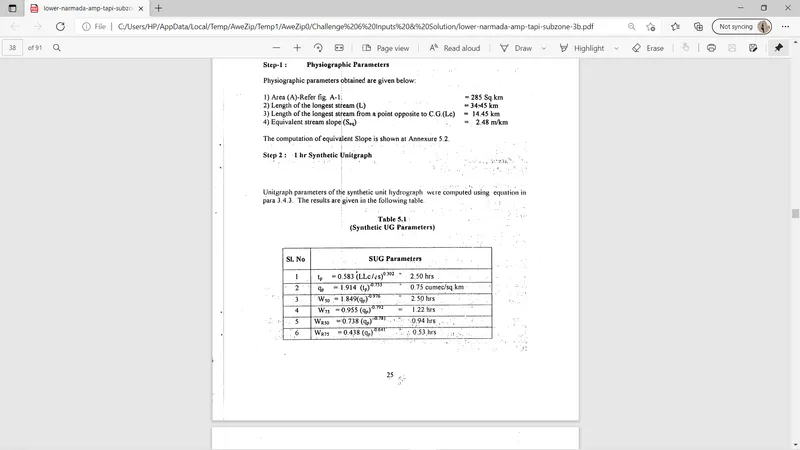
Now after Equivalent Slope is calculated, We need to calculate SUG Parameters using formulas from used Report and draw SUG.
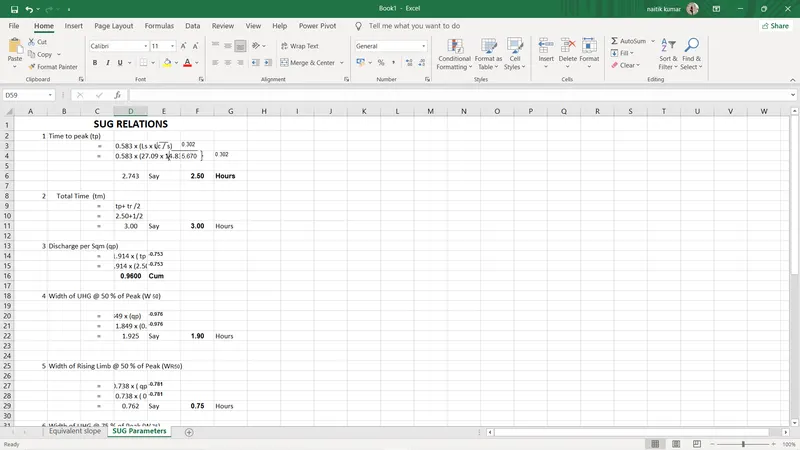
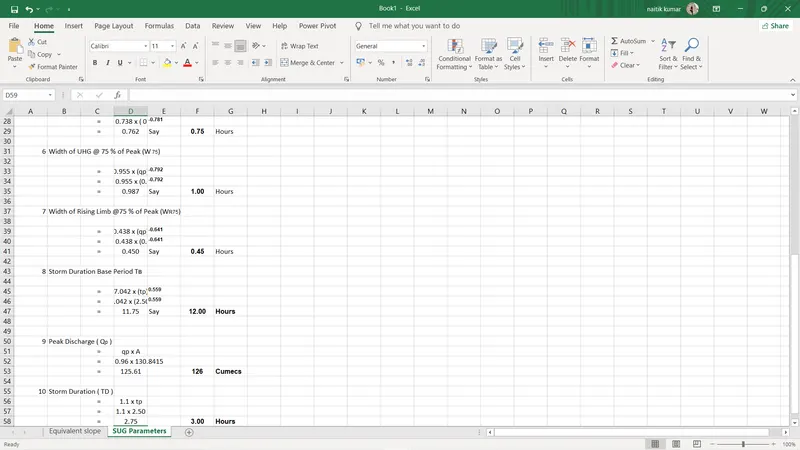
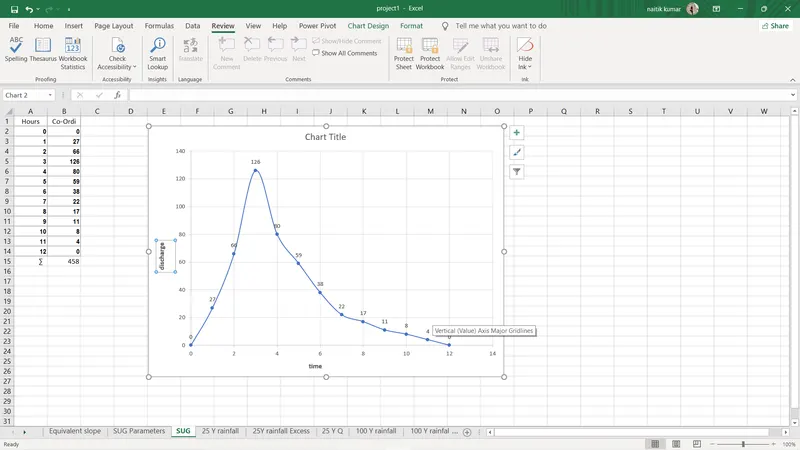
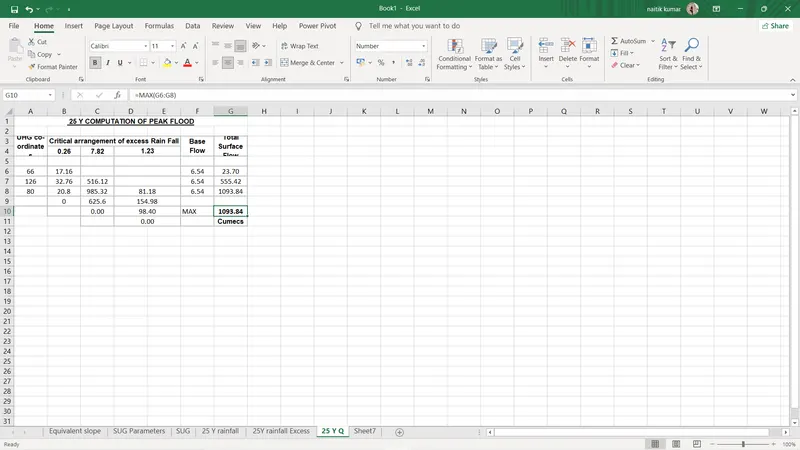
- Now when SUG is plotted we will find major coordinates for our storm duration. from this plotted graph we will see SUG coordinates 66,126 and 80 as our storm duration of 3 hours for calculating flow.
After all parameters for SUG is calculated we move to find last 25 and 100 year rainfall and rainfall excess and flood estimation using these last 25 and 100 year's data from used Flood estimation report of CWC. For this we first need to find latitude and longitude of project which will be done by google earth pro by following steps:
- Launch Google Earth Pro and Open the Place saved for the project. Move Hand icon to the place whose latitude and longtitude is to be determined and see in the bottom right corner of the screen. we will find latitude and longtitude of desired location.
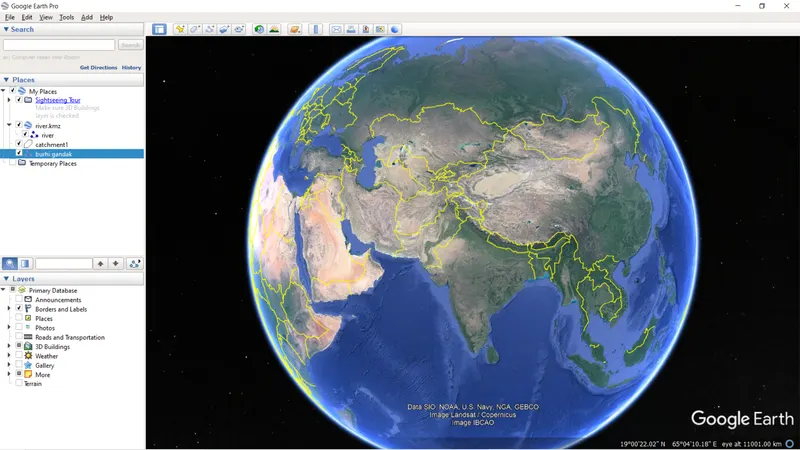
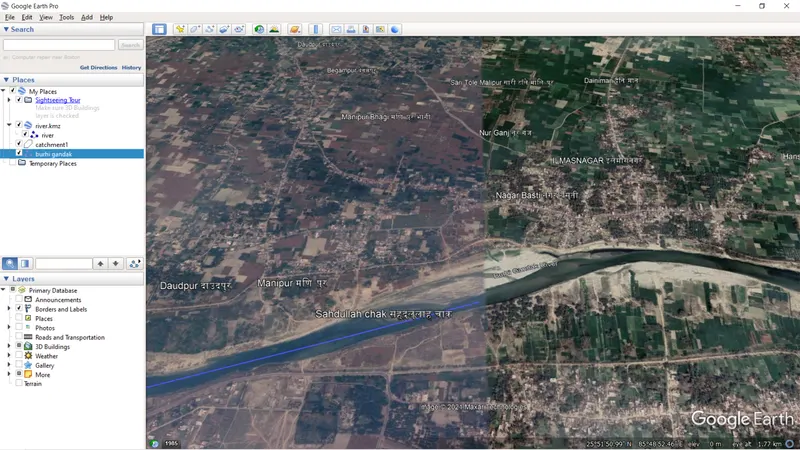
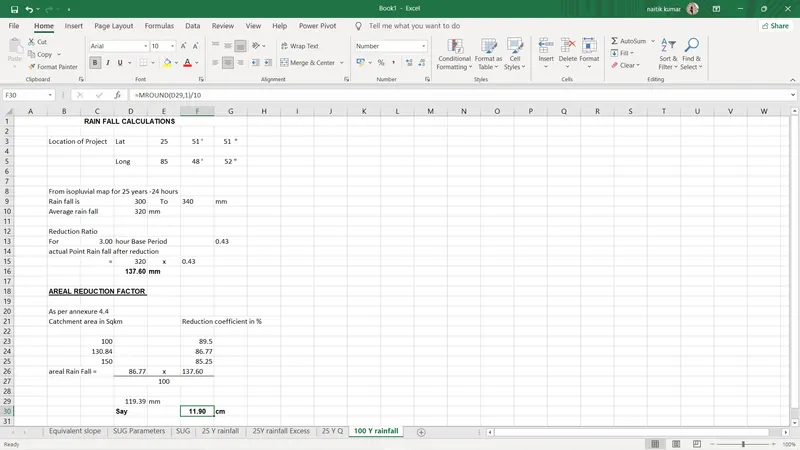
From here we will find latitude and longtitude of our project. Now using CWC Report, from Isopluvial maps we will find rainfall data of last 25 years over the region and also hourly and areal reduction factors of the rainfall. Average Rainfall for last 25 years will be calculated from this.
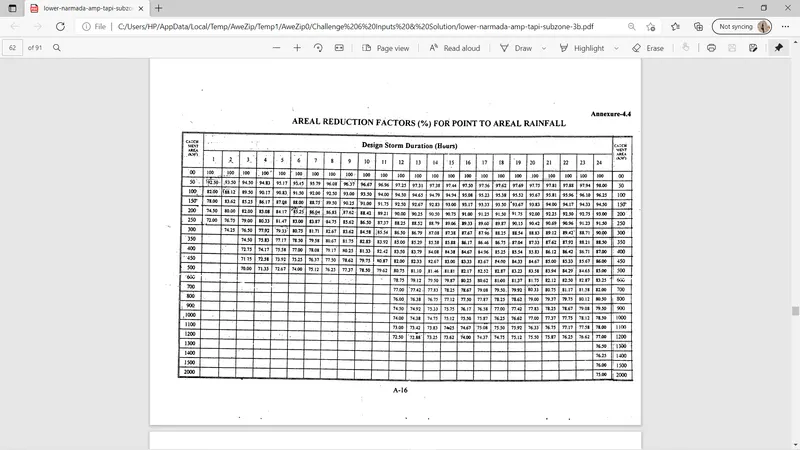
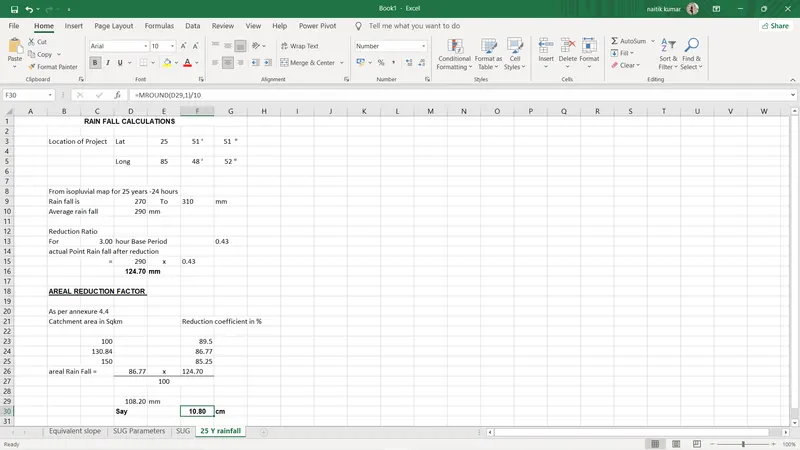
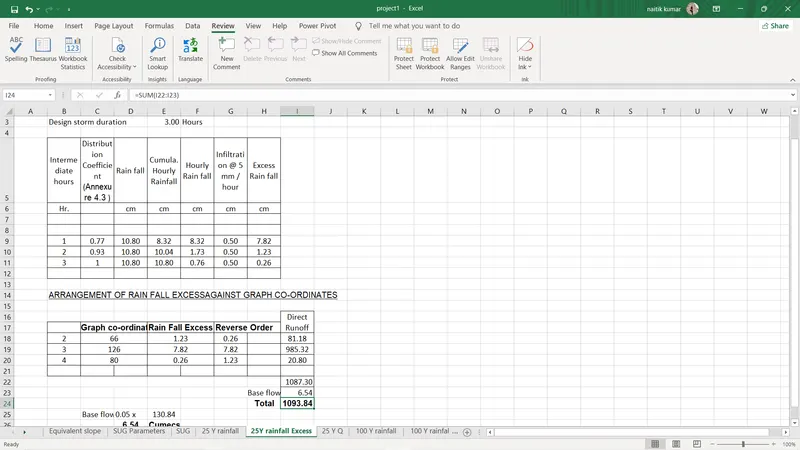
Thus after this we have found Rainfall of 10.80 cm for last 25 years.
- Now we will calculate rainfall excess over last 25 years rainfall.For this distribution coefficient for storm duration is seen from the CWC report and Excess rainfall is calculated over all intermediate hours during storm and rainfall excess is arranged against graph coordinates. Maximum excess is kept against peak coordinate and direct runoff is calculated for all coordinates. Base flow for the catchment area is calculated and added to total direct runoff to Find total Flow of river.
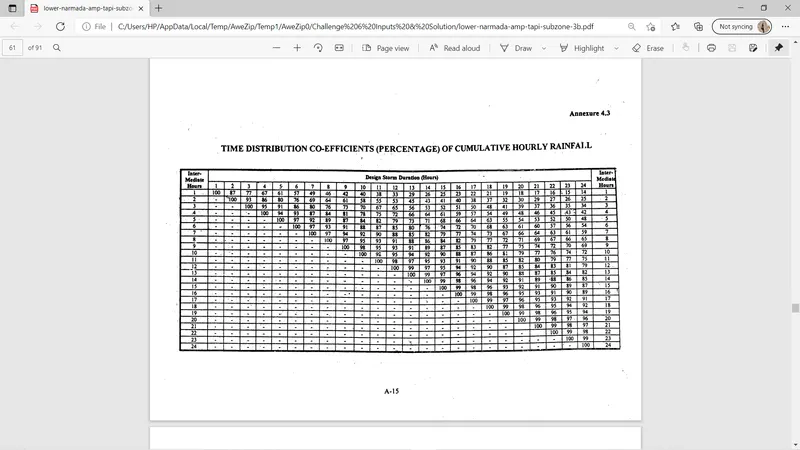
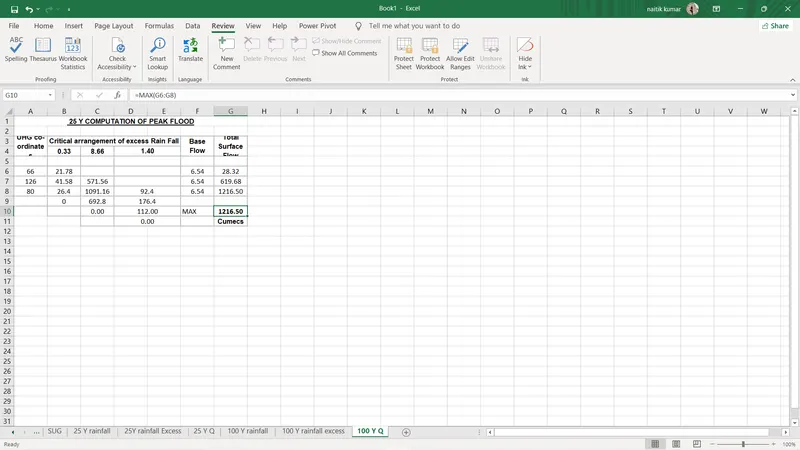
- Now finally 25 year computation of peak flood is done by using arrangement of UHG coordinates against rainfall excess in ascending order and calculating Maximum flow at last.
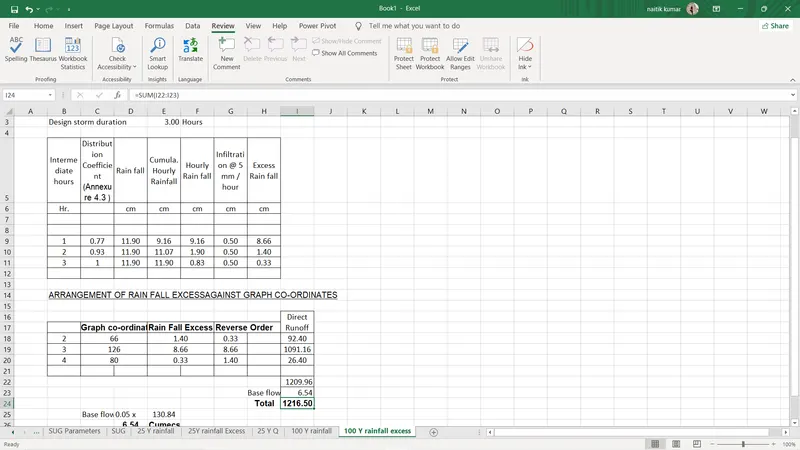
Now, for estimating 100 year peak flood we will repeat steps same as done above, only change will be of taking data of last 100 years instead of 25 years.
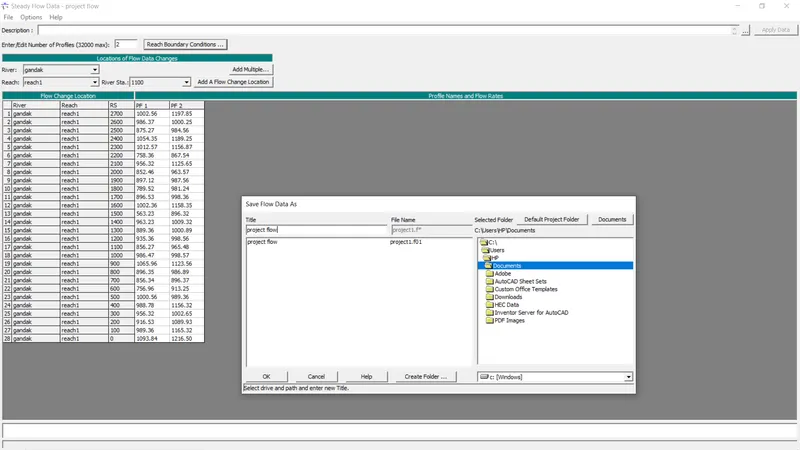
Now Flow data of the river has been calculated and we need to store this flow data now in HEC-RAS for our project. For this, Launch the HEC-RAS and open the project under which flow data is to be saved.Click on View/Edit Steady Flow Data option and Steady Flow Data dialog box will appear.
In the Enter/edit number of Profiles box enter a value 2 as we whave last 25 and 100 years, 2 flow data to enter. Select the river and reach for which data is to be entered and enter the flow data in front of respective river reaches and RS.
If you want to add more location, click on add multiple button and select desired river reaches and RS to be added and click add button. finally press OK. Give a boundary condition for all profiles.
After all data is entered Click on Apply Data and we need to save data now. Go to Save Flow data as option under File menu and save as dialog box will appear. Type desired name for your data and select desired folder where you want to save and press OK.
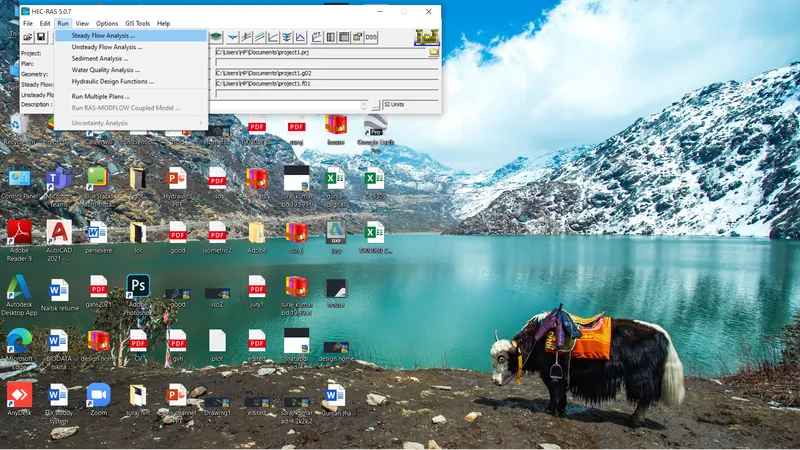
Now all, Geometry data and flow data of our selected river is entered ready to develop a hydraulic model. For this now we will run a steady flow analysis simulation for our developed model. Go on to the Run menu and select Steady flow analysis option.
- A dialog box will appear asking geometry file and steady flow file. select the files as created above and give a name to the plan. slect the flow regime as desired.
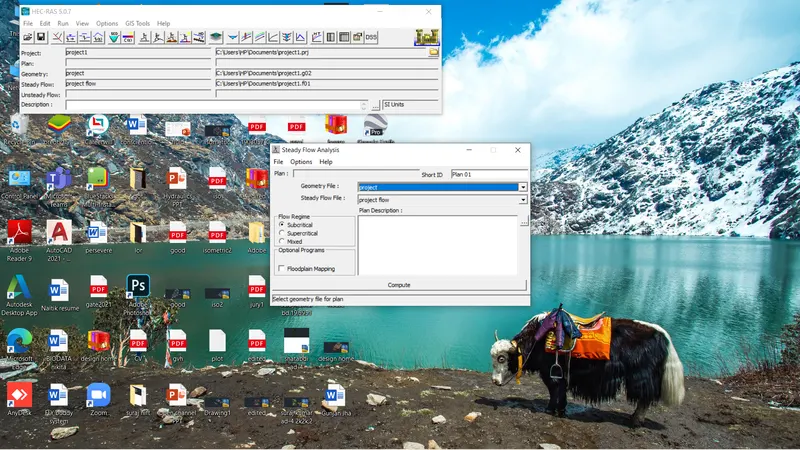
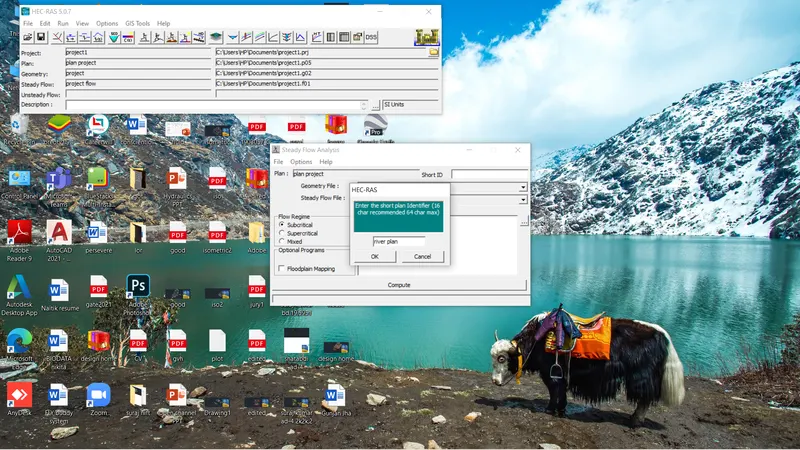
- After that click on compute button and stedy flow analysis simulation will be done. After computations are done a window as shown below will appear.
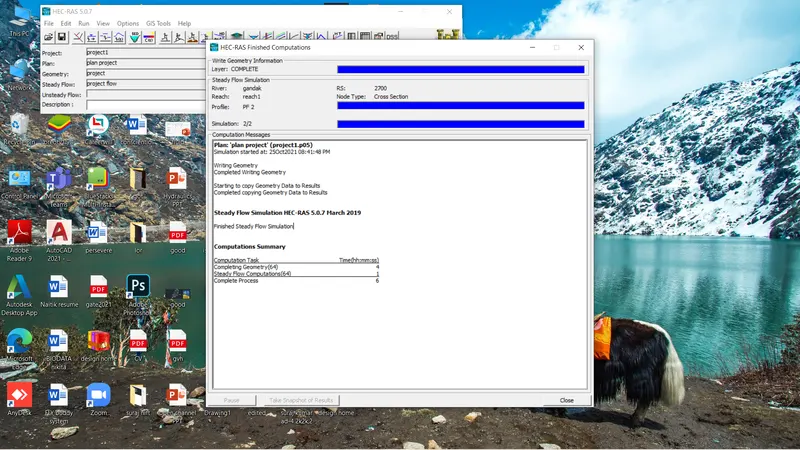
Thus after all this procedures our Model is developed and we can see output by various options provided on Main window of HEC-RAS like View cross sections, view profiles, view general profile plot, view computed rating curves, view output tables, XYZ perspective plot etc. All these outputs are attached below for the project listed above. We can switch reaches, river stations and profiles in different tables as per our requirements.
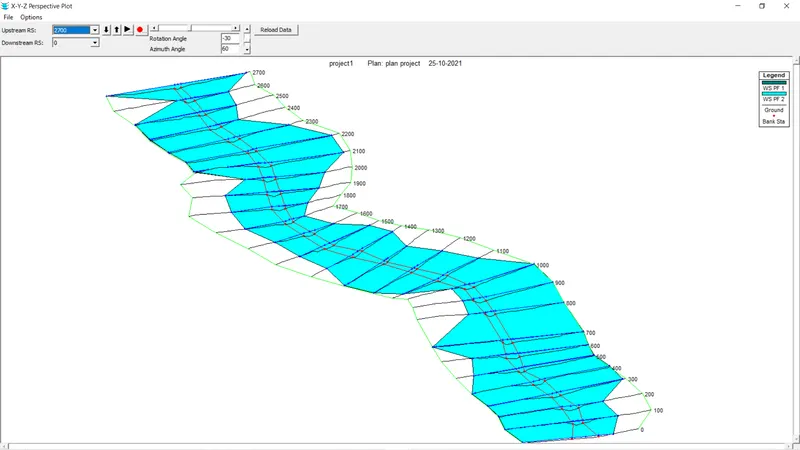
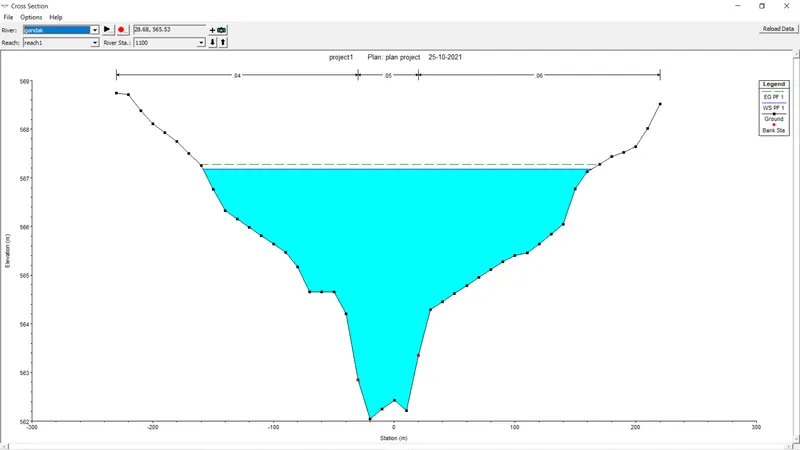
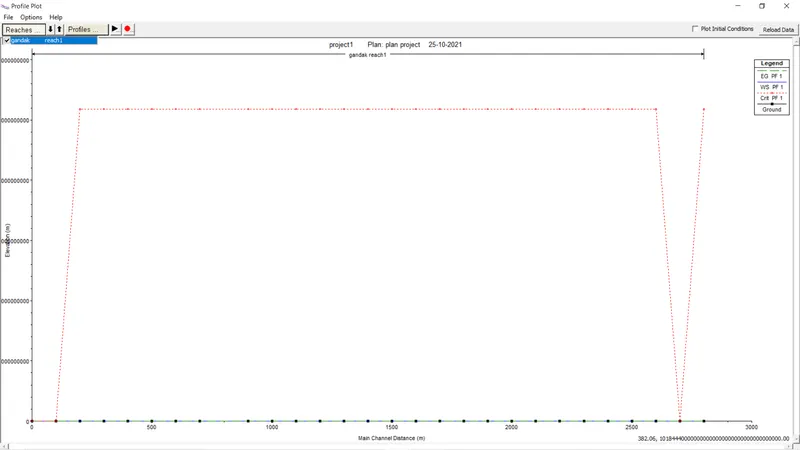
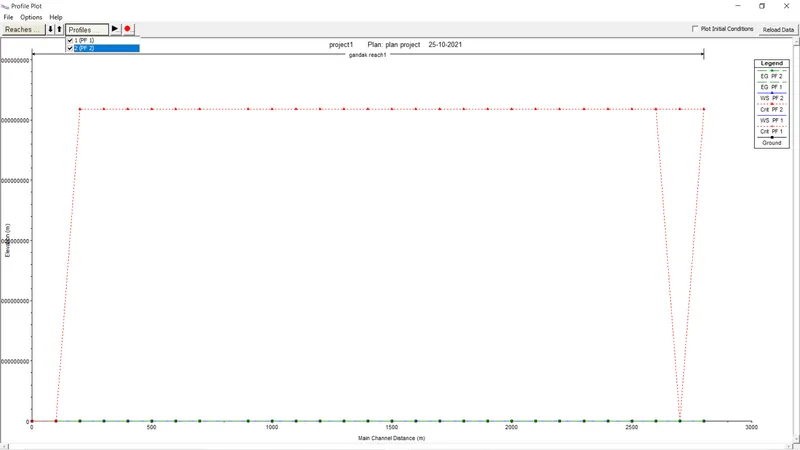
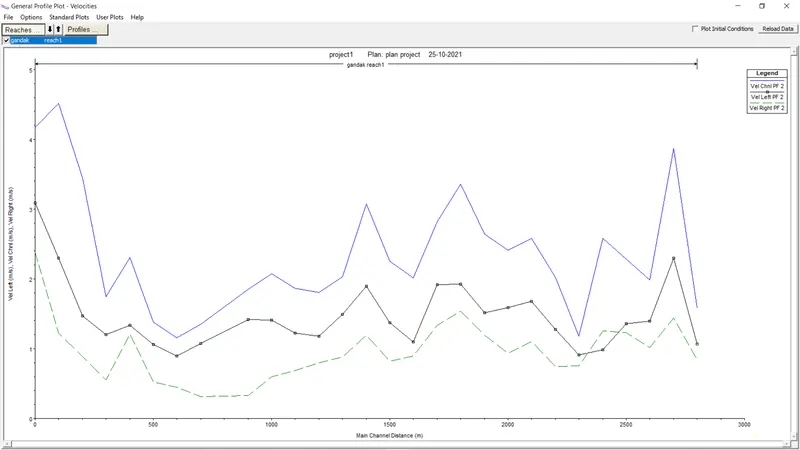
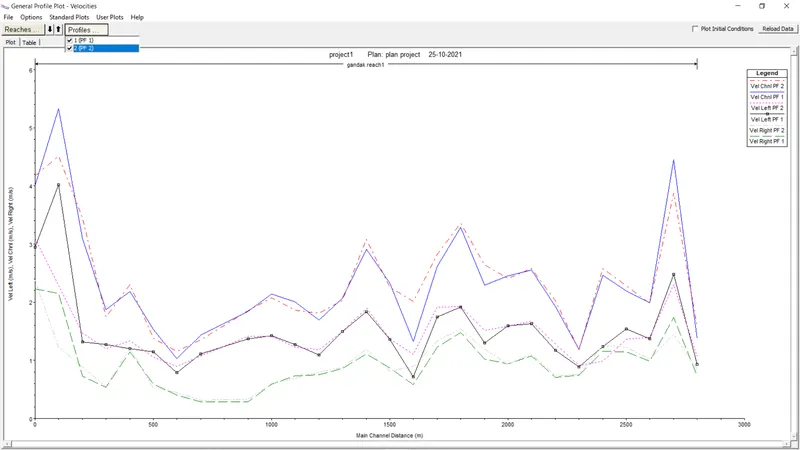
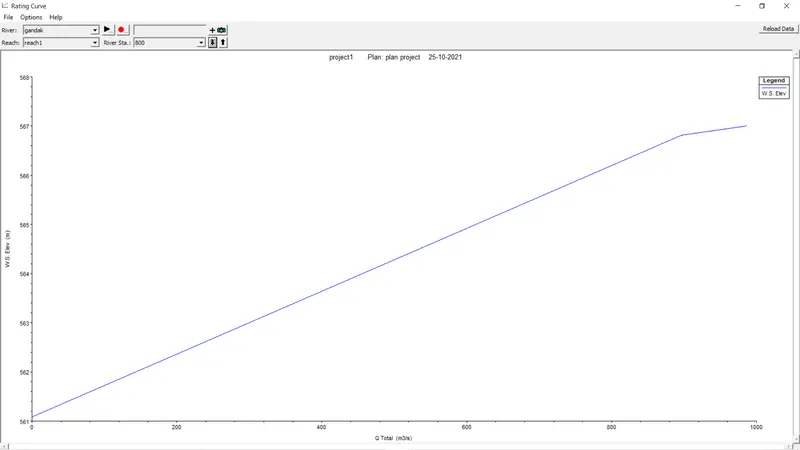
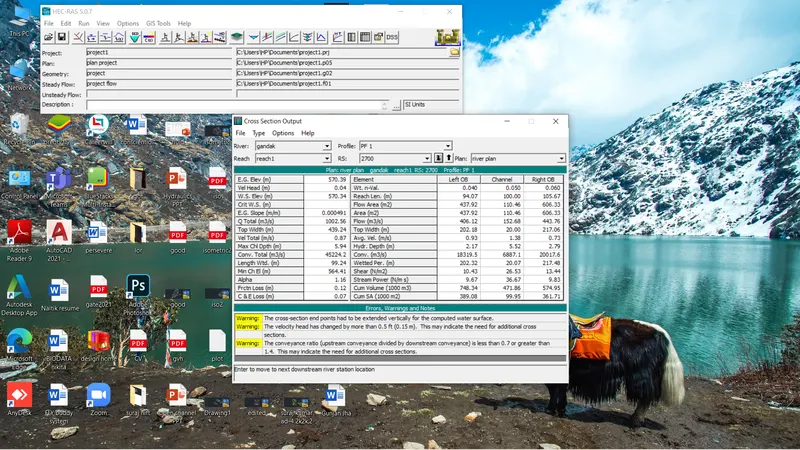
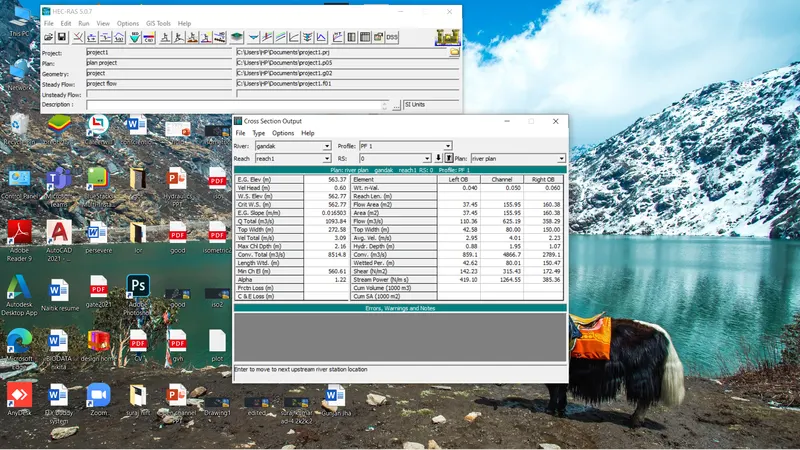
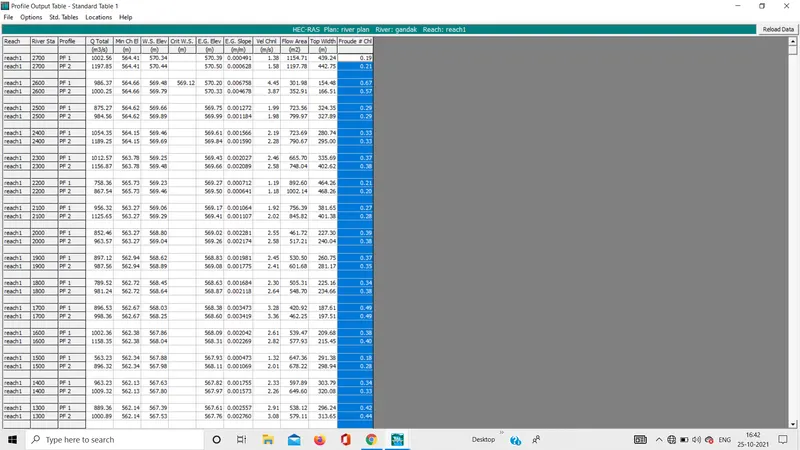
These are the desired outputs from our developed Hydraulic Model.