FLOW OVER BICYCLE USING PYTHON
Objective:To write a python program to calculate the drag force which act on cyclist.
Problem statement:Every bicyclist has to overcome wind resistance and drag force so it is important for a bicyclist to know that how he can experiences least drag force.It is necessary to analyse the drag force acting on bicyclist at different velocities and at different body positions.As calculating the drag force and representing graphs at different drag coefficients is time consuming.To make it easier and to save the time it should be programmed in such a way that we can get the desired output and graphs within no time.
Solution Procedure:
Drag Force:
Drag is a frictional force caused by the turbulence of displacing air that is pushed out of the way as you pass through it.A drag force is the resistance force caused by the motion of a body through a fluid, such as water or air. A drag force acts opposite to the direction of the oncoming flow velocity. This is the relative velocity between the body and the fluid.Studies show that around one third of drag is caused by the bike, and two thirds by the rider.


 |
= | drag |
 |
= | density of fluid |
 |
= | speed of the object relative to the fluid |
 |
= | drag coefficient |
 |
= | cross sectional area |
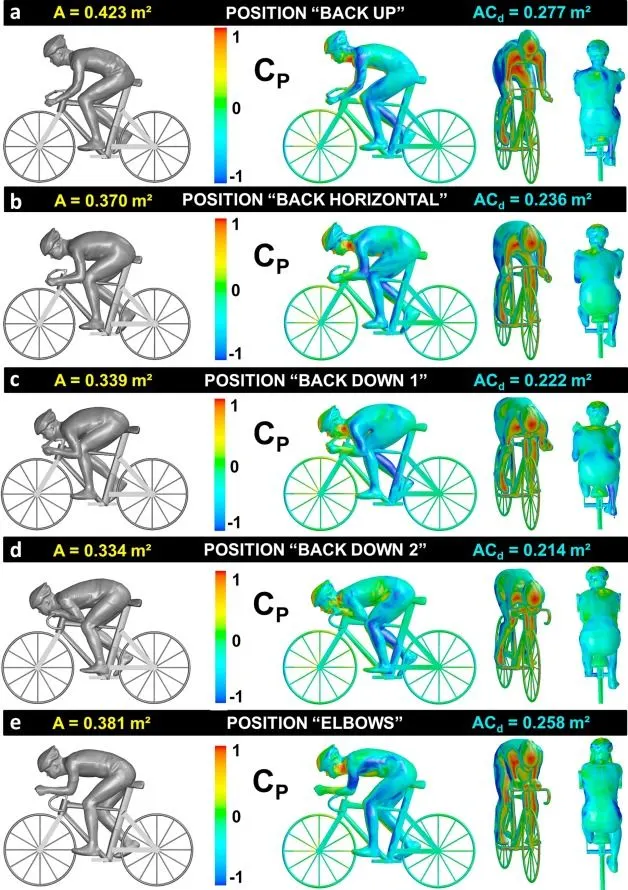
Different positions for experiencing least drag force:
Steps/Procedure:
a)FOR PLOTTING VELOCITY v/s DRAG FORCE
1.Import the required libraries i.e..matplotlib.pyplot and math
2.Define the function by assigning the variables for density,frontal area,velocity and drag coefficient.
3.Then primary for loop is initiated to take the drag coefficient values.
4.Empty array is created for calculating the drag force.
5.Then secondary for loop is initiated to take the velocities.
6.The drag force values are calculated for different velocities and drag coefficients.
7.The values of drag forces are appended in an empty array created previously.
8.Graphs are plotted between velocity and drag coefficient.
9.At last the function is called or the values for different parameters are defined.
Frontal Area(A)=0.2(m^2)
Density(rho)=1.2(kg/m^3)
Bicycle velocities(v)=[1,3,5,7,9,11,13,15,17,19,21,23,25,27,29,31,33,35,37](m/s)
Drag coefficients(c_d)=[0.38,0.42,0.47,0.50,0.59,0.80,1.05,1.17,1.16,1.20,1.38,1.42,1.55,1.60,1.98,2.0,2.05,2.20,2.30]
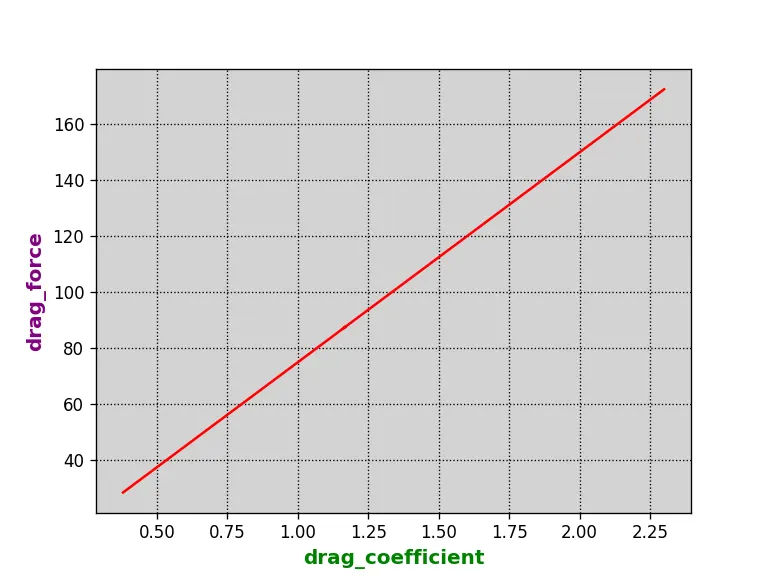
b)FOR PLOTTING DRAG FORCE v/s DRAG COEFFICIENT
1.Matplotlib.pyplot library is imported.
2.Values are assigned for the different parameters like density,frontal area,bicycle velocity and drag coefficient.
3.For loop is initiated to calculate drag forces.
4.Drag force values are appended and stored in an empty array.
5.Graphs are plotted between drag force and drag coefficient.
Frontal area(A)=0.2(m^2)
Density(rho)=1.2(kg/m^3)
Bicycle velocity(v)=25(m/s)
drag coefficients(c_d)=[0.38,0.42,0.47,0.50,0.59,0.80,1.05,1.17,1.16,1.20,1.38,1.42,1.55,1.60,1.98,2.0,2.05,2.20,2.30]
Program:
#importing the required libraries
import matplotlib.pyplot as plt
import math
import numpy as np
from matplotlib.backends.backend_pdf import PdfPages
pp = PdfPages('multipage.pdf')


#function defination
def test(rho,v,A,c_d): #rho=density,v=velocity,A=area,c_d=drag coefficient

	for i in c_d:
		print(i)
		f_d = []    #f_d=drag force
		for j in v:
			f_d.append(0.5*rho*A*i*j*j)
		print(f_d)
		#plotting the graphs
		plt.figure(1,dpi=120)
		ax=plt.axes()
		ax.set_facecolor('lightgrey')
		plt.plot(v,f_d,color='red',linestyle='-')
		#labelling the x axis and y axis
		plt.xlabel('velocity',color='green',fontsize='large',fontweight='bold')
		plt.ylabel('drag_force',color='purple',fontsize='large',fontweight='bold')
		#giving title to the graph
		plt.title("the drag coefficient is {}".format(i),color='black',fontsize='x-large',fontweight='bold')
		#making the grids visible
		plt.grid(True,color='black',linestyle='dotted')
		#saving the image of graph
		plt.savefig(pp,format='pdf')
		pp.savefig()
		#showing the graphs
		plt.show()
	v = 25
	f_d = []
	for p in c_d:
		f_d.append(0.5*rho*A*p*v*v)
	print(f_d)
	#plotting the graphs between drag coefficient and drag force
	plt.figure(1,dpi=120)
	ax=plt.axes()
	ax.set_facecolor('lightgrey')
	plt.plot(c_d,f_d,color='red')
	#labelling the x axis and y axis
	plt.xlabel('drag_coefficient',color='green',fontsize='large',fontweight='bold')
	plt.ylabel('drag_force',color='purple',fontsize='large',fontweight='bold')
	#making the grids visible
	plt.grid(True,color='black',linestyle='dotted')
	plt.savefig(pp,format='pdf')
	pp.savefig()
	plt.show()


#function call
test(1.2,[1,3,5,7,9,11,13,15,17,19,21,23,25,27,29,31,33,35,37],0.2,[0.38,0.42,0.47,0.50,0.59,0.80,1.05,1.17,1.16,1.20,1.38,1.42,1.55,1.60,1.98,2.0,2.05,2.20,2.30])
Output:
a)
0.38
[0.0456, 0.4104, 1.1400000000000001, 2.2344000000000004, 3.6936, 5.517600000000001, 7.7064, 10.260000000000002, 13.1784, 16.4616, 20.1096, 24.1224, 28.500000000000004, 33.2424, 38.3496, 43.8216, 49.65840000000001, 55.86, 62.4264]
0.42
[0.05039999999999999, 0.4535999999999999, 1.2599999999999998, 2.4696, 4.0824, 6.098399999999999, 8.517599999999998, 11.339999999999998, 14.565599999999998, 18.194399999999998, 22.226399999999995, 26.661599999999996, 31.499999999999993, 36.74159999999999, 42.386399999999995, 48.4344, 54.8856, 61.739999999999995, 68.99759999999999]
0.47
[0.05639999999999999, 0.5075999999999998, 1.41, 2.7635999999999994, 4.5684, 6.8244, 9.531599999999997, 12.689999999999998, 16.299599999999998, 20.3604, 24.8724, 29.8356, 35.24999999999999, 41.11559999999999, 47.432399999999994, 54.200399999999995, 61.41959999999999, 69.08999999999999, 77.21159999999999]
0.5
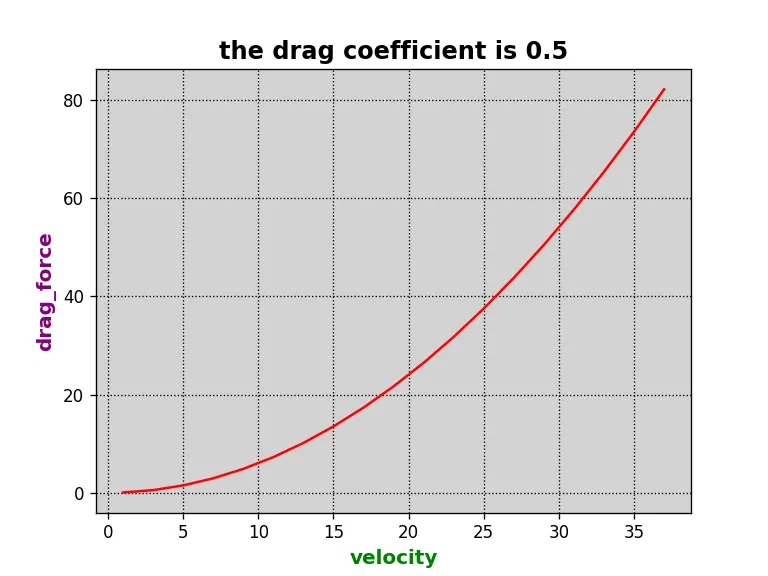
[0.06, 0.54, 1.5, 2.94, 4.86, 7.259999999999999, 10.14, 13.499999999999998, 17.34, 21.659999999999997, 26.46, 31.74, 37.5, 43.739999999999995, 50.46, 57.66, 65.34, 73.5, 82.13999999999999]
0.59
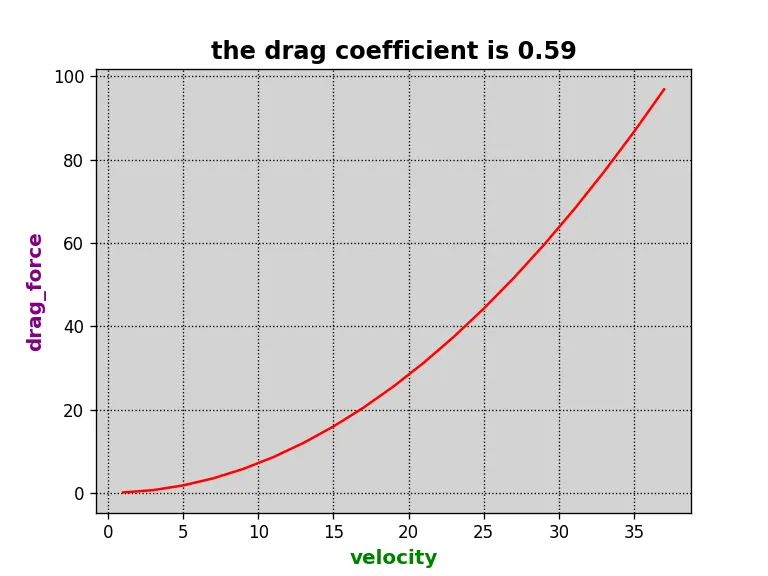
[0.07079999999999999, 0.6372, 1.7699999999999996, 3.4691999999999994, 5.734799999999999, 8.566799999999999, 11.9652, 15.929999999999998, 20.461199999999998, 25.558799999999994, 31.222799999999992, 37.45319999999999, 44.24999999999999, 51.61319999999999, 59.542799999999986, 68.03879999999998, 77.10119999999999, 86.72999999999999, 96.92519999999999]
0.8
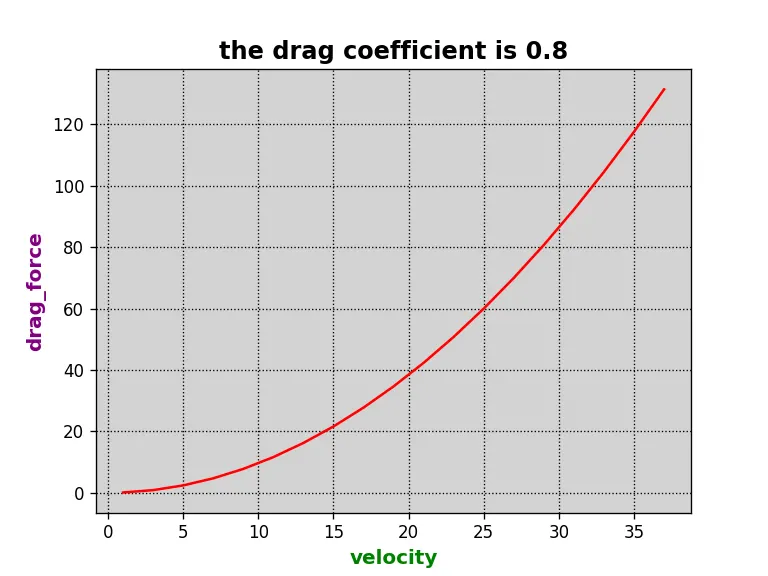
[0.096, 0.8640000000000001, 2.4, 4.704000000000001, 7.776, 11.616, 16.224, 21.599999999999998, 27.744000000000003, 34.656, 42.336, 50.784000000000006, 60.0, 69.98400000000001, 80.736, 92.256, 104.54400000000001, 117.6, 131.424]
1.05
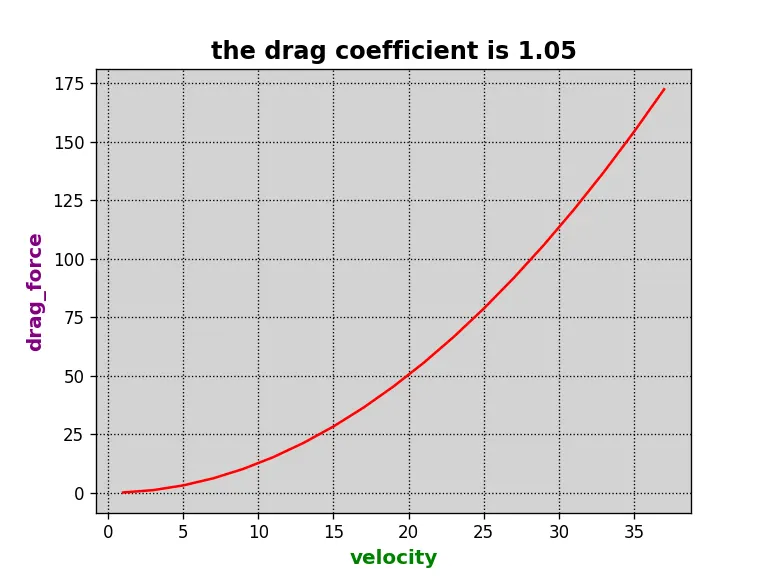
[0.126, 1.134, 3.15, 6.174, 10.206, 15.246000000000002, 21.293999999999997, 28.35, 36.414, 45.486000000000004, 55.565999999999995, 66.654, 78.75, 91.854, 105.966, 121.086, 137.214, 154.35, 172.494]
1.17
[0.1404, 1.2636, 3.51, 6.8796, 11.3724, 16.9884, 23.7276, 31.589999999999996, 40.5756, 50.6844, 61.916399999999996, 74.2716, 87.75, 102.3516, 118.0764, 134.92440000000002, 152.89559999999997, 171.98999999999998, 192.20759999999999]
1.16
[0.1392, 1.2528, 3.4799999999999995, 6.820799999999999, 11.2752, 16.8432, 23.5248, 31.32, 40.22879999999999, 50.2512, 61.38719999999999, 73.6368, 86.99999999999999, 101.4768, 117.06719999999999, 133.7712, 151.5888, 170.51999999999998, 190.5648]
1.2
[0.144, 1.2959999999999998, 3.5999999999999996, 7.056, 11.663999999999998, 17.424, 24.336, 32.4, 41.616, 51.983999999999995, 63.50399999999999, 76.176, 89.99999999999999, 104.976, 121.10399999999998, 138.384, 156.816, 176.4, 197.13599999999997]
1.38
[0.16559999999999997, 1.4903999999999997, 4.139999999999999, 8.114399999999998, 13.413599999999997, 20.037599999999998, 27.986399999999996, 37.25999999999999, 47.85839999999999, 59.78159999999999, 73.02959999999999, 87.60239999999999, 103.49999999999997, 120.7224, 139.26959999999997, 159.14159999999998, 180.33839999999995, 202.85999999999999, 226.70639999999995]
1.42
[0.1704, 1.5335999999999999, 4.26, 8.3496, 13.802399999999999, 20.6184, 28.7976, 38.34, 49.245599999999996, 61.5144, 75.1464, 90.1416, 106.5, 124.2216, 143.3064, 163.7544, 185.5656, 208.73999999999998, 233.2776]
1.55
[0.186, 1.6740000000000002, 4.6499999999999995, 9.114, 15.065999999999999, 22.505999999999997, 31.434, 41.85, 53.754, 67.146, 82.026, 98.39399999999999, 116.25000000000001, 135.594, 156.42600000000002, 178.746, 202.554, 227.85, 254.634]
1.6
[0.192, 1.7280000000000002, 4.8, 9.408000000000001, 15.552, 23.232, 32.448, 43.199999999999996, 55.48800000000001, 69.312, 84.672, 101.56800000000001, 120.0, 139.96800000000002, 161.472, 184.512, 209.08800000000002, 235.2, 262.848]
1.98
[0.23759999999999998, 2.1384, 5.9399999999999995, 11.642399999999999, 19.2456, 28.7496, 40.154399999999995, 53.459999999999994, 68.66639999999998, 85.77359999999999, 104.78159999999998, 125.69039999999998, 148.5, 173.2104, 199.8216, 228.3336, 258.74639999999994, 291.05999999999995, 325.2744]
2.0
[0.24, 2.16, 6.0, 11.76, 19.44, 29.039999999999996, 40.56, 53.99999999999999, 69.36, 86.63999999999999, 105.84, 126.96, 150.0, 174.95999999999998, 201.84, 230.64, 261.36, 294.0, 328.55999999999995]
2.05
[0.24599999999999997, 2.2139999999999995, 6.149999999999999, 12.053999999999998, 19.925999999999995, 29.765999999999995, 41.57399999999999, 55.349999999999994, 71.094, 88.80599999999998, 108.48599999999999, 130.134, 153.75, 179.33399999999997, 206.886, 236.40599999999998, 267.89399999999995, 301.34999999999997, 336.77399999999994]
2.2
[0.264, 2.3760000000000003, 6.6000000000000005, 12.936, 21.384000000000004, 31.944, 44.61600000000001, 59.4, 76.296, 95.304, 116.424, 139.656, 165.0, 192.45600000000002, 222.02400000000003, 253.70400000000004, 287.496, 323.40000000000003, 361.41600000000005]
2.3
[0.27599999999999997, 2.4839999999999995, 6.8999999999999995, 13.523999999999997, 22.355999999999995, 33.395999999999994, 46.644, 62.099999999999994, 79.76399999999998, 99.636, 121.71599999999998, 146.00399999999996, 172.5, 201.20399999999998, 232.11599999999999, 265.236, 300.56399999999996, 338.09999999999997, 377.84399999999994]
b)
[28.500000000000004, 31.499999999999993, 35.24999999999999, 37.5, 44.24999999999999, 60.0, 78.75, 87.75, 86.99999999999999, 89.99999999999999, 103.49999999999997, 106.5, 116.25000000000001, 120.0, 148.5, 150.0, 153.75, 165.0, 172.5]
[Finished in 36.9s]
Graphs:
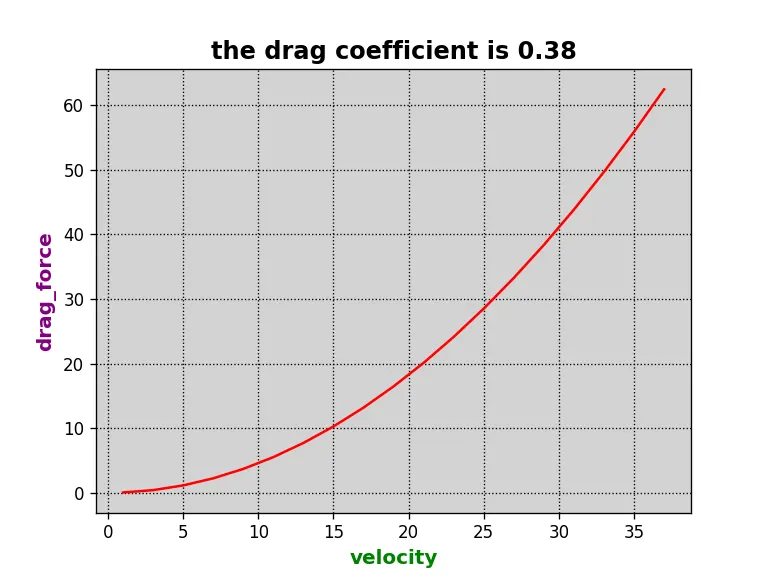
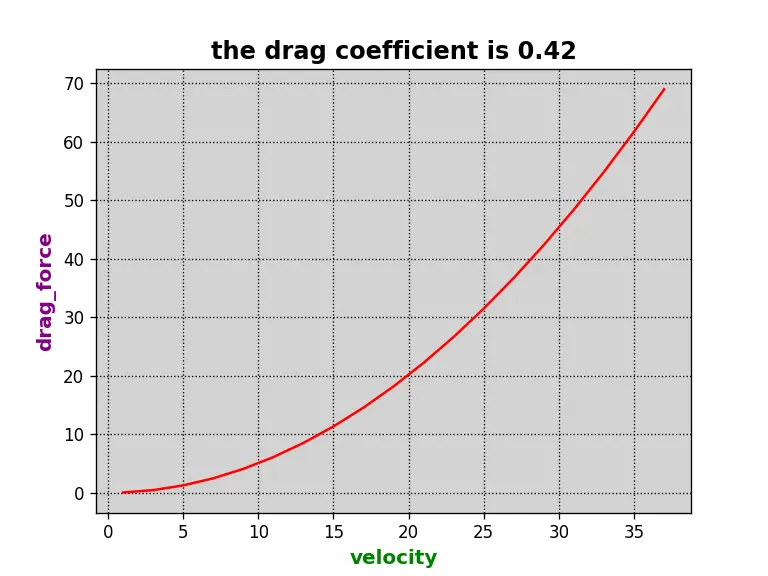
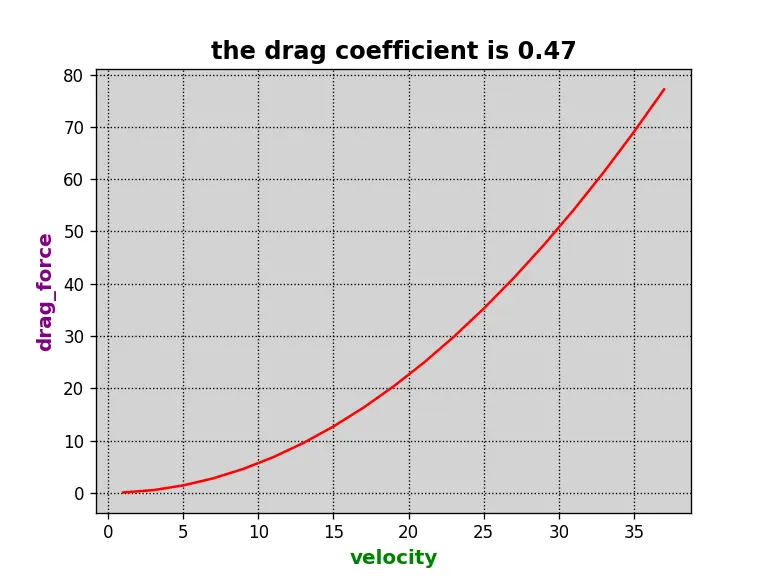
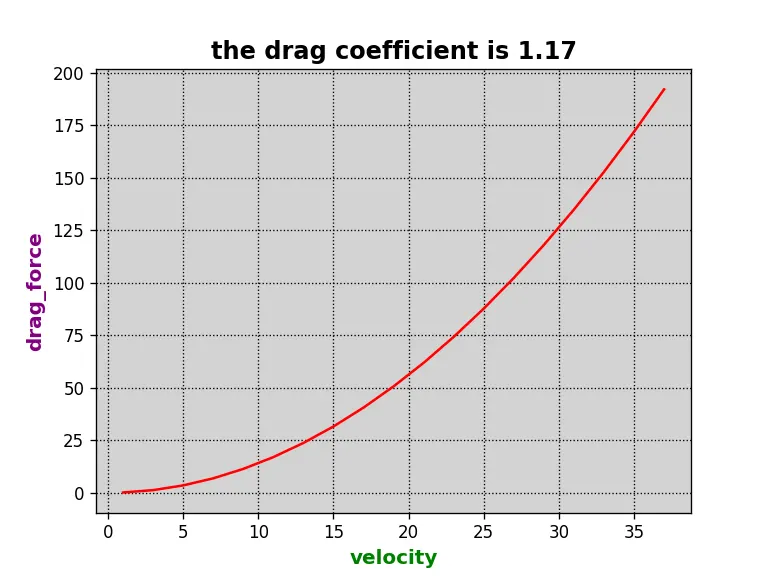
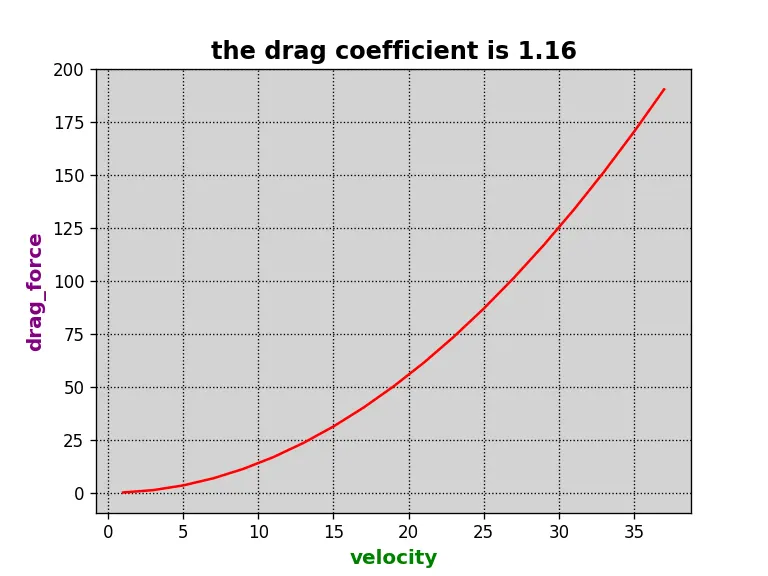
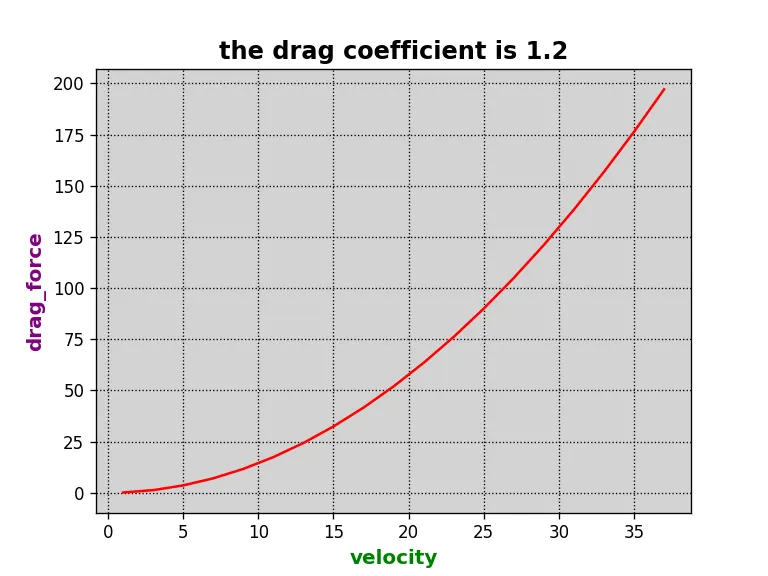
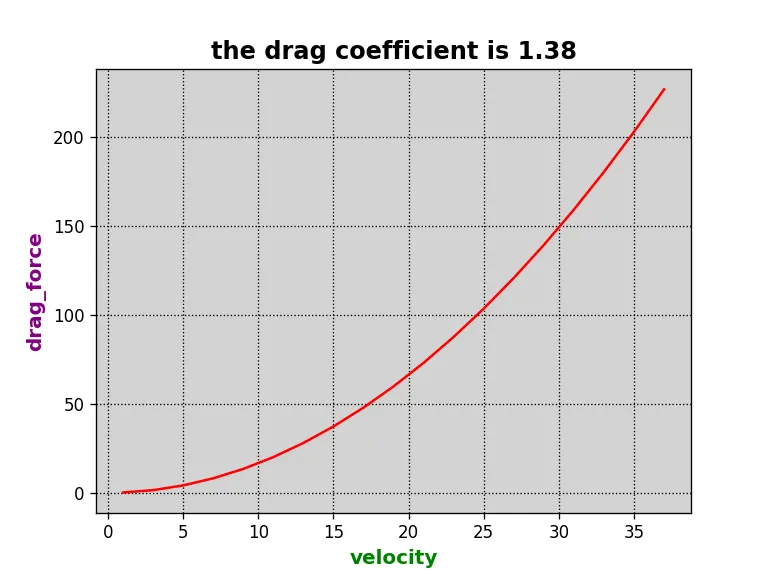
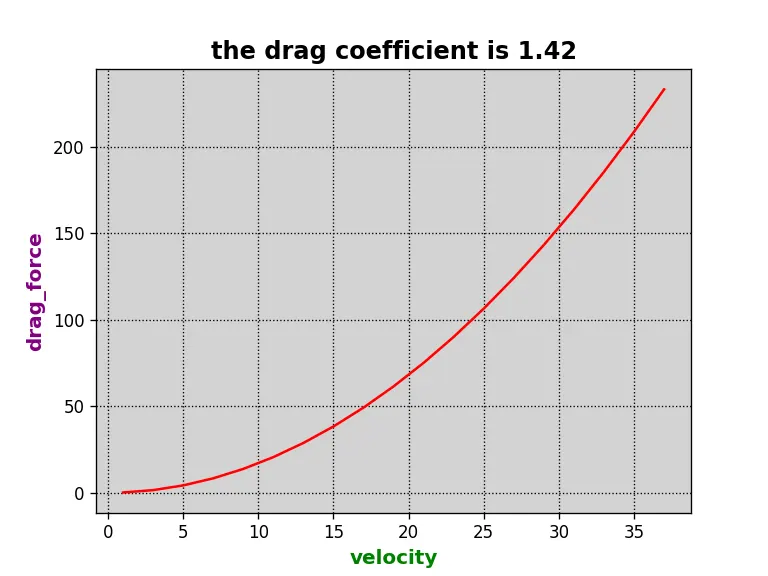
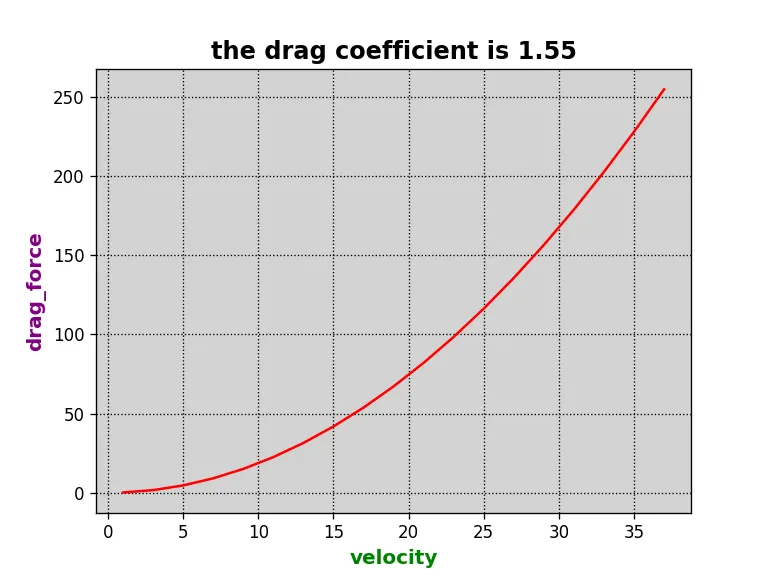
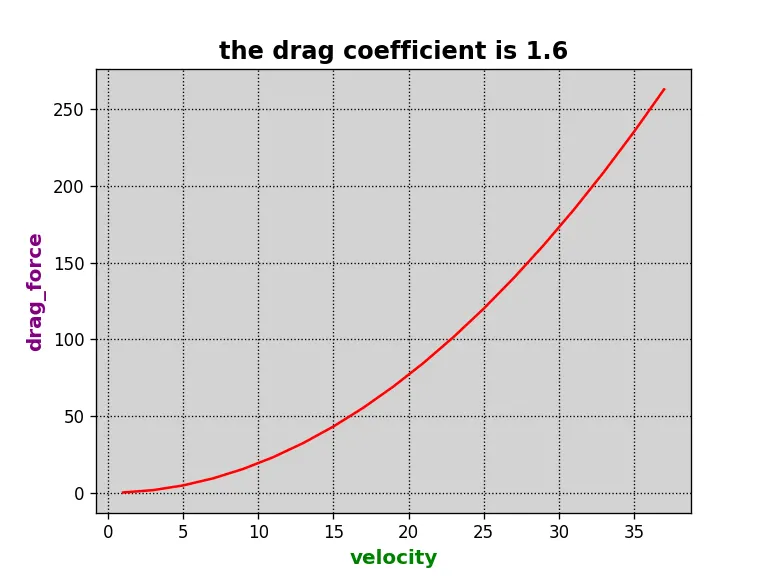
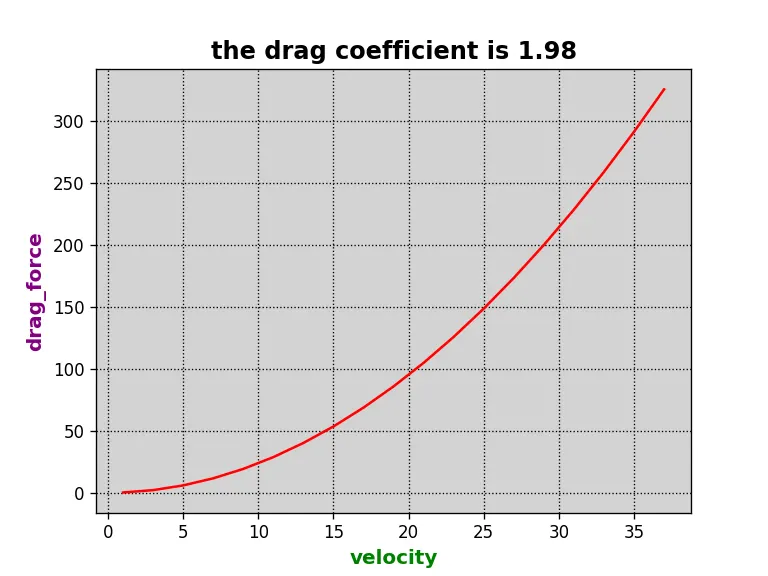
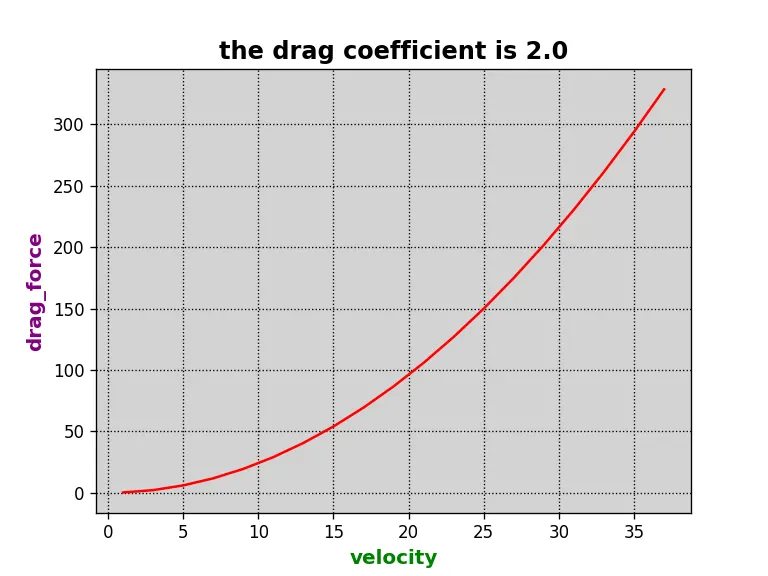
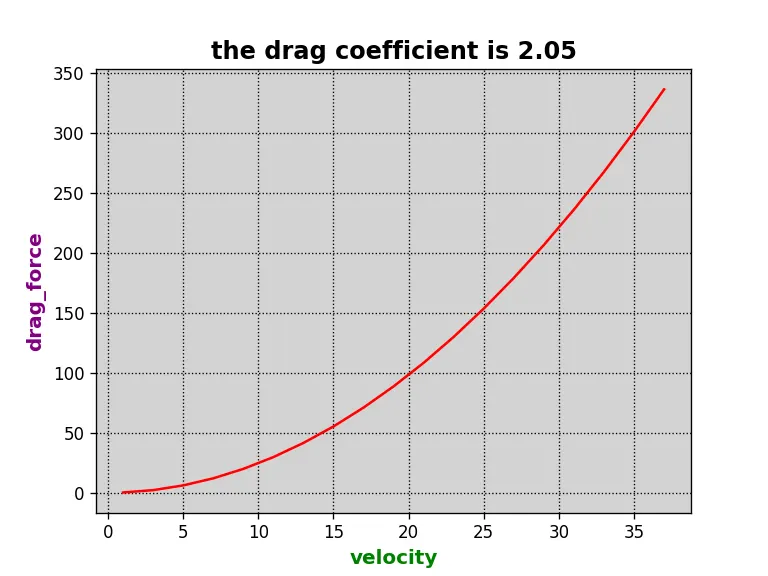
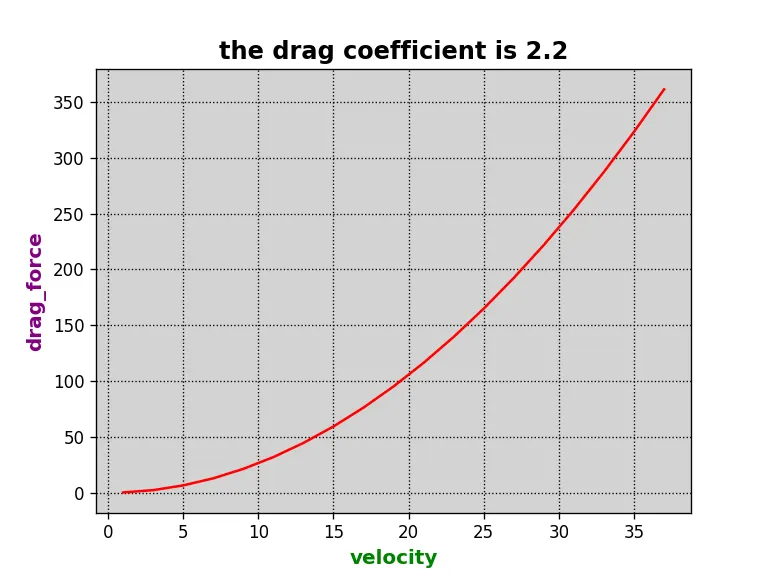
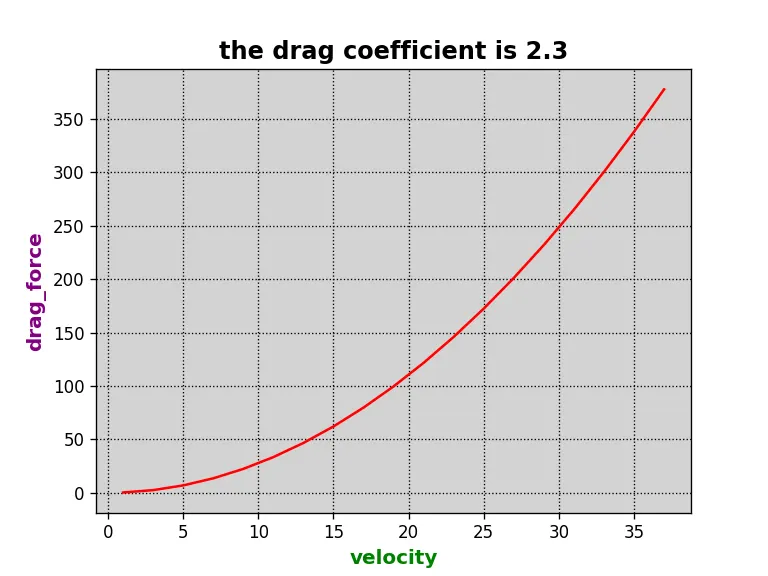
Result/Conclusion:
The graph plots have been obtained using python program