Design and Modelling of a Fuel Cell Hybrid Electric Vehicle (3 propulsion sources)
OBJECTIVES:
- Design, model, and simulate an entire Fuel Cell Hybrid Electric Vehicle powered by a Fuel Cell, Battery, and Ultracapacitor
INTRODUCTION:
Why are FCHEVs on the rise?
The two biggest problems with BEVs are driving range and charging time. FCHEVs are similar to ICE cars when their driving range and charging time are considered, which is why they are emerging as a great option, especially in heavy-duty, long range vehicles like trucks and buses. For these kind of large vehicles, it would take an incredible amount of electricity, tons of batteries with absurd charging times if they were a BEV. Using hydrogen for larger weight, greater range, and greater speed makes sense because of hydrogen's energy density. Adding more fuel to improve performance parameters is possible with hydrogen because the weight of the vehicle doesn't increase by much. Batteries on the other hand have a limit, where the weight of the extra added batteries offsets any improved performance due to Li-ion batteries' energy density.
Tesla superchargers (currently the best chargers available) will charge a non-heavy duty BEV for 200 miles in less than 15 minutes, whereas FCHEVs can be charged for 400 miles in less than 5 minutes through any hydrogen charging station. However though, at this point BEVs are far more efficient than FCEVs. A full well-to-wheel analysis for both options will output an efficiency of 70-90% for the BEV, whereas it is only 25-35% for the FCHEV. That 3x difference will be lessened overtime but because of how hydrogen is currently produced, compressed, stored, and used won't improve that 25-35% number by too much. Efficiency with FCHEVs are certainly a concern, along with their infrastructure, which is not developed compared to BEV charging stations.
Longer range, lesser charging time are what give the nod for the development of FCHEVs, and if their infrastructure development makes it convenient to own a FCHEV, it can certainly act as an alternative alongside BEVs, especially for larger vehicles.
FCHEVs with two propulsion sources, namely fuel cell and battery, exist in the form of a few popular vehicles today. Honda Clarity, Hyundai Nexo, and probably the most popular one yet, the Toyota Mirai 2021. The way these two sources work in tandem in most vehicles is this:
- FC operates in the low & medium power demand region
- Battery, being the secondary energy storage system, covers the high power demand region.
However, this is not ideal for either of these sources. A FC operates best in the mid-power demand region, while the battery's optimal operation happens in the low power demand region. Operating both these sources outside their best performing regions leads to more fuel consumption, higher charge/discharge current, faster degradation of both FC and battery, to name a few drawbacks.
This is where the idea of a third propulsion source comes in - to reduce the load on the battery and to also operate the FC in its most efficient region. An ultracapacitor bridges the gap created by a FC's slow dynamics and a battery's limited ability to consistently handle transient surges, making the system much more efficient overall. The addition of this third power source will improve a FCHEV's performance and durability, not just in terms of propulsion, but also in terms of recuperating lost braking energy through regenerative braking.
This model henceforth presents the modelling of a FCHEV with three propulsion sources - Fuel Cell, Battery, and Ultracapacitor (UC). A load-following strategy will be used, keeping in consideration the most efficient points of the respective energy storage system (whether its FC, battery, or UC), and developing an algorithm that uses the propulsion power of all sources as efficiently as possible.
UNDERSTANDING THE ANATOMY OF PROPULSION SOURCES:
| Battery | Fuel Cell | Ultracapacitor |
|
|
|
- Referring to the table above, the goal is to operate all three accordingly to achieve both performance and durability. The power demand cycle used for this project will be the US06 drive cycle which ranges from -80kW to 80kW.
- With FC's highest efficiency from around 30 - 70%, power demand between 23kW - 55kW will hence be powered by the FC
- 55kW - 80kW will be supported by the UC, and 0kW - 23kW will be supported by the battery. Negative power demand will distribute regenerative braking energy to both battery and UC as required.
- This will be the best balance for all three sources. An energy management system is designed considering all of the aforementioned. All propulsion sources will ideally operate in their most efficient regions, unless the SOC of battery and/or UC is insufficient, in which case there will always be a backup source.
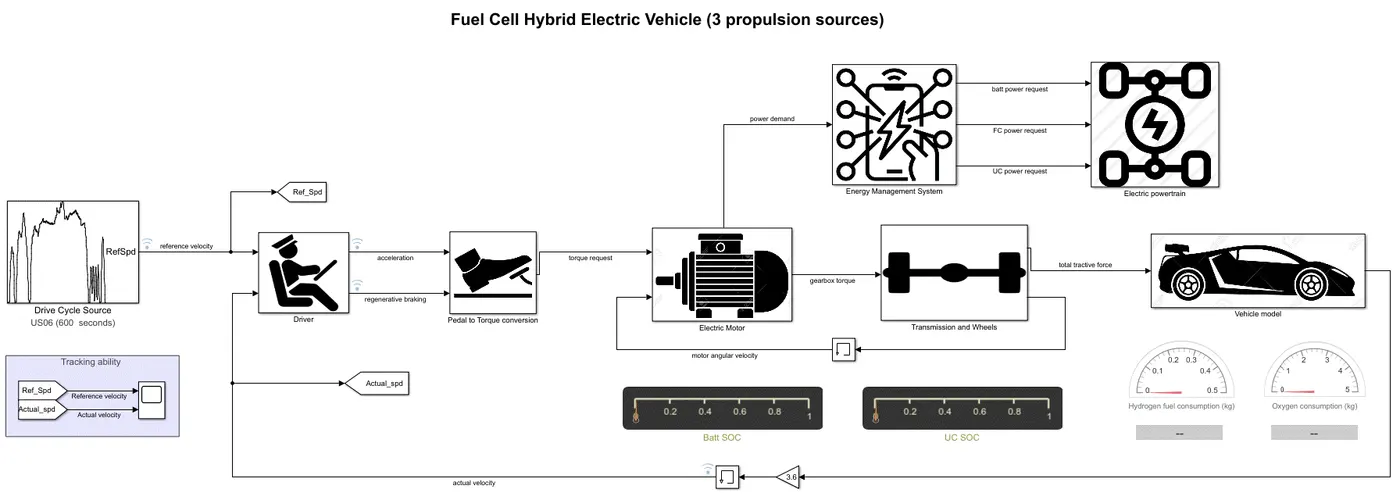
ENTIRE FCHEV MODEL:
DRIVER SUBSYSTEM:
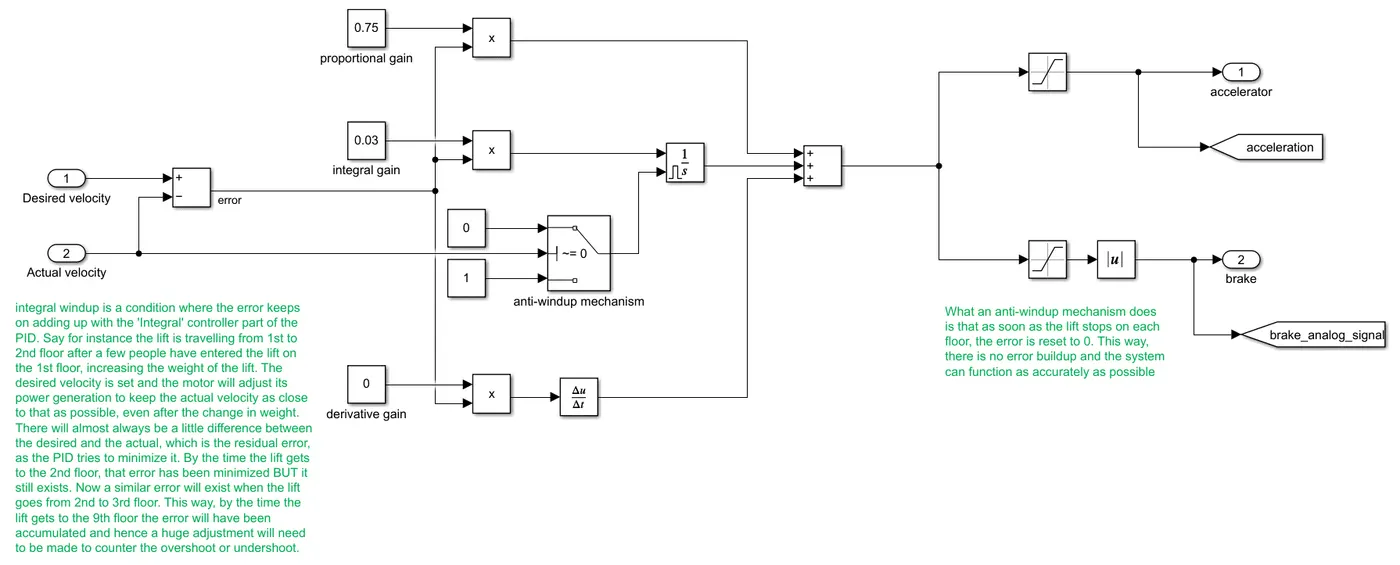
- This subsystem helps to reduce the difference between the desired velocity and the actual velocity produced by the FCHEV through a PID controller.
- If the vehicle is travelling faster than required, a brake command is given by the PID controller. If slower than required, the throttle is pressed.
PEDAL TO TORQUE SUBSYSTEM:
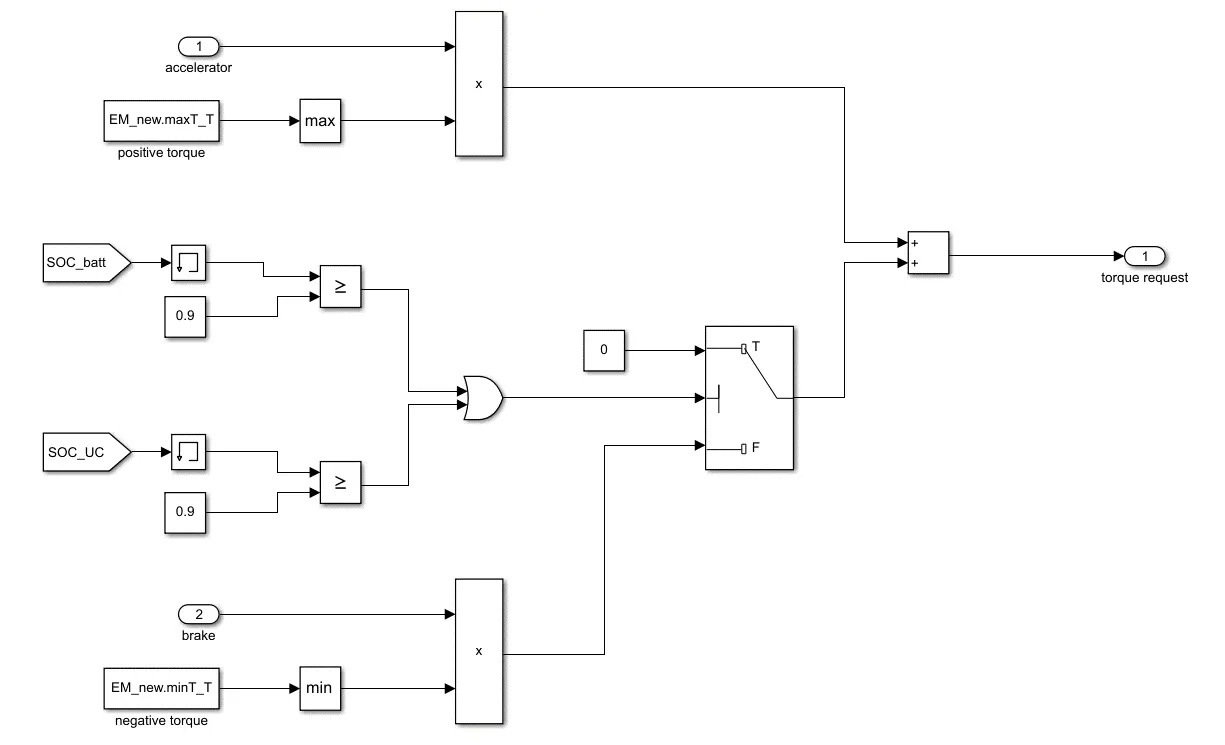
- This is how the accelerator or brake pedal command is converted to a torque request that is given to the electric motor.
- Accelerator or brake values are between 0 and 1, which are then multiplied with the corresponding torque of the motor for an output.
- For instance, the accelerator throttle at 0.9 would indicate it is requesting for 90% of the max torque the motor can provide. The torque values of the motor are accessed and the corresponding value is given.
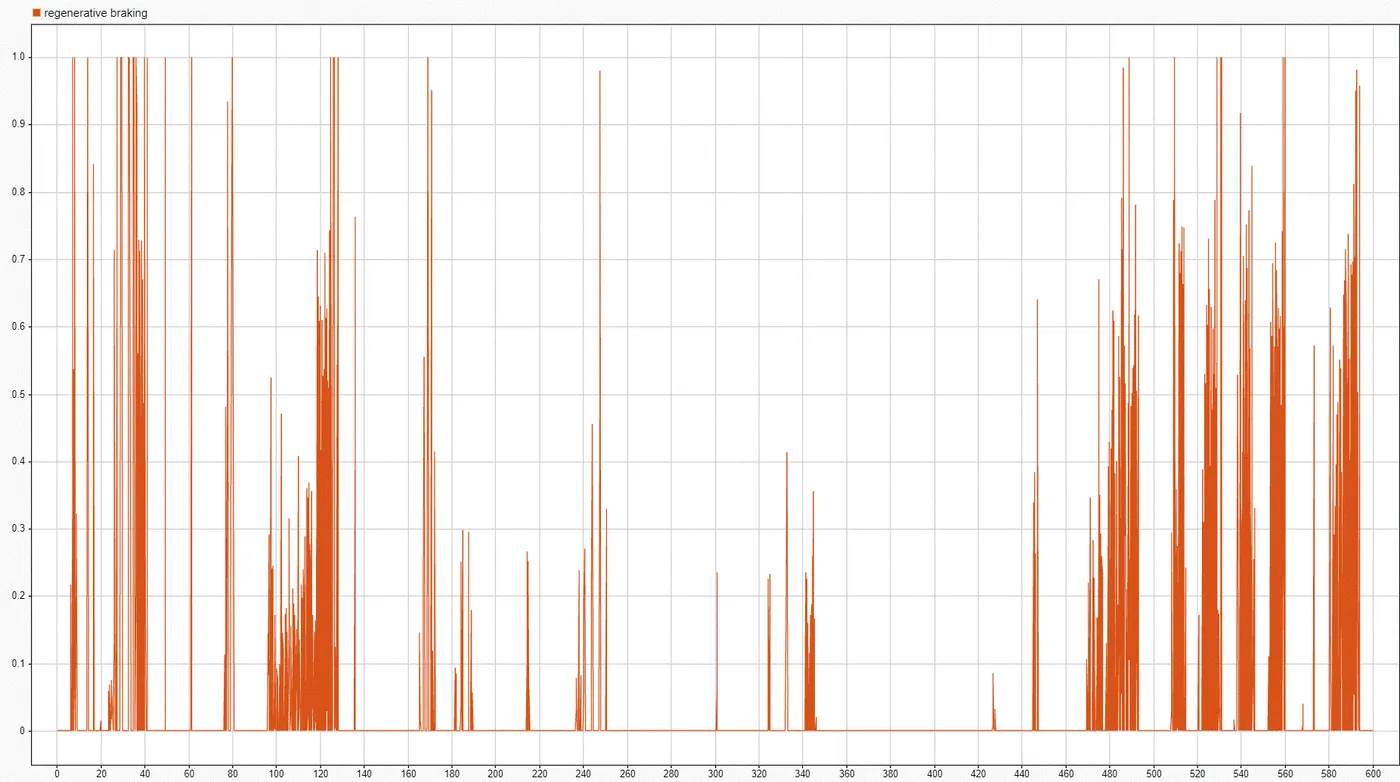
- Although the brakes are pressed when the vehicle is travelling faster than desired speed, a brake torque request is only given when regenerative braking can be used to charge either the UC or the battery. If their SOC is above 90%, then they are not to be charged further and thus no brake torque request is given.
ELECTRIC MOTOR SUBSYSTEM:
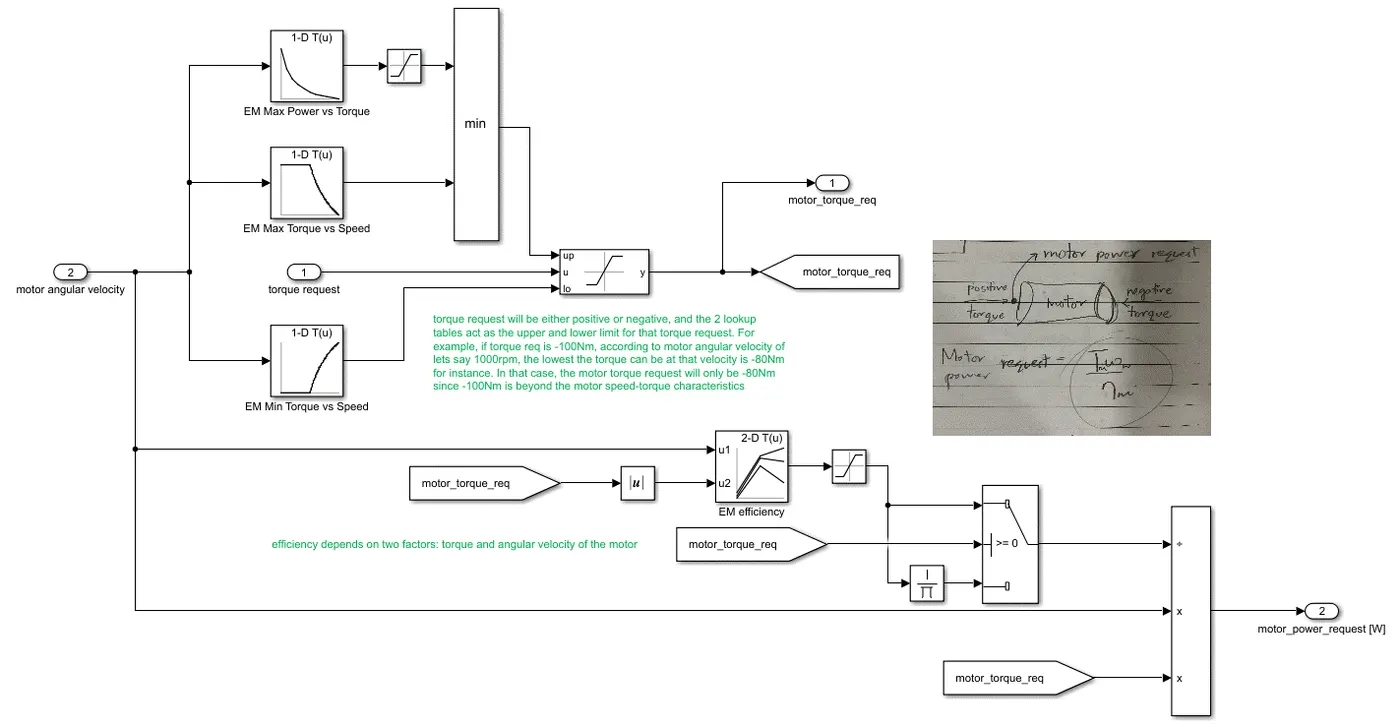
- The torque request is taken from the previous subsystem. How much torque an electric motor is able to generate depends on the speed-torque characteristic of the motor, and the nature of that curve looks like this:
- So, the torque that the motor will provide will be according to the motor's angular velocity. The above diagram's data points are fed into a lookup table, inverted for negative angular velocity and negative torque, and fed in as upper and lower limits.
- For instance, if the torque request for the motor is 100Nm, but according to the motor's angular velocity the max torque the motor can provide is 80Nm, then the output motor torque will be 80Nm as the 100Nm exceeds the capacity of the motor.
- Motor power request: `P_m=(T_m*omega_m)/eta_m`
- Efficiency of the motor depends on both torque and angular velocity of the motor, so a 2-D lookup table is used:
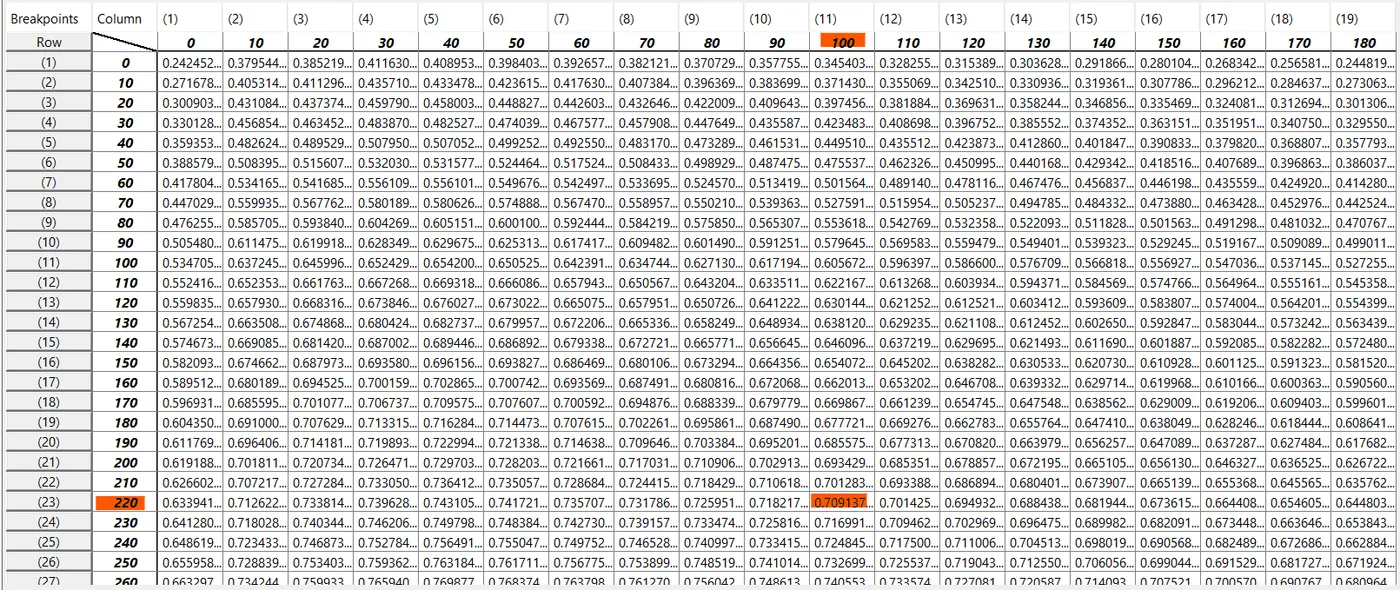
- For instance, a 220rad/sec angular velocity and a 100Nm torque will output a motor efficiency of 70.9137%
ENERGY MANAGEMENT SYSTEM (EMS):
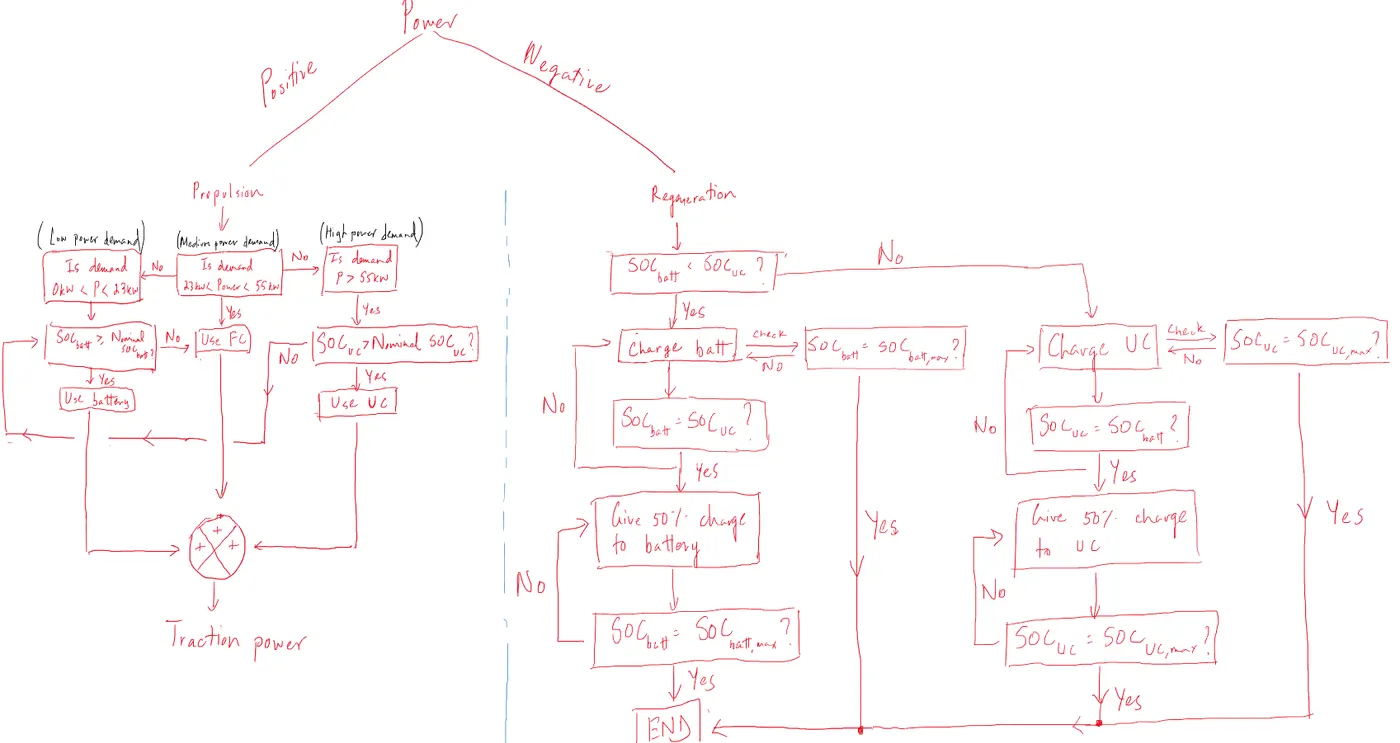
- The electric motor generates a power request that it needs to propel the vehicle forward. The power comes from three sources: which source generates how much power depends on several factors that has been demonstrated in the flowchart above.
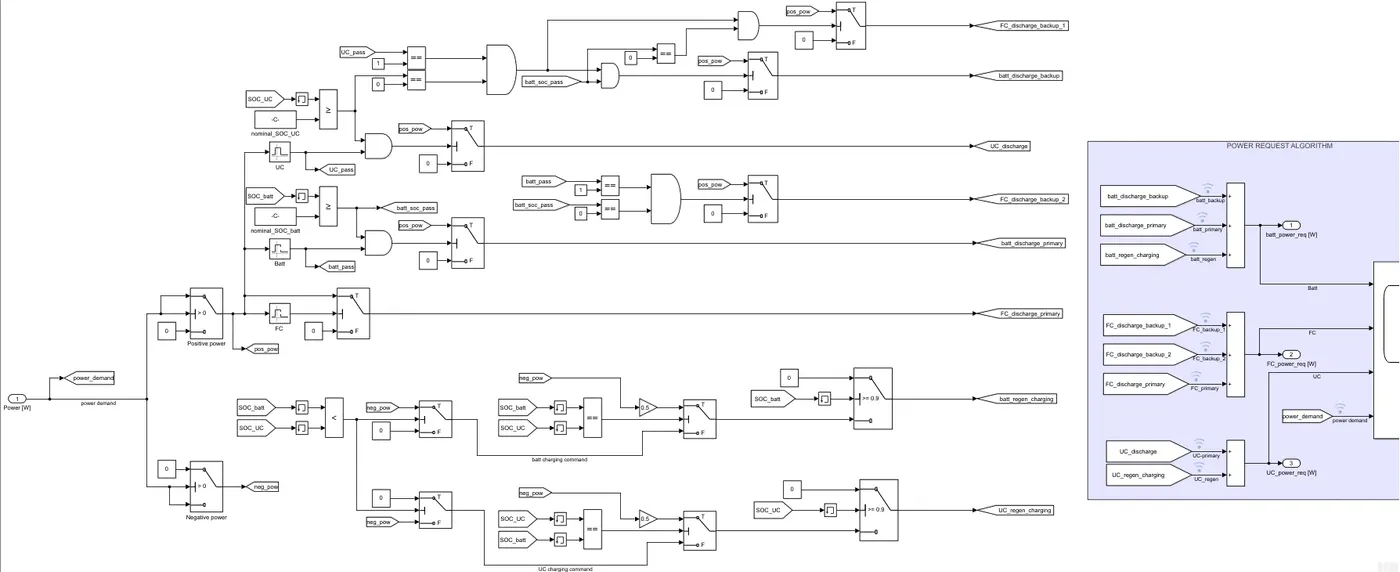
- Every situation is then modelled and mapped out according to this flowchart, to operate all three sources as efficiently as possible for best performance and durability.
HOW THE THREE SOURCES DISTRIBUTE THE POWER DEMAND:
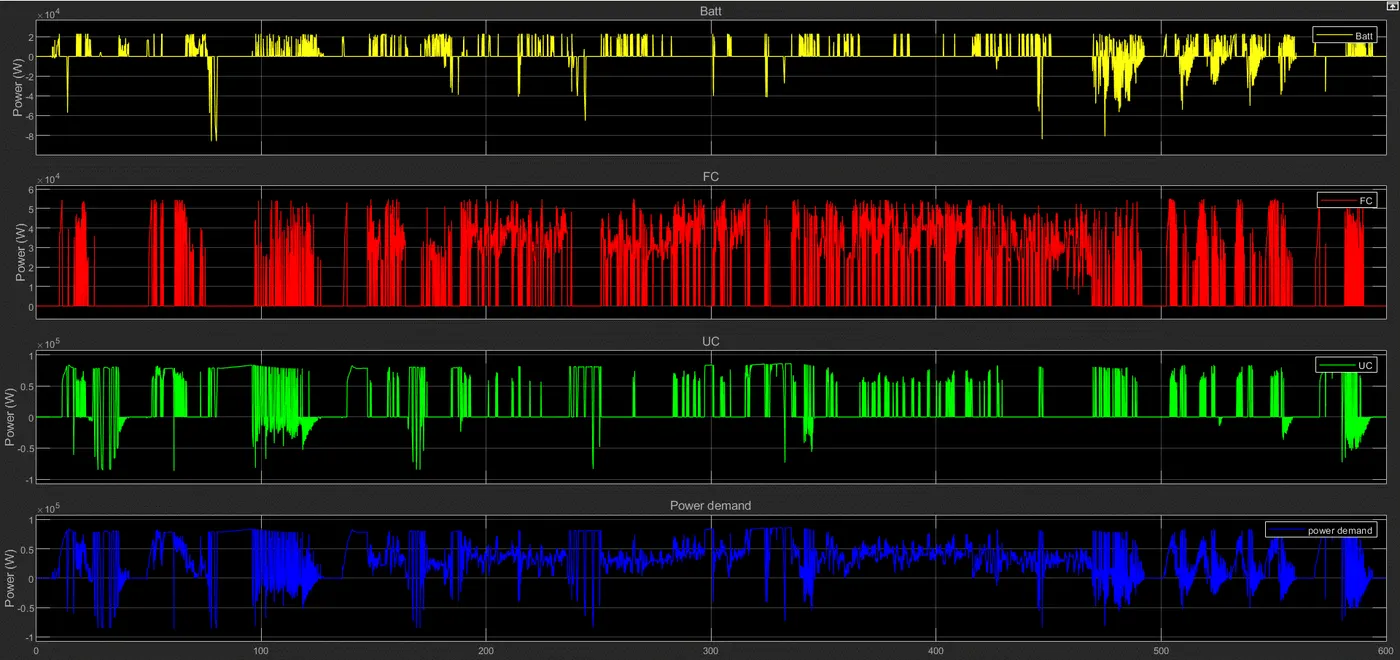
- Power demand is from -80kW - 80kW
- As long as battery's SOC is greater than 40%, it handles the power demand from 0kW - 23kW. If its SOC is below 40%, the FC is the backup source of power.
- FC handles the power demand from 23kW - 55kW
- As long as UC's SOC is greater than 40%, it handles the power demand for 55kW - 80kW (and beyond if needed). If its SOC is below 40%, battery is the backup source of power. If battery's SOC is also below 40%, then FC is the backup source of power.
- For negative power demand, both battery and UC absorb the regenerative braking energy according to their SOC levels. If battery's SOC is lesser than that of UC's, then the battery will absorb the regenerative energy to charge itself up to the same SOC as the UC, and vice versa. Once they are both at the same SOC, the regenerative energy will be distributed equally. Regenerative energy is only wasted as heat when the SOC of both sources is greater than or equal to 90%.
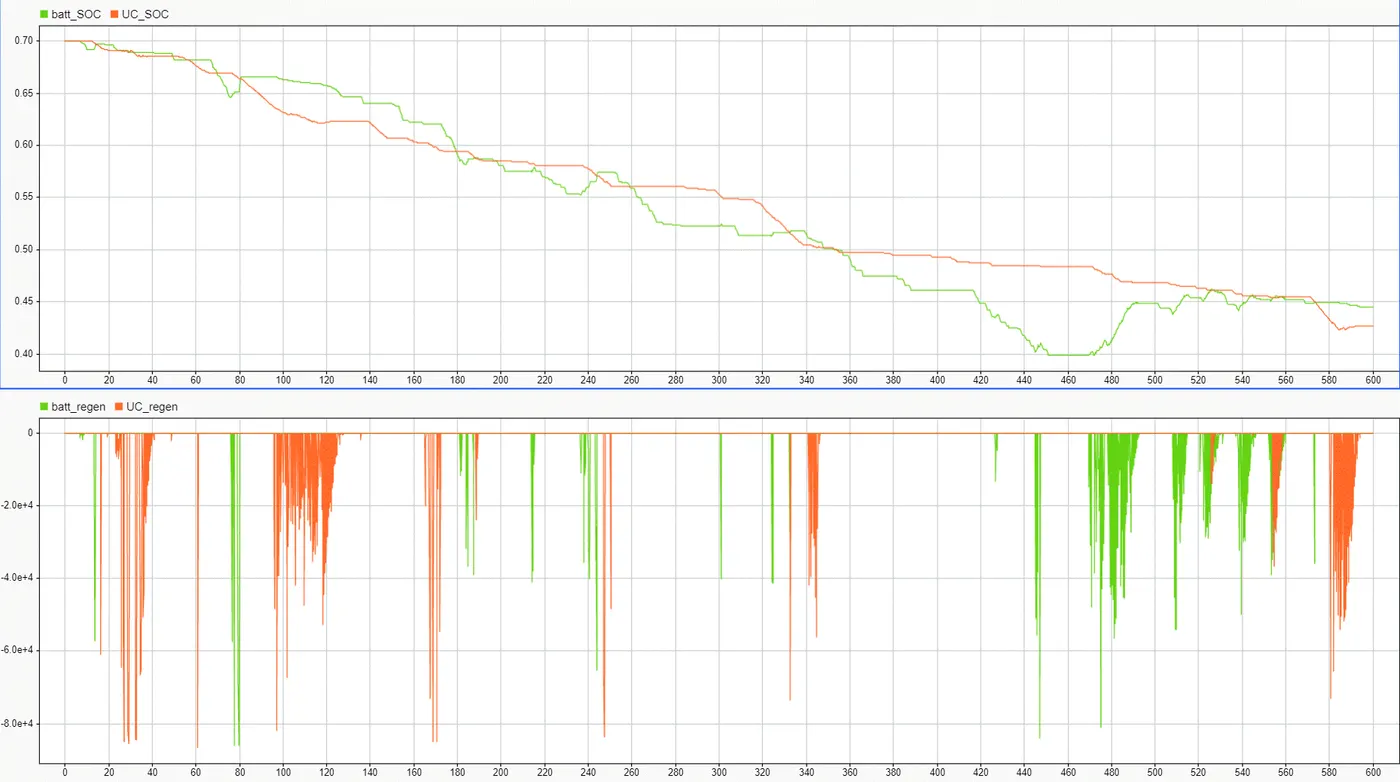
- As is evident in the figure above, when the battery's SOC is lower than that of UC's, regenerative braking energy is used to charge the battery, and vice versa. It is also visible (at 525sec and 555sec) that when the SOC of both are equal they share the absorption of regenerative braking energy.
ELECTRIC POWERTRAIN:
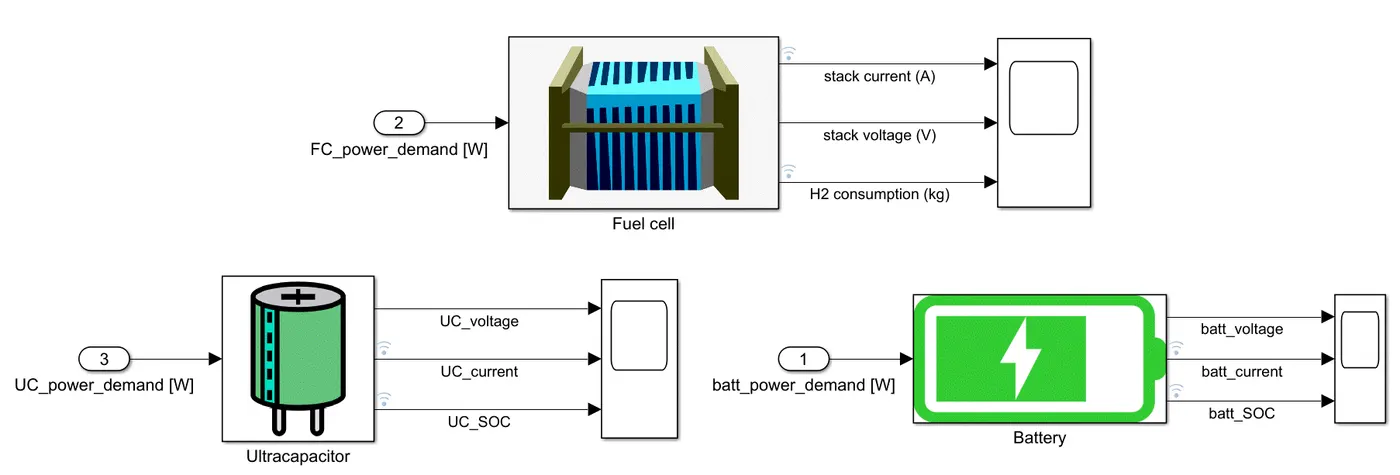
- Once the power demand has been distributed for the three sources by the EMS, a power demand request is sent to all sources so they can meet the criteria to drive the vehicle.
ULTRACAPACITOR SUBSYSTEM:
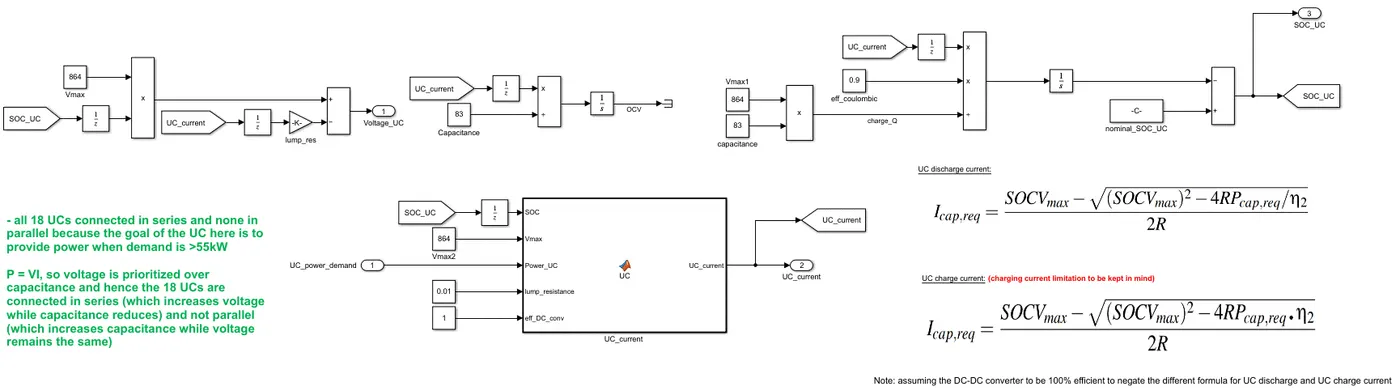
Governing equations that make up an UC:
Voltage `=V_max*SOC-I*R`
Open circuit voltage `=intI/Cdt`
Charge `Q=C*V_(max)`
State of Charge (SOC) `=SOC_(t-1)-int(I*eta)/Qdt`
UC discharge current:
UC charge current: 
BATTERY SUBSYSTEM:
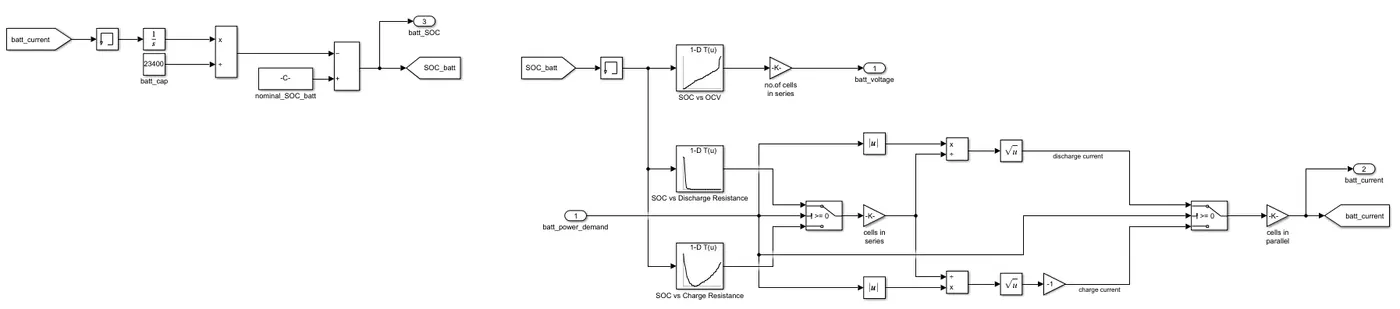
Governing equations that make up a battery:
State of charge `=SOC_(t-1)-intI/Qdt`
Current `I=+-sqrt(P/R)`
FUEL CELL SUBSYSTEM:
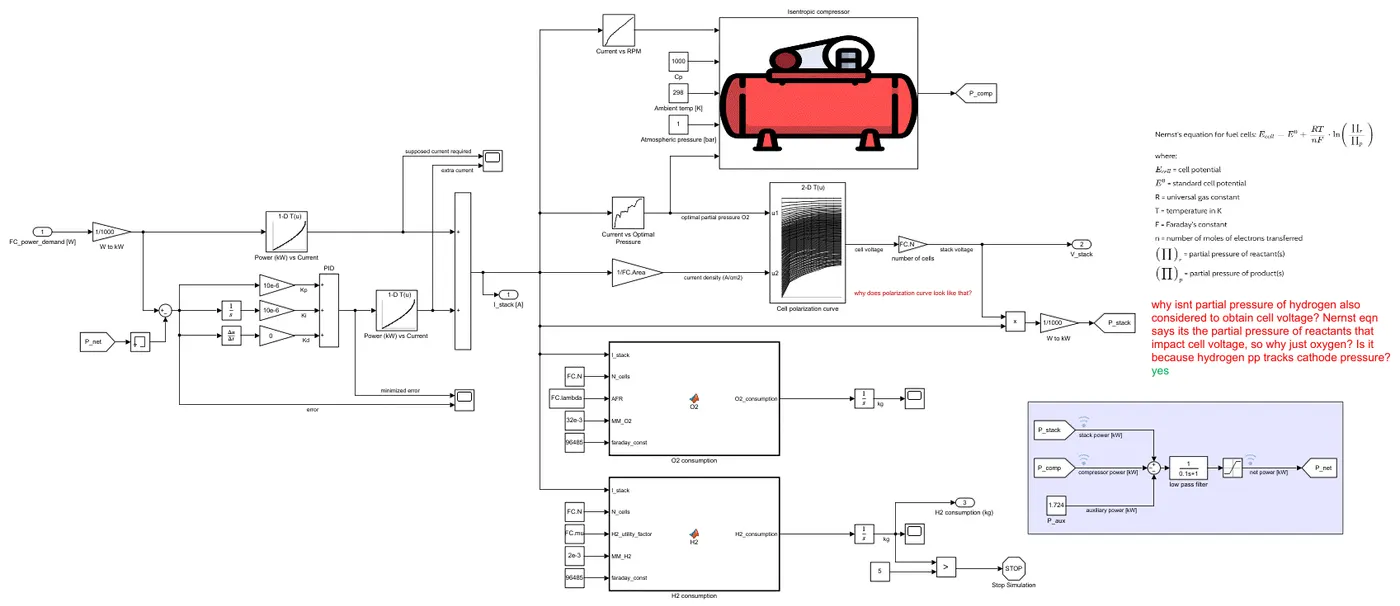
The basic principle of how a FC works is by combining hydrogen fuel and oxygen to create a byproduct of water. The way hydrogen gas separates into ions and electrons and combines back is where all the power of the FC comes from. Hydrogen is stored in high-pressure tanks at around 700bar for automobile applications. Once it is determined how much hydrogen is needed to propel the vehicle, oxygen from the atmosphere is extracted and compressed using a compressor to increase its pressure. The hydrogen gas then tracks the partial pressure of oxygen gas using a control valve and then reacts with it to complete the process of making water as a byproduct of the entire reaction. Compressing both gases to higher partial pressures improves rate of reaction and generates higher cell voltage, which is why compressing the oxygen is necessary.
Once the EMS determines the power demand for the FC, a Power vs Current lookup table outputs the supposed current according to that power demand. That supposed current, through lookup tables, is what determines the RPM the compressor needs to run at and what the optimal pressure for oxygen gas should be.
How much cell voltage the FC stack can produce depends on two factors: partial pressure of gases and current density within stacks (refer to figure below).
Using the stack voltage and stack current, the stack power is then calculated. The power produced by the stack isn't all transferred to run the electric motor, but devices such as the compressor also use it. Hence, the net power output is what's important. Using a PID controller, the difference between the FC power demand and the net power is minimized, so that optimized levels of hydrogen and oxygen are used.
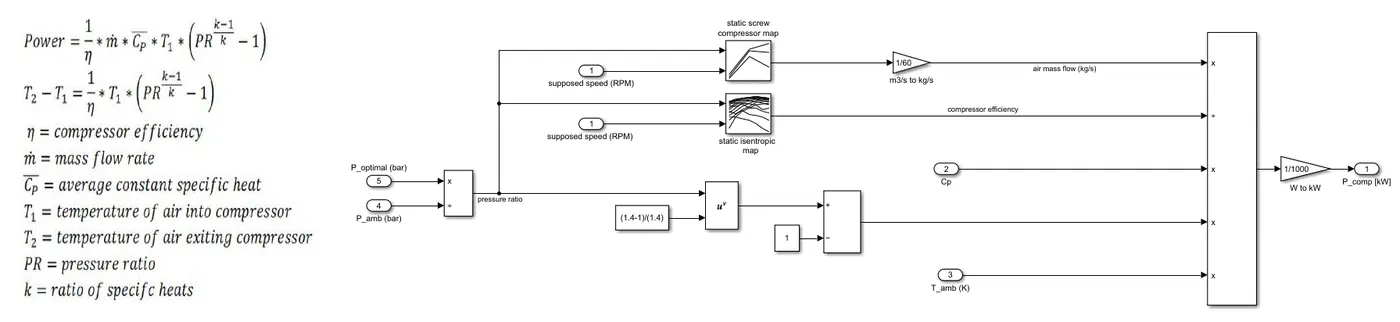
COMPRESSOR SUBSYSTEM:
TRANSMISSION AND WHEELS SUBSYSTEM:
GEARBOX, WHEELS, AND BRAKES:
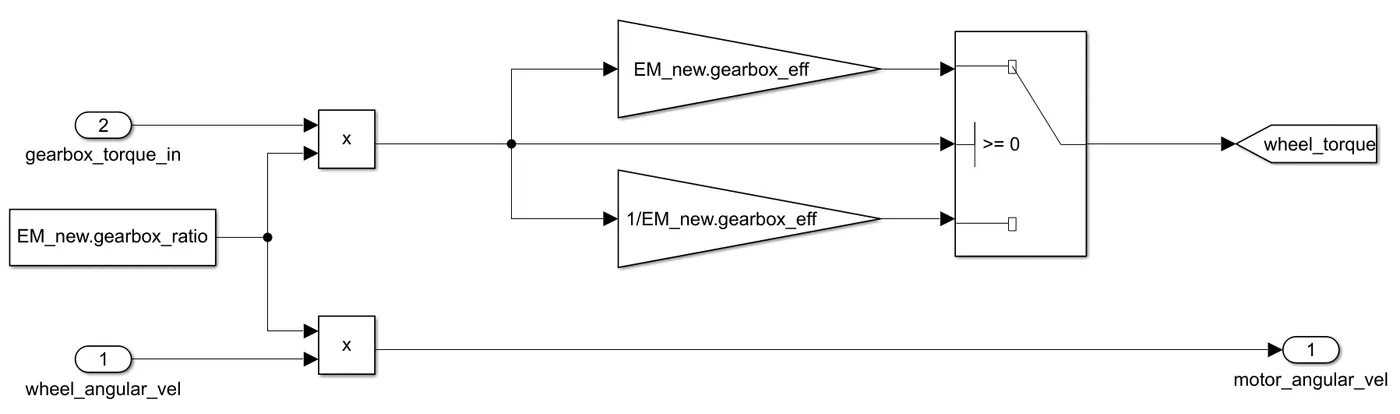
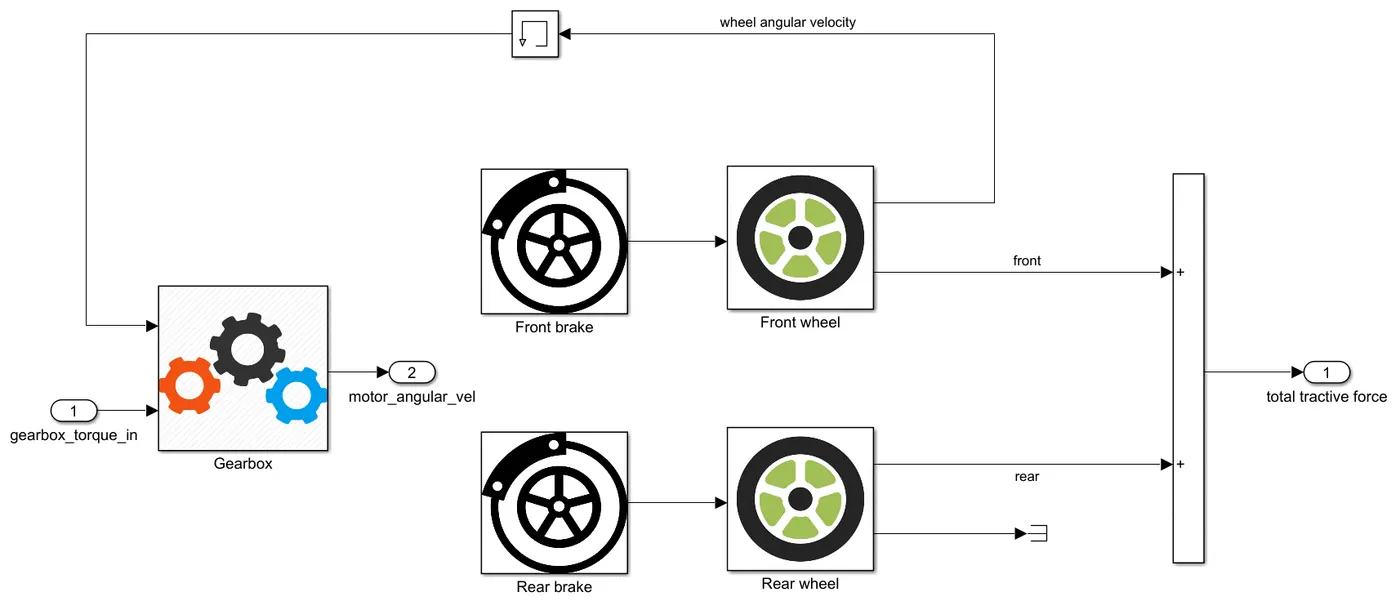
- Gearbox torque input is the same as motor torque output. The torque request given by the electric motor is given to this system where the wheel torque & velocity, and motor's angular velocity is calculated
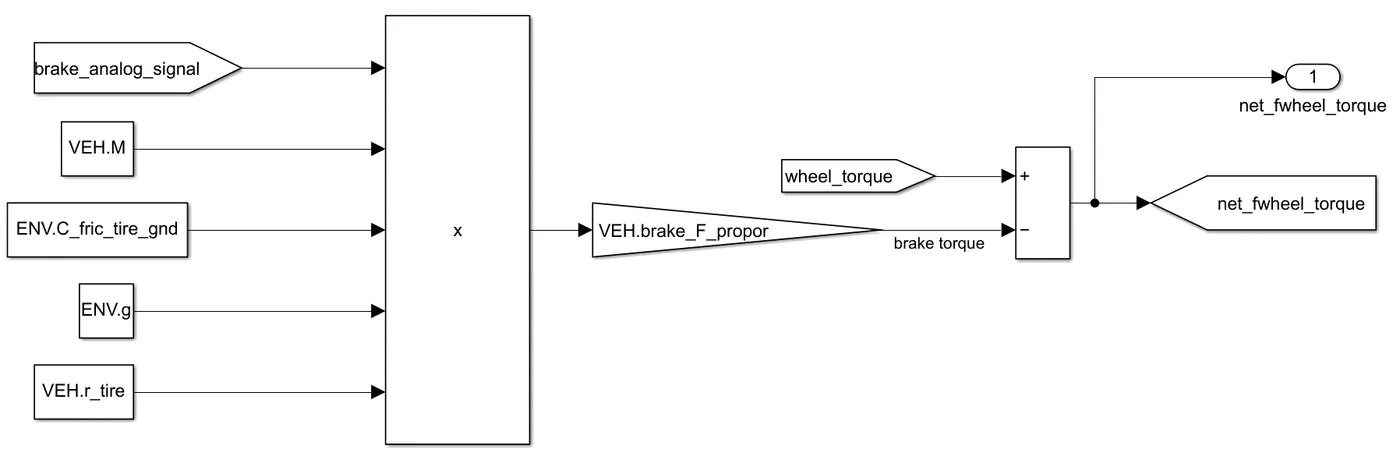
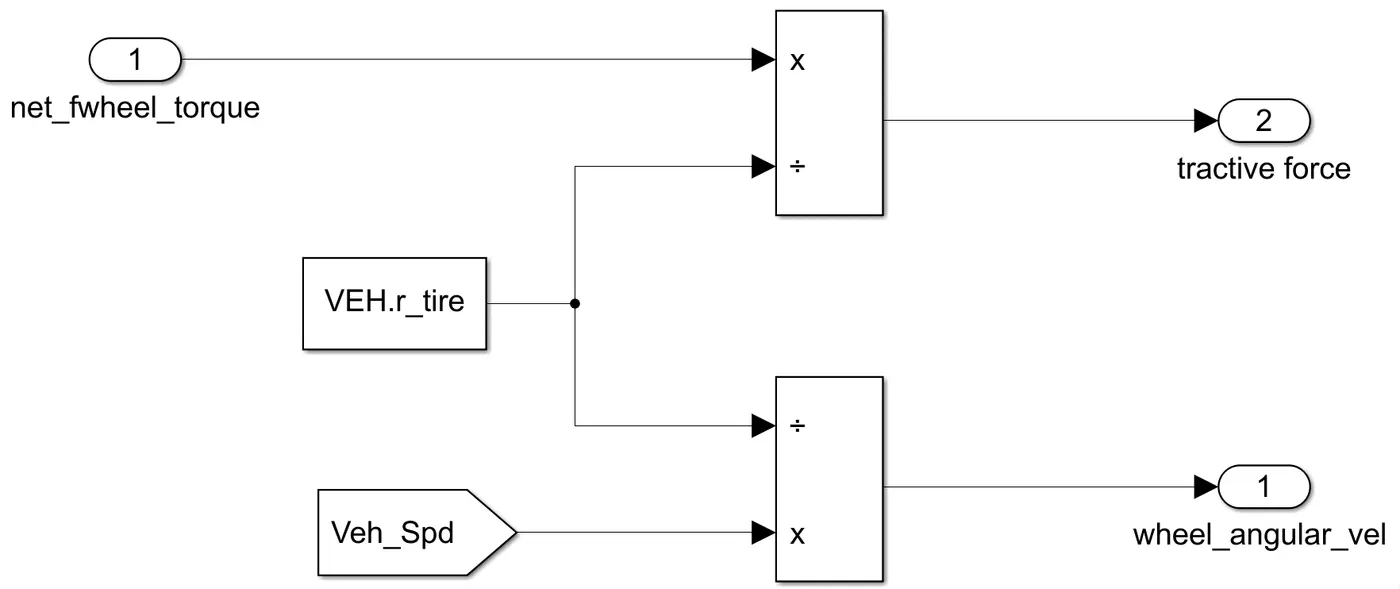
- To find the net front wheel torque, the wheel torque calculated after the gearing is applied needs to account for the brake torque too.
- Braking torque = brake signal x `mu_(rr)*m*g*r`
- Brake signal is a value between 0 and 1; 0 indicating brakes aren't pressed while 1 indicating brakes are fully pressed (see figure below). How much braking torque is produced hence depends on this value.
- Another thing that needs to be accounted for is how much braking energy we want on the wheels. This FCHEV is assumed to be a FWD which means the powertrain, motor, and other components are placed towards the front of the vehicle, exerting more weight on the front wheels. Hence, 60% of the braking torque is given to the front wheels.
- The same is applied for the rear wheel torque
VEHICLE TRACTIVE FORCES:
PERFORMANCE:
TRACKING ABILITY:
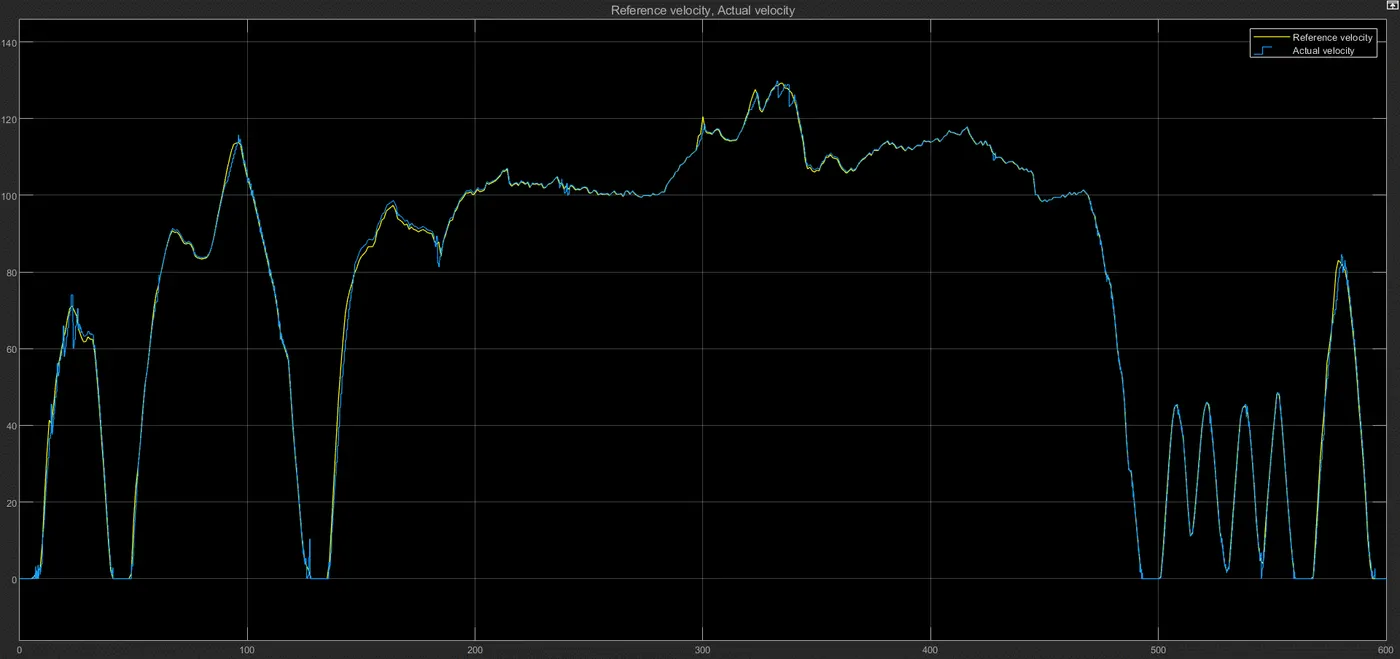
- Tracked quite well but can be optimized further. However, this is a large model with a lot of parameters and variables so optimization is not simple.
HYDROGEN AND OXYGEN CONSUMPTION:
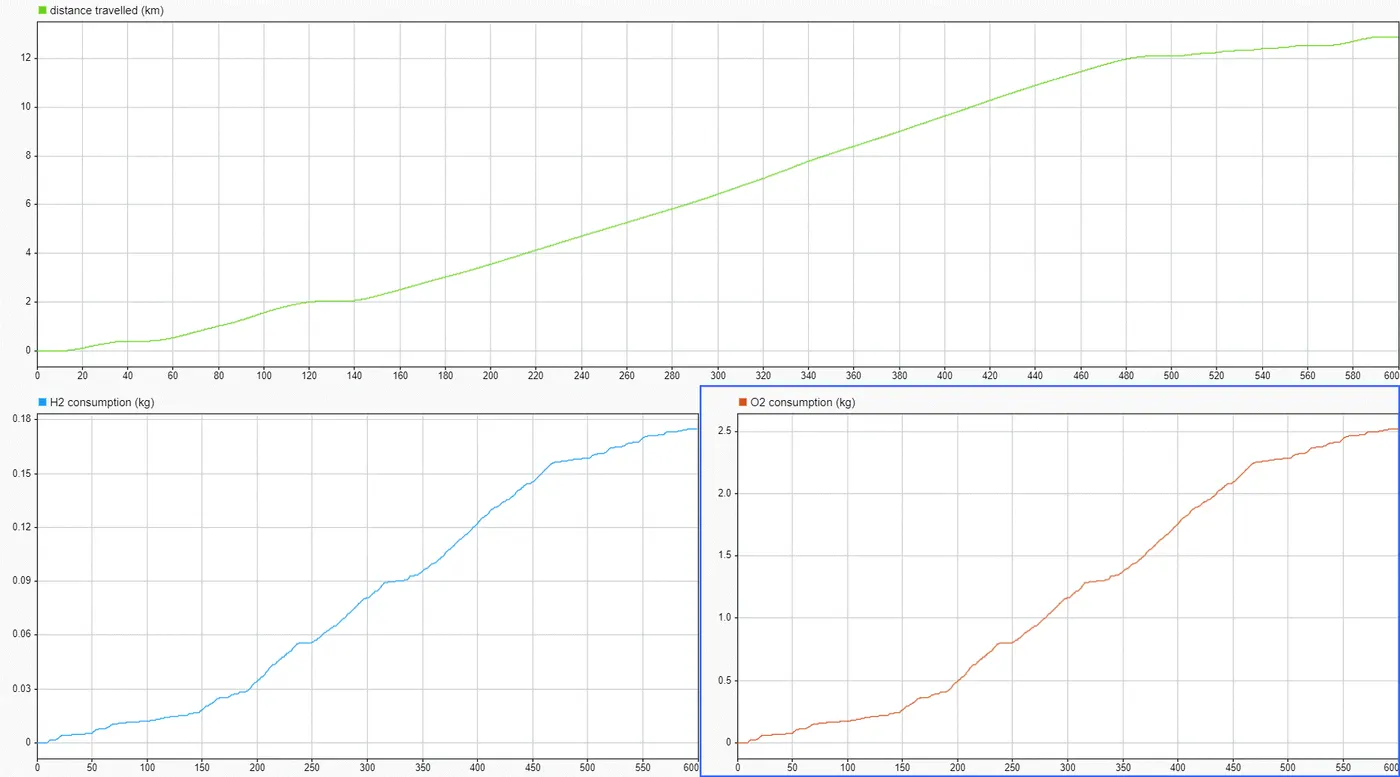
- After a lot of optimization, around 0.175kg of hydrogen has been consumed along with 2.5kg of oxygen to meet the power demand of the US06 drive cycle. A distance of around 12.9km has been travelled.
- FCEVs of today consume about 1.6kg of hydrogen for 160km. Using that data, a US06 drive cycle distance of 12.9km should've used about 0.13kg of hydrogen. This model has used 45g of hydrogen more than the FCEVs of today. Although this proves that the results are valid, this model can be improved further to yield a better result.
CURRENT DISTRIBUTION OF ALL SOURCES:
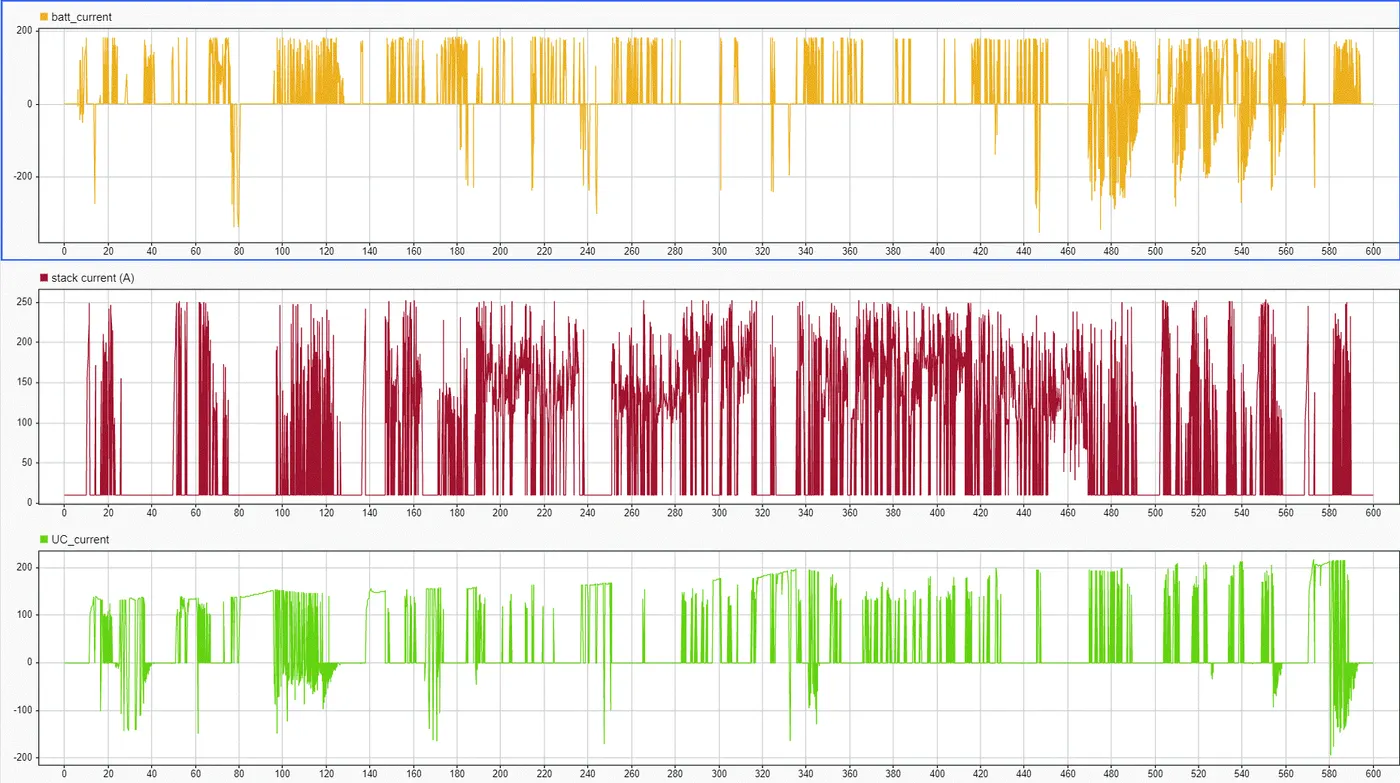
- These results are very satisfactory as current is an important parameter in evaluating the durability and shelf life of the powertrain components and thus the vehicle.
- Battery current output is stable, which is what is desired. With only a few fluctuations in current the temperature of the battery will remain constant and thus the components inside will remain intact for a longer period, thus increasing the durability of the battery pack. In addition, peak current is lower than 200A which is a good indication that the battery is operating in its most efficient region i.e. low power demand.
- High FC stack current could result in fuel cell starvation and/or concentration losses, and this would result in lower stack voltage and sluggish reaction. However, max current is around 250A, which is a good indication.
- Any fluctuation in current has been mainly experienced by the UC, but that is exactly why we incorporated a UC into this model as it is built to handle transient power surges. It significantly reduces the load on the battery, which otherwise would have to handle these transient surges and produce higher peak current. This would not only result in faster degradation of the battery but would also affect performance as the discharge of UC is much faster than that of the battery's. During transient surges, a faster charge/discharge will ensure that performance isn't affected. UC has also ensured that the FC operates smoothly in only its most efficient region.
POWER DEMAND OF ALL SOURCES:
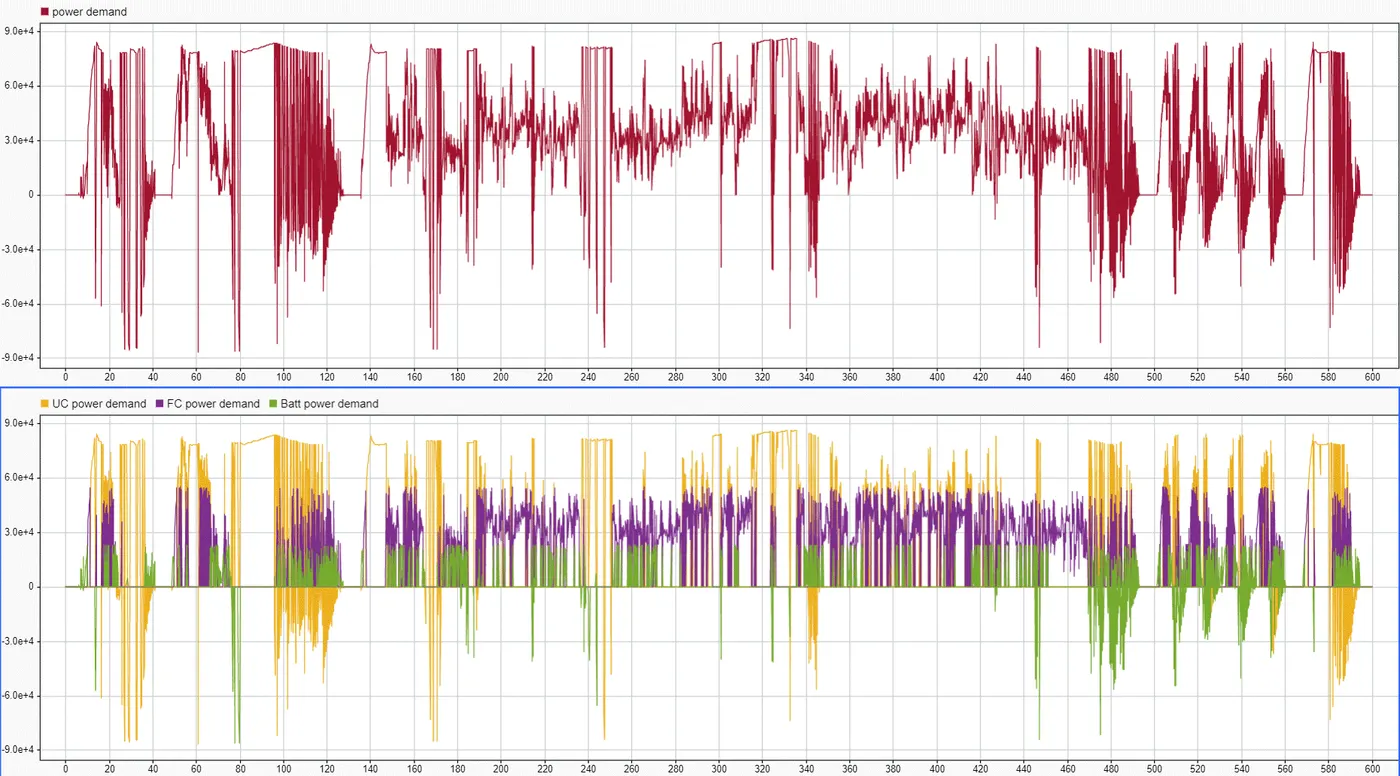
- Evident how the battery, FC, and UC handle low, medium, and high power demand, respectively.