Channel flow simulation using CONVERGE CFD
OBJECTIVE : To simulate flow through channel for different grid size and investigate flow properties .
INTRODUCTION :
Flow through channel and tube is very basic problem for Computation fluid dynamics and are interest of everyday life use.
There are mainly two types flow :
- Open channel flow : In this type of flow one surface is free expose to atmosphere I,e Water Dam
- Close Channel flow : in this type of flow fluid flow through all side bounded surface I,e pipe , Duct or channel
- When fluid flow through pipe in starting at the point of contact velocity is zero hence fluid is at rest condition as moves forward its experiences the shear stress because of velocity gradient between different layer of fluid when its reaches the centre of pipe there won’t be any kind of shear stress since there is negligible velocity gradient hence at this position ( center of pipe) velocity can be seen maximum and parabolic variation of velocity is observed.
- Here our interest to simulate flow through the closed Rectangular channel which has specific length , height and width .A fluid flow through channel parallel to its length through inlet of channel in this case our consideration is 2D flow in which fluid flow thorugh between two fixed we are monitoring different flow properties like pressure , mass flow rate , velocity
PROCEDURE :
1). Creation of geometry
- Select geometry create shape à box and provide value of dx (length) , dy(height) and dz(width)
- dx = 2e-4m, dy = 2e-4m, dz = 2e-4m
- dx = 1.5e-4m, dy = 1.5e-4m, dz = 1.5e-4m
- dx = 1.2e-4m, dy = 1.2e-4m, dz = 1.2e-4m
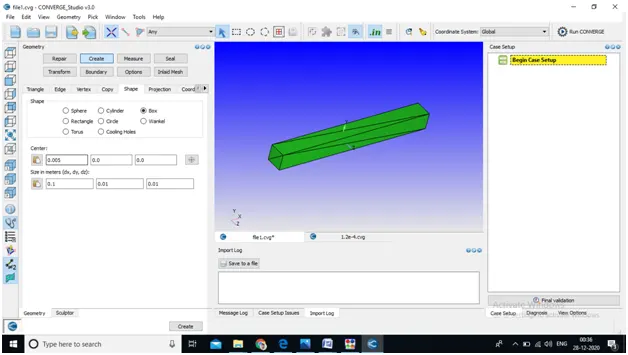
- Click on begin case set up select application type time based
2). Selection of material :
- Check on gas simulation & species, uncheck reaction simulation
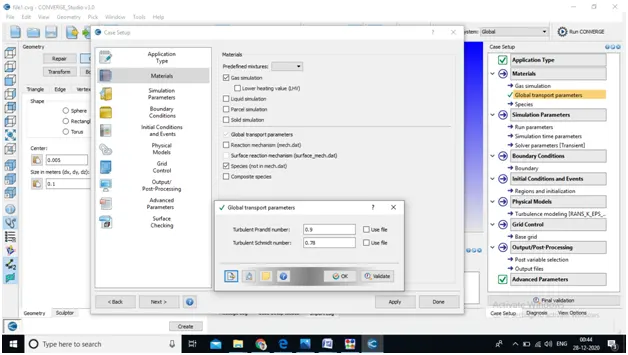
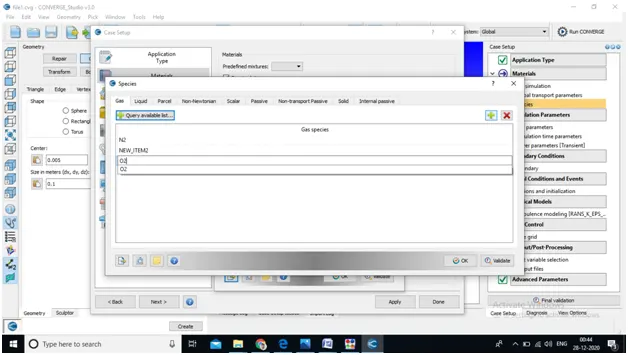
- Add species o2 and N2
3). Assign solving parameter
- Select steady state solver , Full hydrodynamic and compressible flow
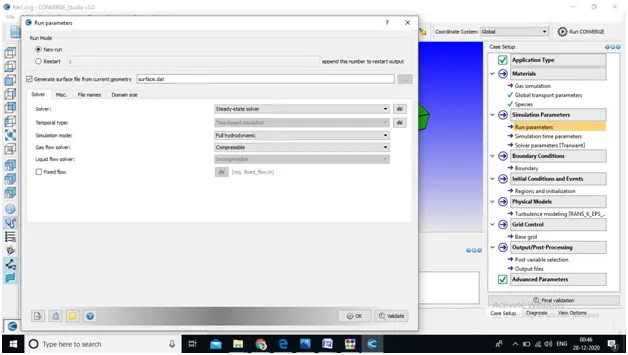
- In misc. uncheck used share memory and check monitor steady state
- In simulation time parameter provide values according to simulation
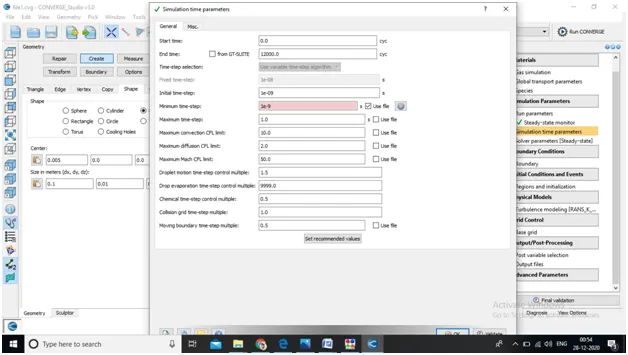
- Solver scheme select PISO solver keep other things same .
4). Assign Boundary at face and give bounadry condition.
- Select Triangle and select trianges on the faces ( I,e upper face in figure) and click on boundary and add boundry follow same procedure for others faces.
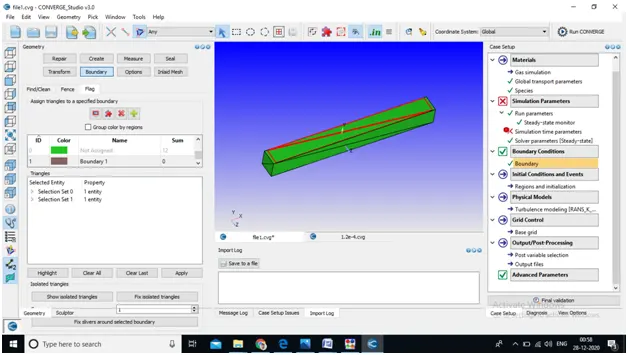
- Once give boundary condition create region & Name and give same region name to all boundaries that we have created
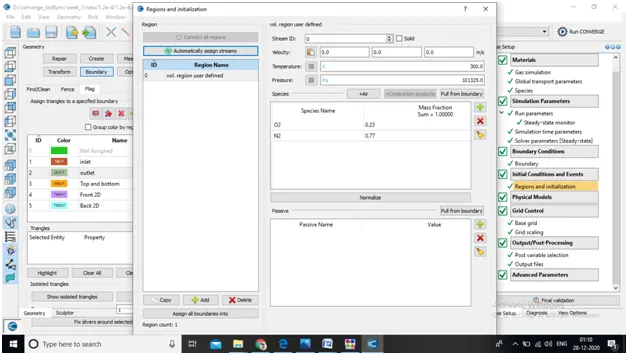
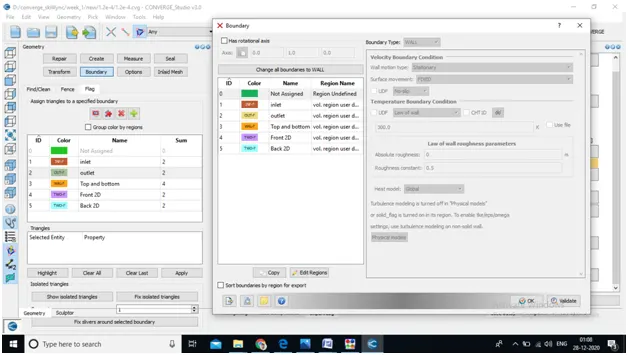
.Boundary Conditions :
- Inlet
- Boundary type : INFLOW
- Pressure : 100001 pa
- Temp :300 K
- Velocity :Zero Gradient
- outlet
- Boundary type : OUTFLOW
- Pressure : 100000 pa
- Temp :300 K
- Velocity :Zero Normal Gradient
- Top and bottom
- Boundary type : WALL
- Wall motion : Stationary & No-slip
- Front and back
- Boundary type : 2D
5). Meshing generation
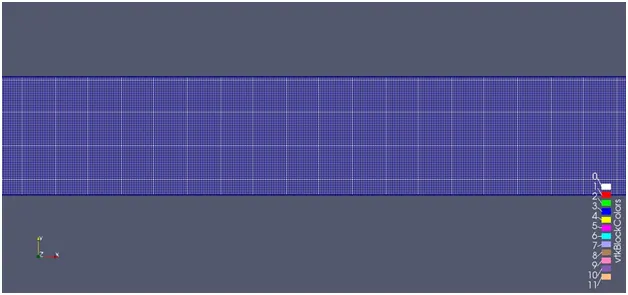
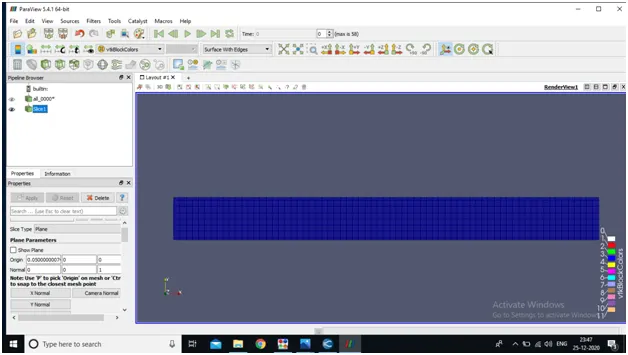
- Provide appropriate valued of mesh size as shown in figure
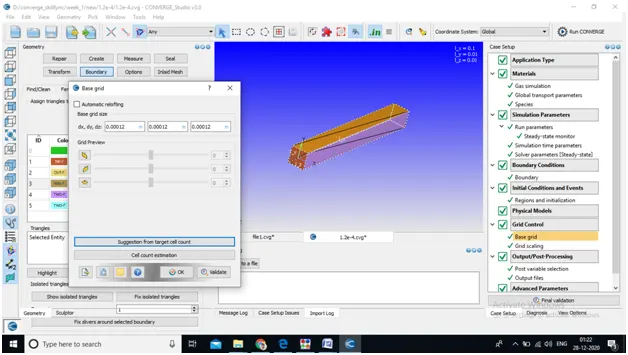
6). Output post processing data
- Select the variable those which needs to post process.
- Provide Data for writing time interval according to simulation
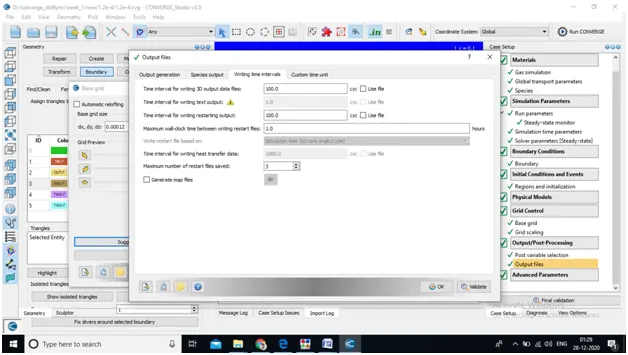
- Once basic case set up prepared check for diagnosis there should not present any error.
Different case :
- Mesh size : 2e-4
- Mesh size : 1.5e-4
- Mesh size : 1.2e-4
1). Mesh size : 2e-4
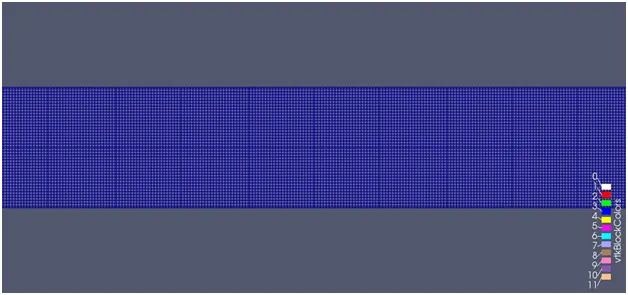
Cell count plot:
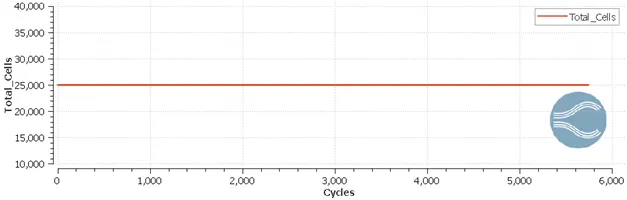
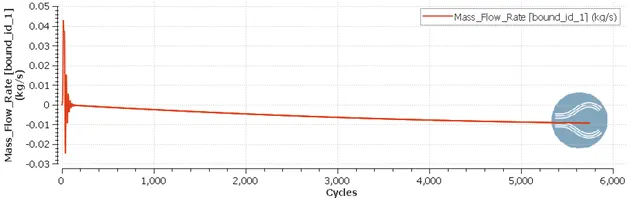
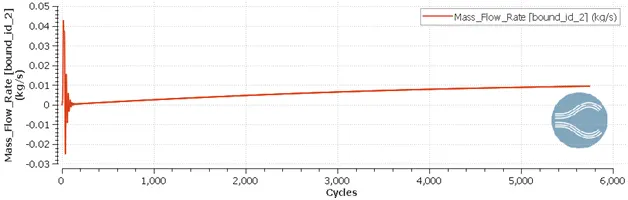
Mass flow rate plot at inlet & outlet :
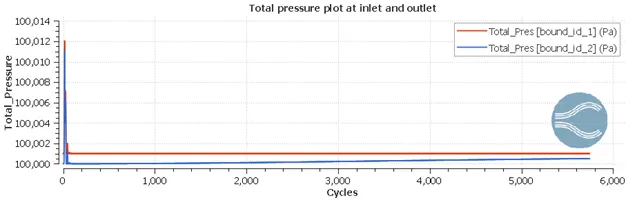
Total pressure plot at inlet & outlet :
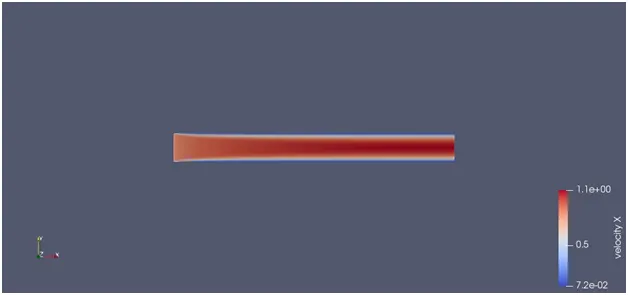
Velocity contour:
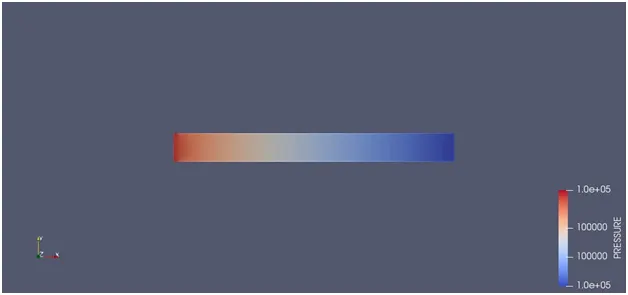
5). Pressure contour
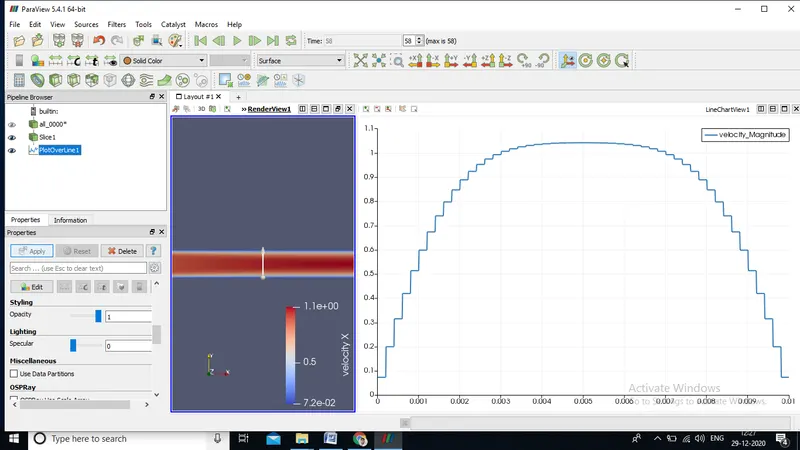
6). Velocity plot at 0.05m along y-direction
2). Mesh size : 1.5 e-4
1). Cell count plot
1). Cell count plot
2). Mass flow rate plot at inlet & outlet
3). Total pressure plot at inlet & outlet
4). Velocity contour
5). Pressure contour
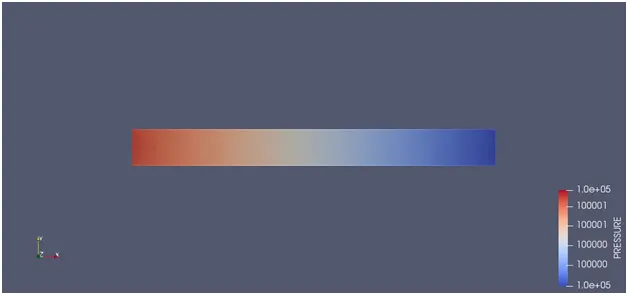
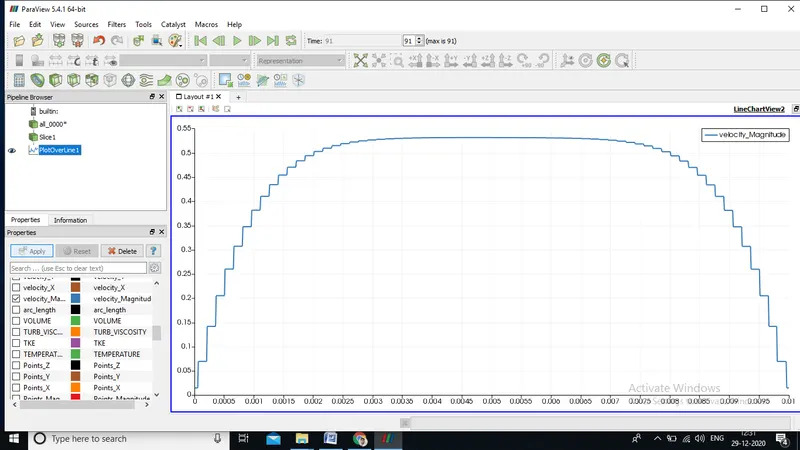
6). Velocity plot at 0.05m along y-direction
3). Mesh size : 1.2e-4
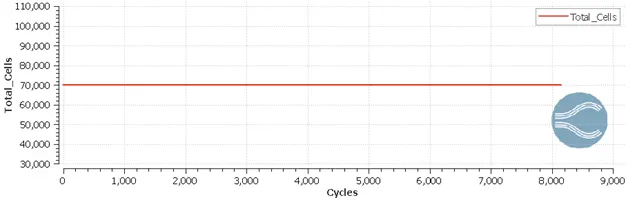
1). Cell count plot
2). Mass flow rate plot at inlet & outlet
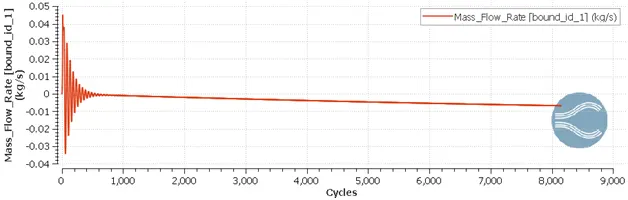
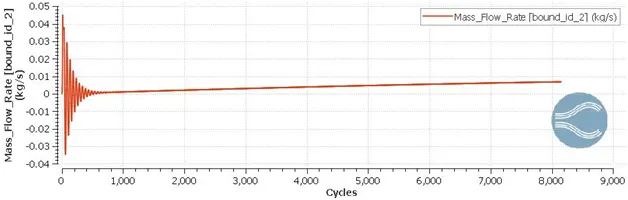
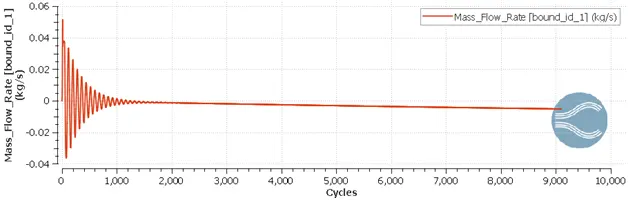
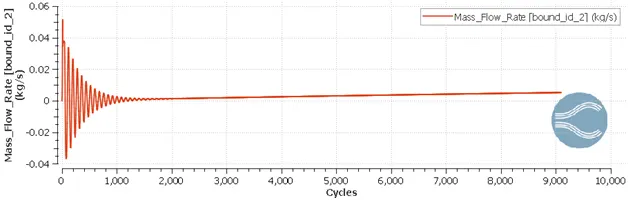
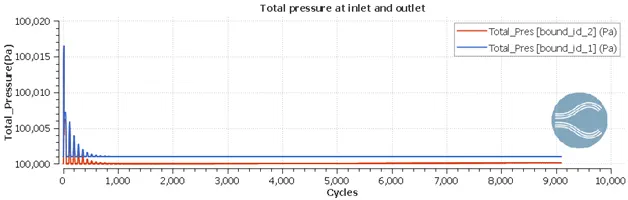
- Mass flow rate is fluctuating in starting becuse of pressure difference in inlet and outlet once its vanished mass flow rate converged and no more fluctuation occured.
- In inlet bounadry mass flow rate is decresing while in outlet with same rate mass flow rate is increasing that means mass flow is being conserved.
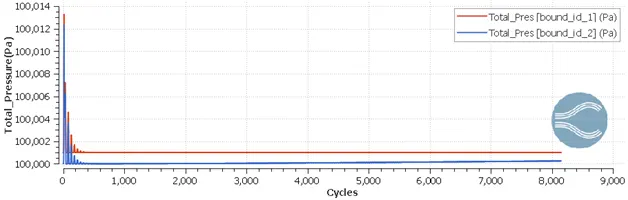
3). Total pressure plot at inlet & outlet
4). Velocity contour
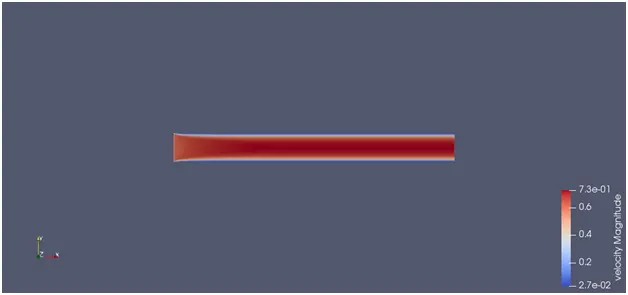
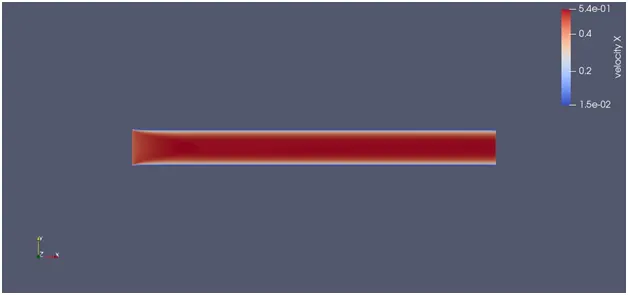
- From velocity contour it can be ssen that in the enterance of velocity profile is not developed fully once its reaches to center of pipe where max. velocity of fluid is observed at center and outlet fully developed boundery is observed.
- 5). Pressure contour
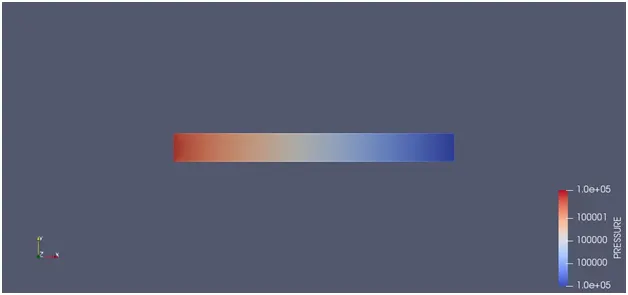
6). Velocity plot at 0.05m along y-direction
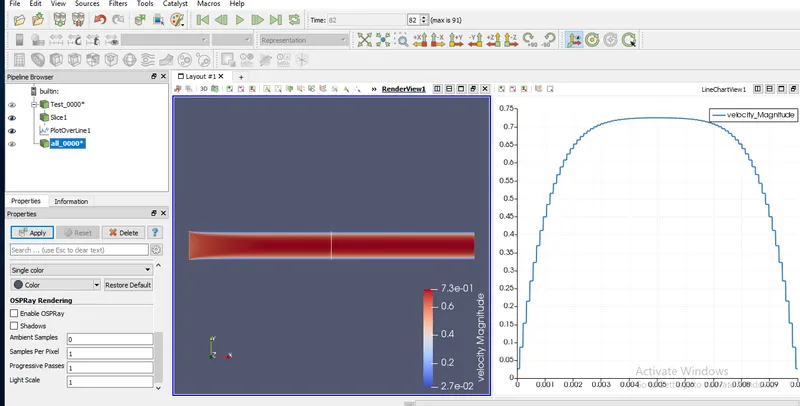
Velocity plot at 0.001m along y-direction
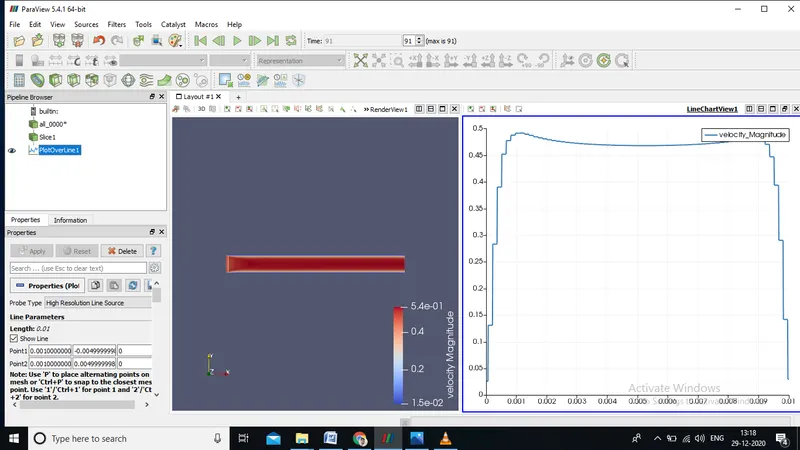
CONCLUSION
- Flow through channel seccessfully simulated with different mesh size as shown above
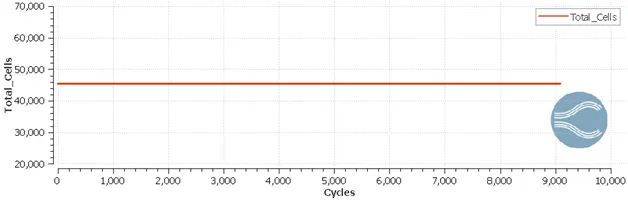
- As mesh size decreses cell count number is increses thats because space between cell is lower.
- With Refined mesh (1.2e-4 ) result is accurate very smooth velocity profile can be seeen .
- At the center of pipe velocity is max. because of boundary layer formation and negligible velocity gradient betweeen two fluid layer