Cyclone Separator Challenge
OBJECTIVE : To simulate flow through cyclone separator for different particle of discrete phase diameter and different inlet velocity for given specific geometry and calculate Cyclone effeciency and pressure drop
INTRODUCTION:
- The cyclone separator is a device for the separation of the dense phase from a two-phase flow, by the action of centrifugal forces. Due to its simple design and absence of moving parts, low manufacturing and maintenance costs, and flexibility for use in extreme operating conditions, cyclone separator has been extensively used both for particle sampling and particle removal from fluids, air or process gases, in the field of environmental control and in industry.
- Working principle
- Due to the specially designed geometrical feature of the cyclone, the fluid entering the cyclone acquires a spinning motion which consists of a double spiral: the outer spiral moving down toward the dust outlet and the inner one moving up toward the exit tube. The dispersed particles, which have a higher density than that of their carrying fluid, are driven by the centrifugal forces to move relative to the fluid motion, toward the side wall of the cyclone and they are finally collected in the dust container cup.
- the smaller particle, which is consistently dominated by the drag of the fluid flow, remains entrained in the inward moving fluid flow and finally it penetrates the cyclone.
- Cyclone pressure drop essentially depends on the cyclone geometry, surface roughness and operating conditions including gas temperature, inlet velocity, and solid loading. The pressure drop can be divided into two parts: Local losses and frictional losses in the cyclone body. For the sake of simplicity, frictional losses will be formulized and then local losses will be included by defining new parameters in the present model.
CYCLONE EFFICIENCY EMPIRICAL MODELS
Iozia and Leith Model
Iozia and Leith logistic model is a modified version of Barth Model, which is developed based on force balance. The model assumes that a particle carried by the vortex endures the influence of two forces: a centrifugal force, Z and a flow resistance, W. The collection efficiency ηi of particle diameter dpi can be calculated from
- ηi = 1/(1 + (dpc/dpi) β )
β is an expression for slope parameter derived based on the statistical analysis of expetimes within the rimental data of a cyclone with D = 0.25 m given as
- β =0.62−0.87ln (dpc/ 100) + 5.21ln (ab/ D2)[1]+ 1.05(ln(ab/ D2))2
Li and Wang Model
The Li and Wang model includes particles bounce or re-entairnment and turbulent diffusion at the cyclone wall. A two dimensional analytical expression of particle distribution in the cyclne is obtained. Li and Wang model developed based on the following assumptions :
- The Radial particle velocity and radial concentration profile are not constant for uncollected particles within the cycle
- Boundary conditions with the consideration of turbulent diffusion co-efficient and particle bounce re-entraintment on the cyclone wall are:
Koch and Licht Model
Kotch and Litch collection theory recognized the inherently turbulent nature of cyclones and the distribution of the gas residence times within the cyclones.
- The tangential Velocity of a particle is equal to the tangential velocity of the flow , there is no slip in the tangential direction between the particle of the gas
- The tangential velocity is related to the radius of cyclone by
- uRn = Constant
Lapple Model
Lapple Model was developed based on force balance without considering the flow resistance.
- Lapple assumed that a particle entering the cyclone is evenly distributed across the inlet opening.
- The p[article that travels from inlet half width to the wall in the cyclone is collected with 50% efficiency, The semi-emirical relationship developed by Lapple to calculate a 50% cut diameter dpc
PROCEDURE :
Mainly following four parts included.
1). Pre-procesing
2). Meshing.
3). Solving .
4). Post- processing
1). Pre-processing : It's include preparation of geometry which is being use in our simulation part .
- Extract fluid volume from available geometry with volume extract options.
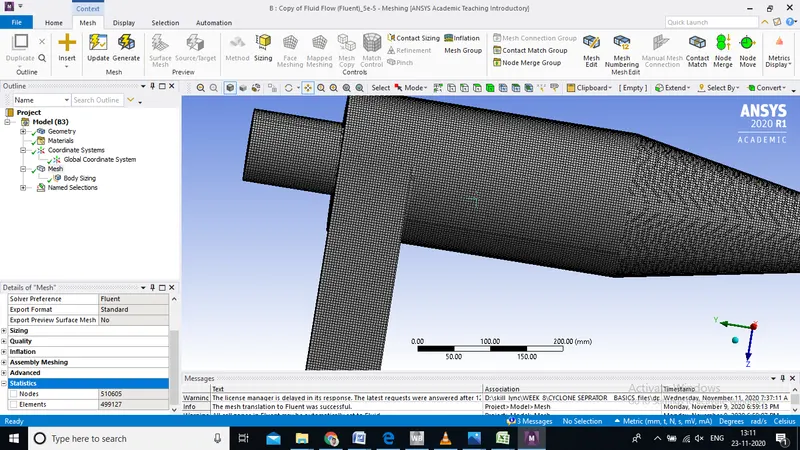
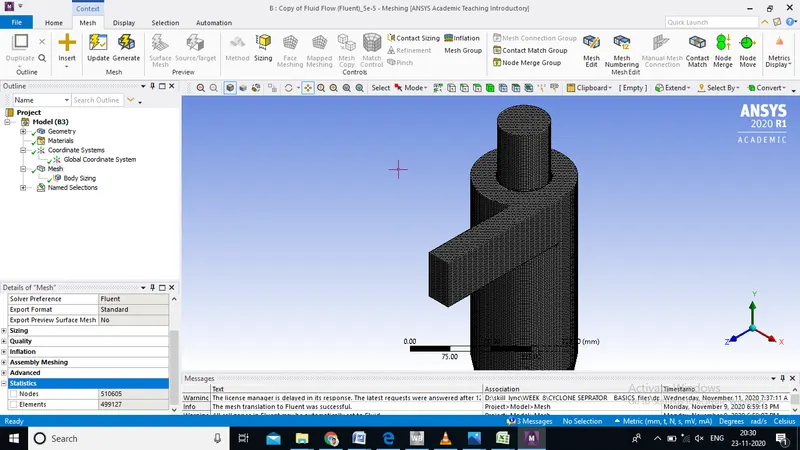
2). Meshing :
-
- Method : Cut-cell method since we have geometry without any cavity
- Capture curvature : Yes
- Element Size =7.5 mm
- No of nodes = 510605
- No of Element = 499127
3). Solving :
- Select k-e with RNG , Swirl Dominated flow model
- Select Pressure based solver Transient time solution and unable gravity option and provide -9.81 m/s^2.
- Select pressure based solver and perform steady state simulation
- Enable Discrete phase modeling and select interaction with continuous phase and Update DPM Source at every iteration
- Click on Tracking provide value of No. of time step and step length factor
- for more no. of incomplete particle no. of max. step size can be increase further
- In injection provide type of injection with released surface
- Select particle anthracite and select Uniform diameter
- give velocity of particle and diameter of discrete phase accordingly simulation
- Click on Tracking provide value of No. of time step and step length factor
- Boundary condition
- Inlet : velocity 1m/s in DPM provide reflect
- Outlet ( Top ) : pressure 0 guage & Descrete phase boundary Provide escape
- Outlet (Bottom) : : pressure 0 guage & Descrete phase boundary Provide Trapped
- Select material as Air
- Provide Momentum as first order upwind
- Turbulence dissipation rate as second order upwind
- Intialize solution as a standard
4). Post- processing
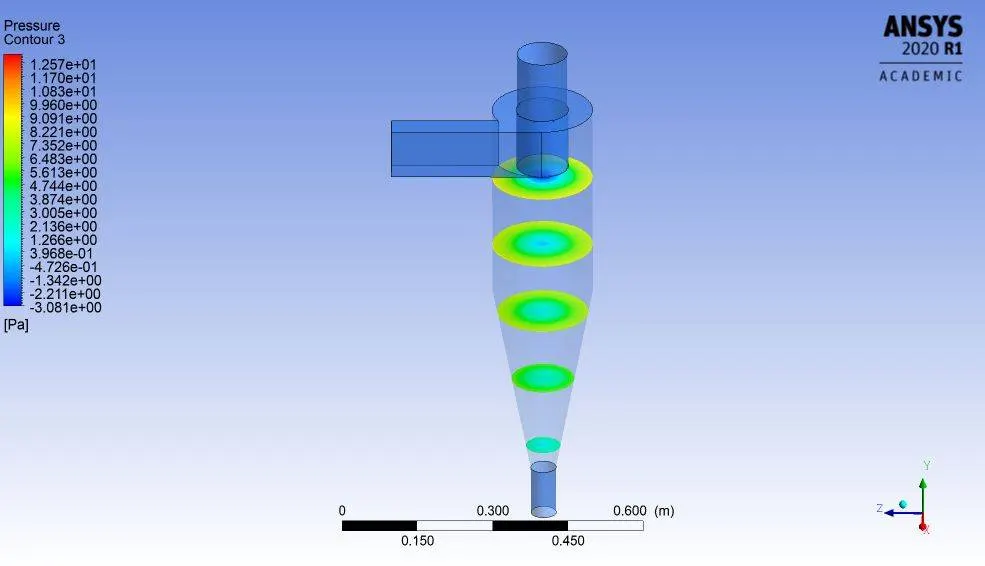
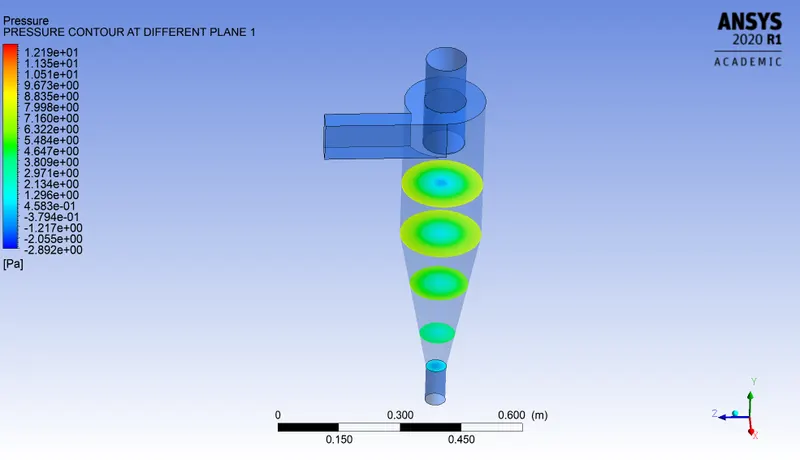
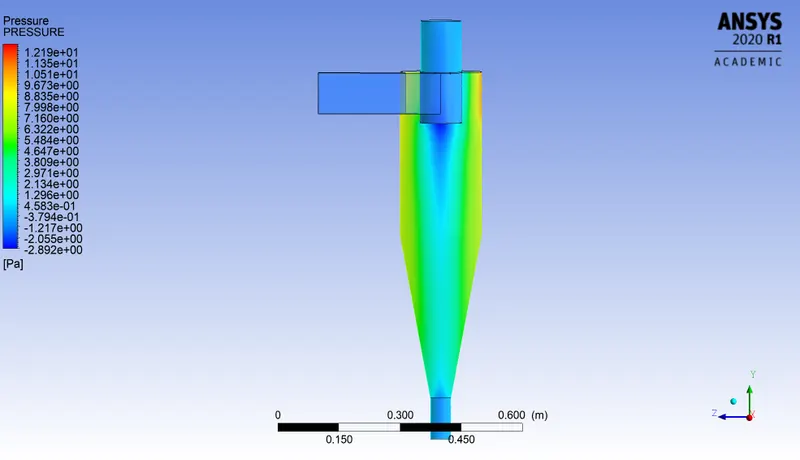
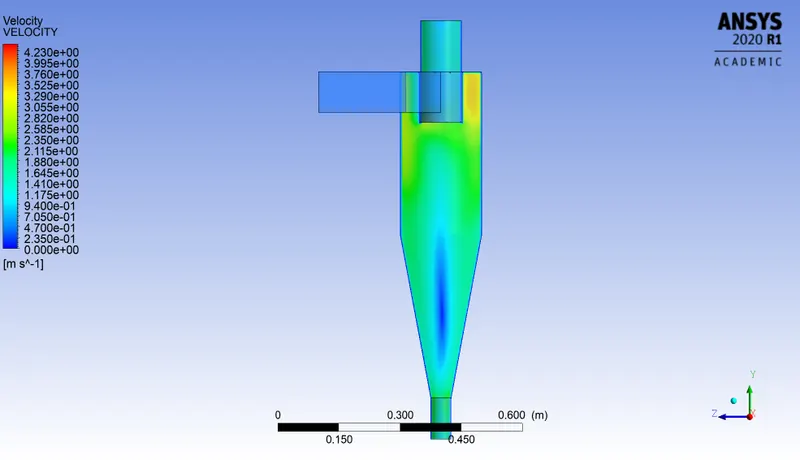
- Create contour of pressure and velocity at appropriate plane
- Create anthracite Pt time animation
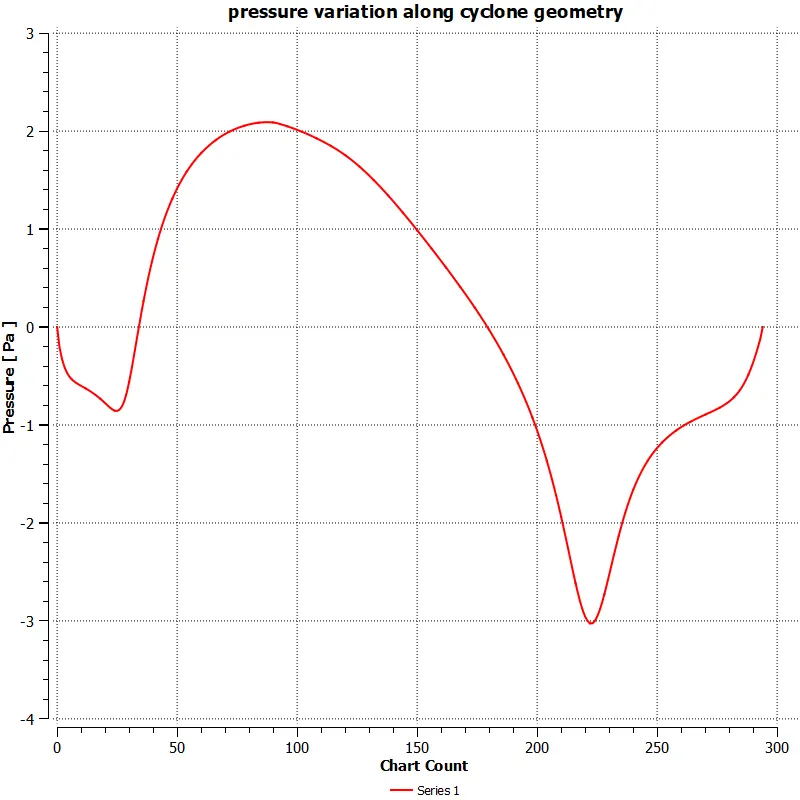
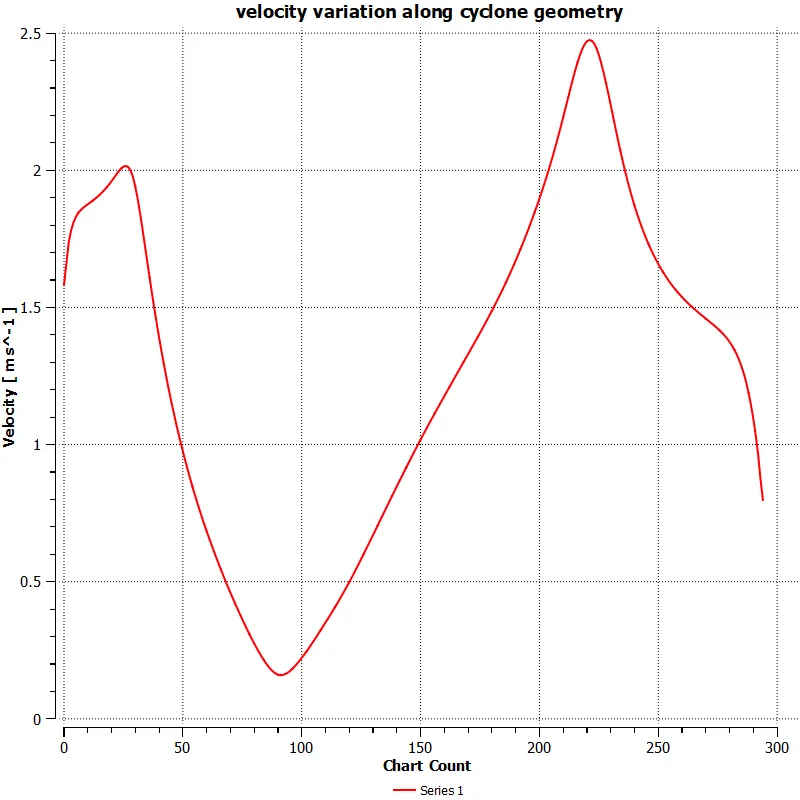
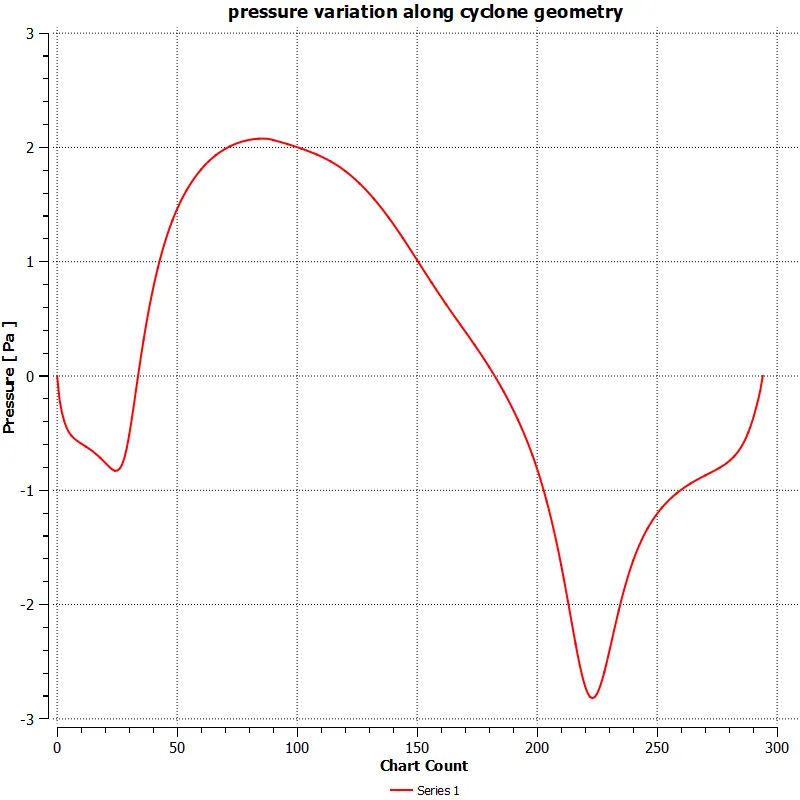
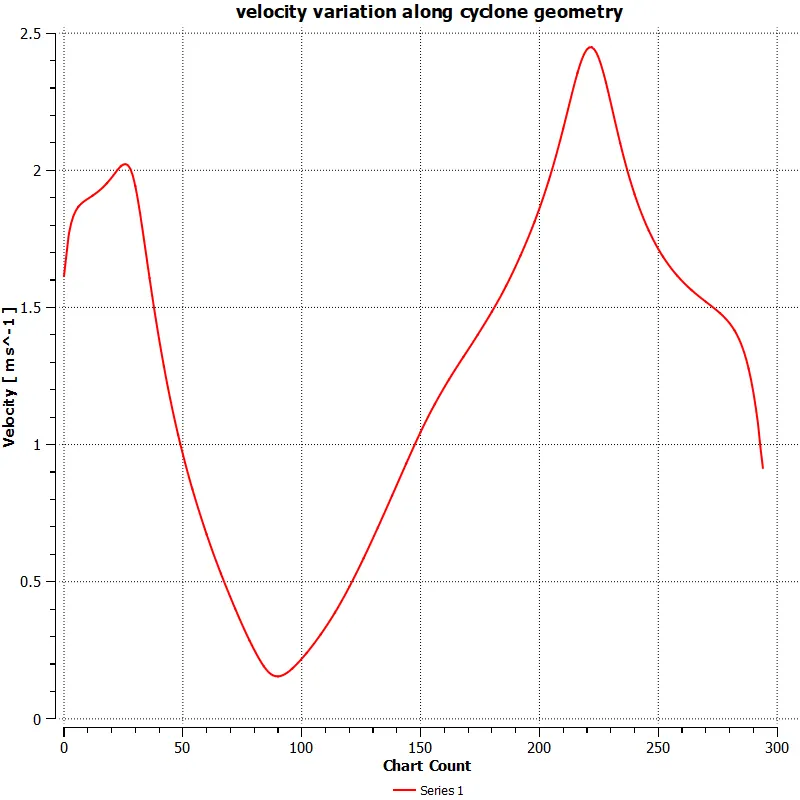
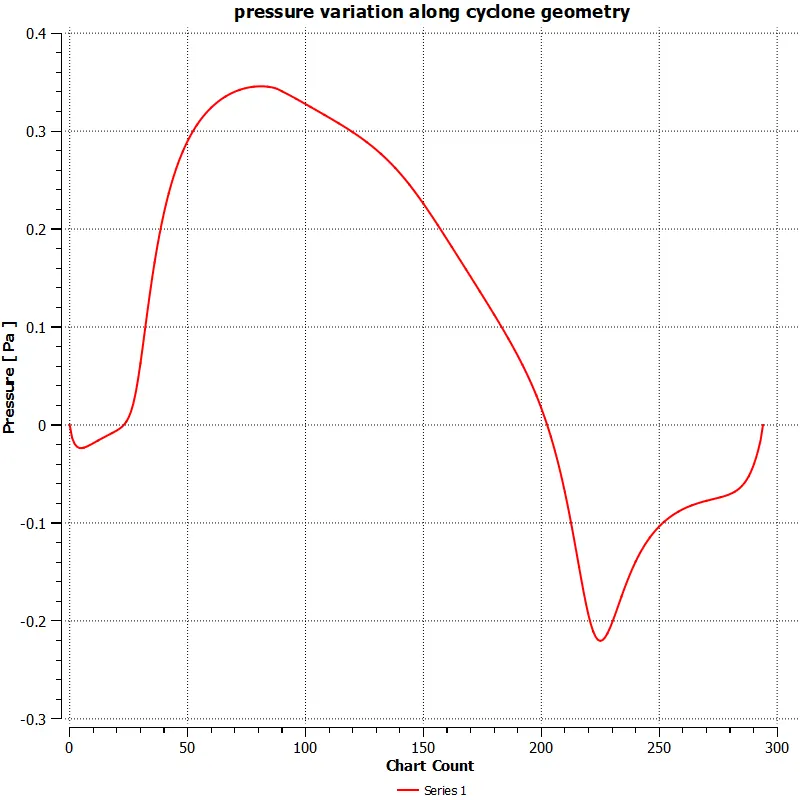
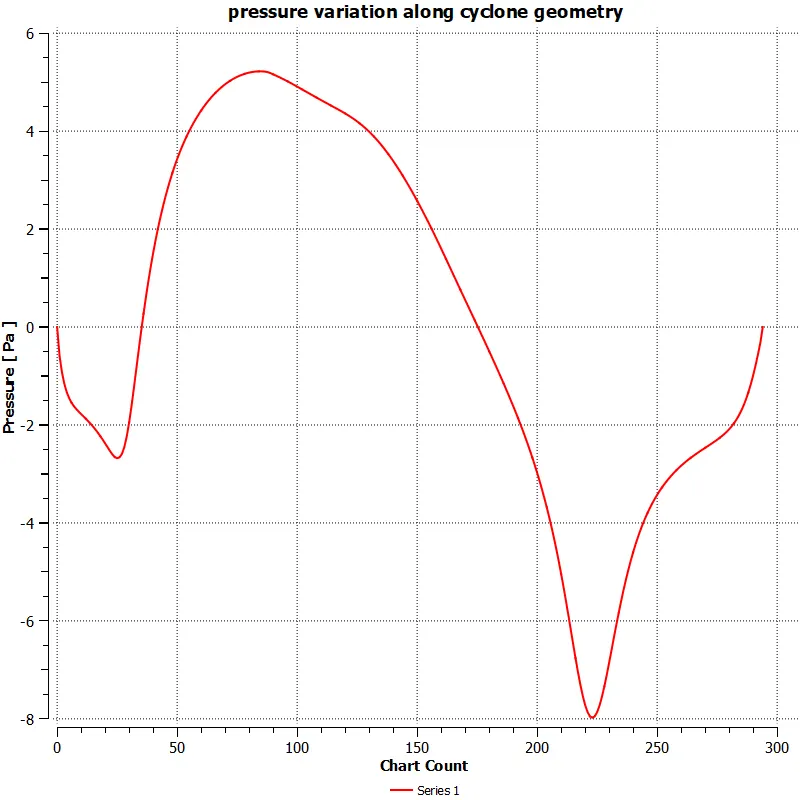
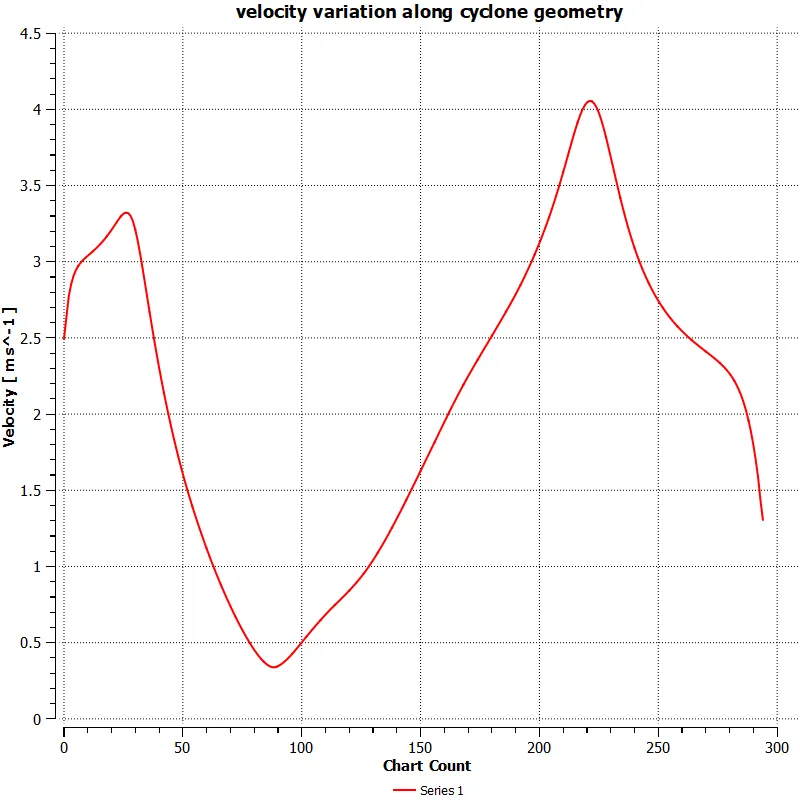
- Velocity and pressure variation along cyclone separator .
DIFFERENT CASES -
- CASE -1 : 3 m/s particle velocity with different Particle diameter
- CASE -2 : 5 micron particle Diameter with different Particle Velocity
- CASE -1
1). 3 m/s particle velocity with 1 Micron Particle diameter
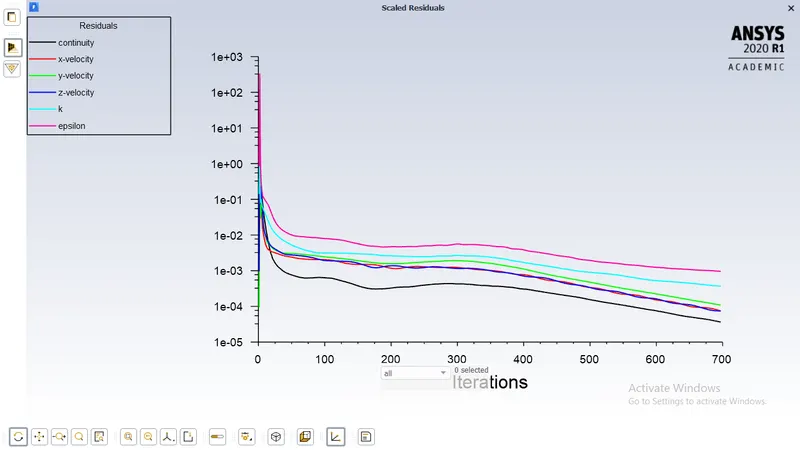
Residual plot
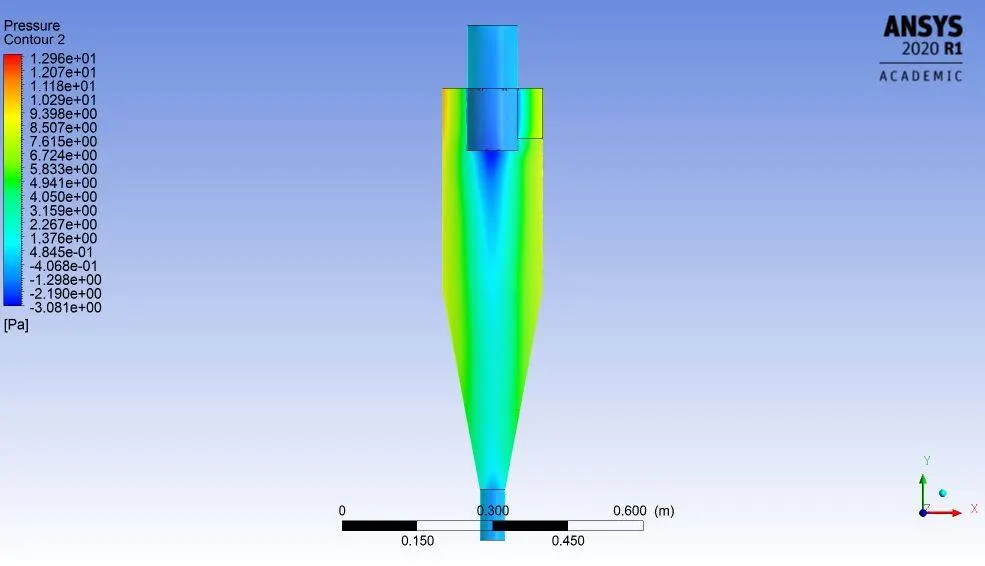
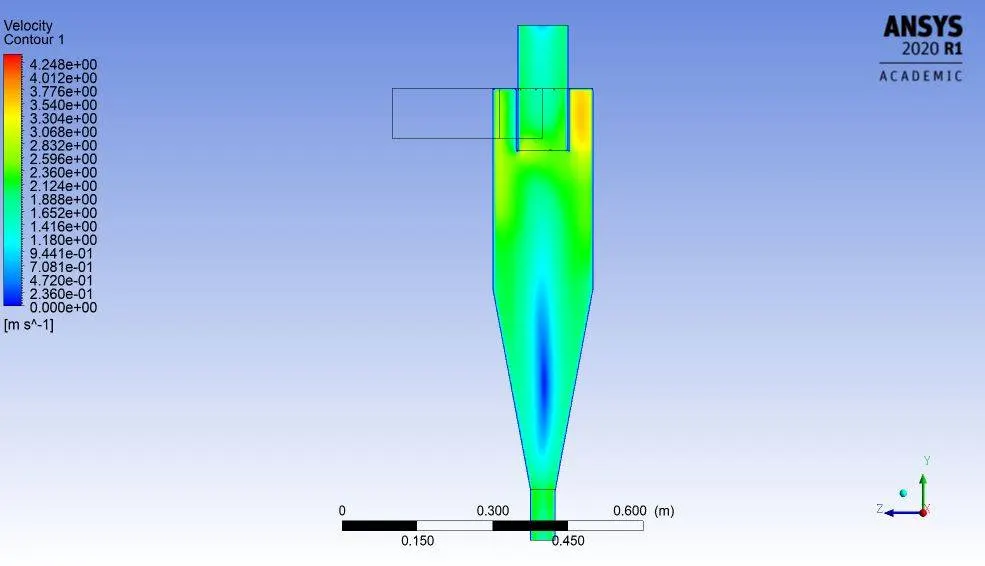
pressure and velocity contour plot at different plane
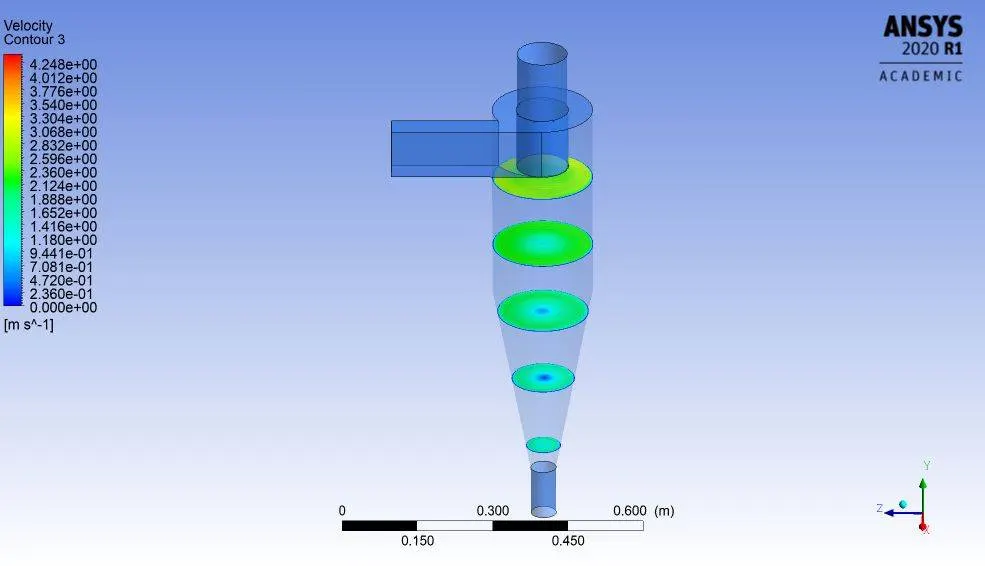
pressure and velocity contour plot @xy plane
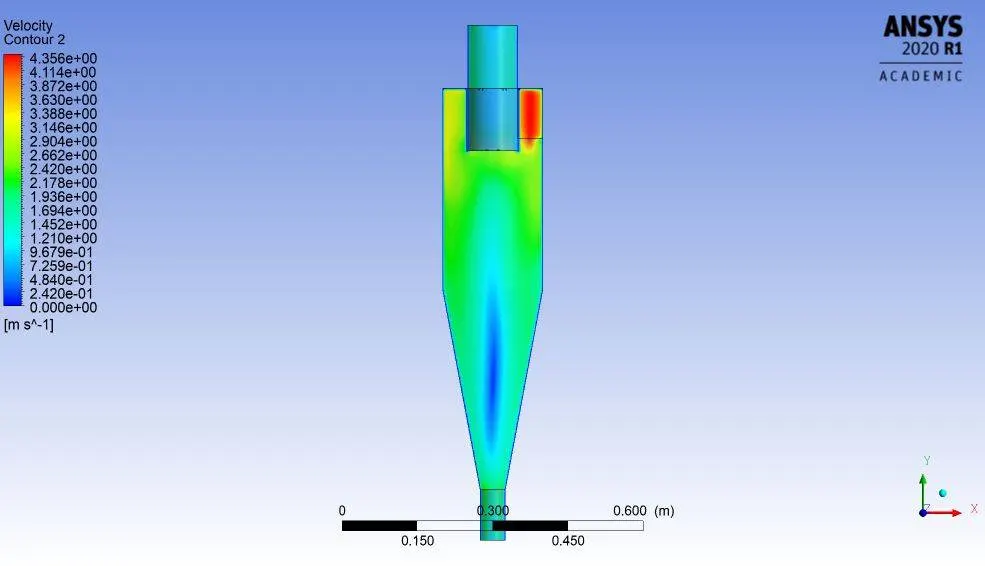
velocity @yz plane
pressure and velocity variation along cyclone geometry
2). 3 m/s particle velocity with 2.5 Micron Particle diameter
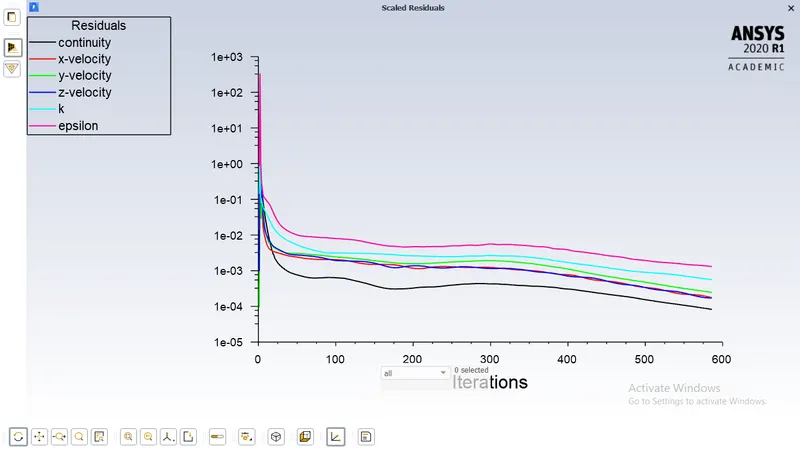
Residual plot
pressure and velocity contour plot at different plane
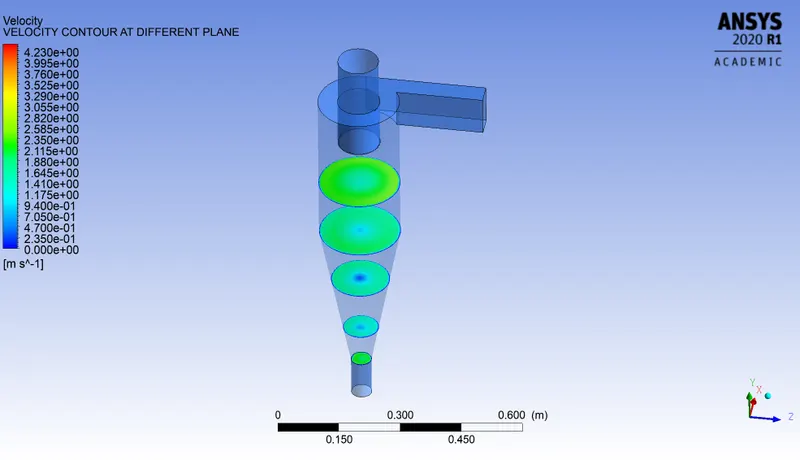
pressure and velocity contour plot @xy plane
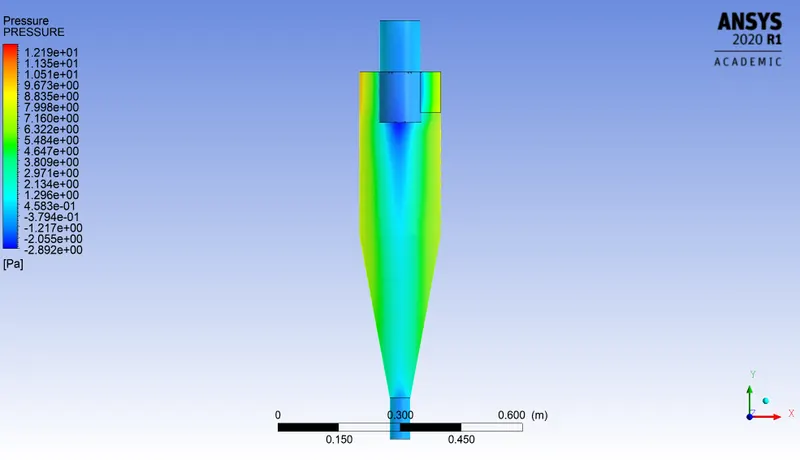
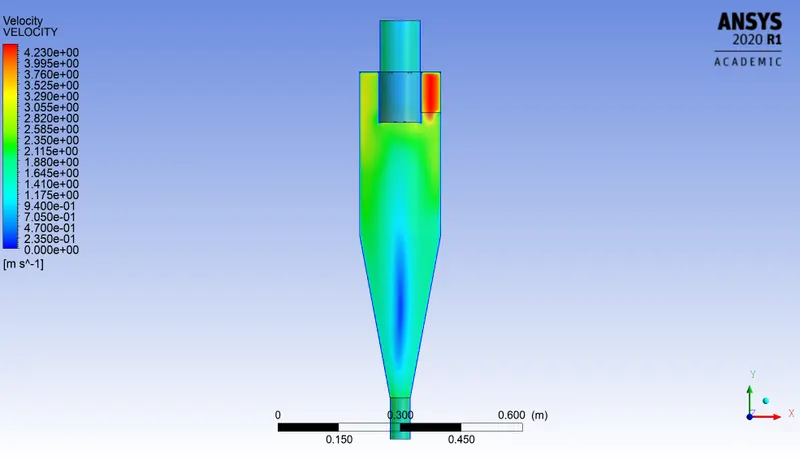
pressure and velocity contour @ yzplane
pressure and velocity variation along cyclone geometry
3). 3 m/s particle velocity with 5 Micron Particle diameter
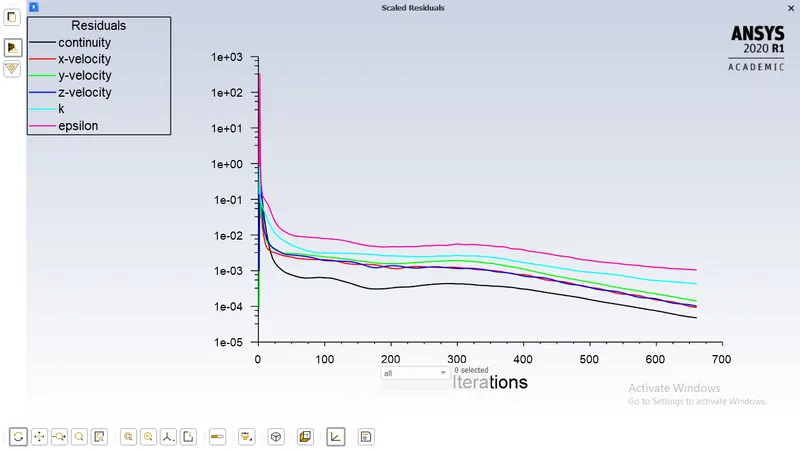
Residual plot
pressure and velocity contour plot at different plane
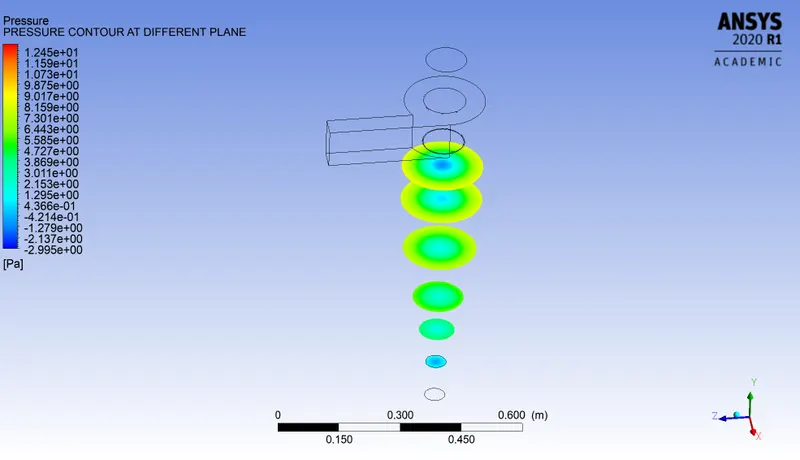
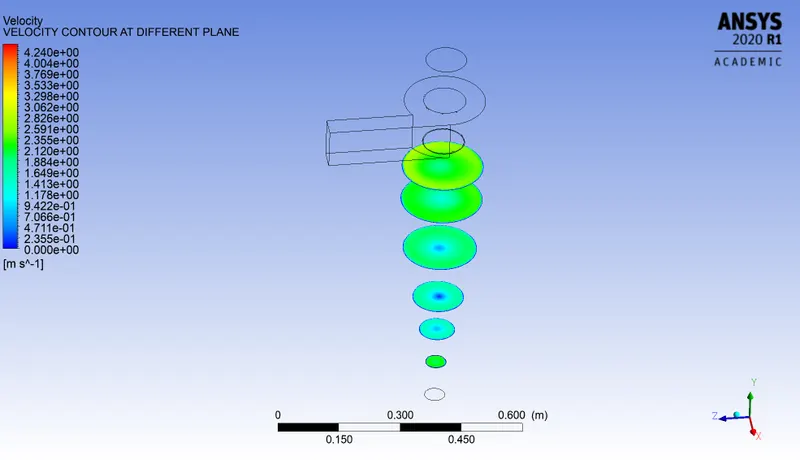
pressure and velocity contour plot @xy plane
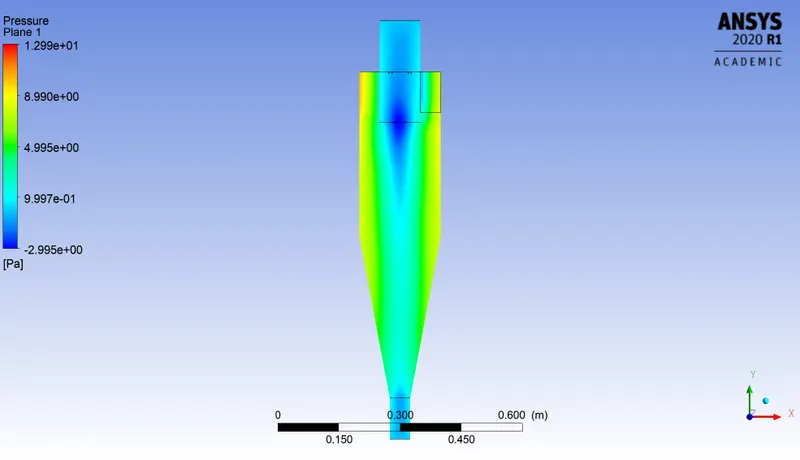
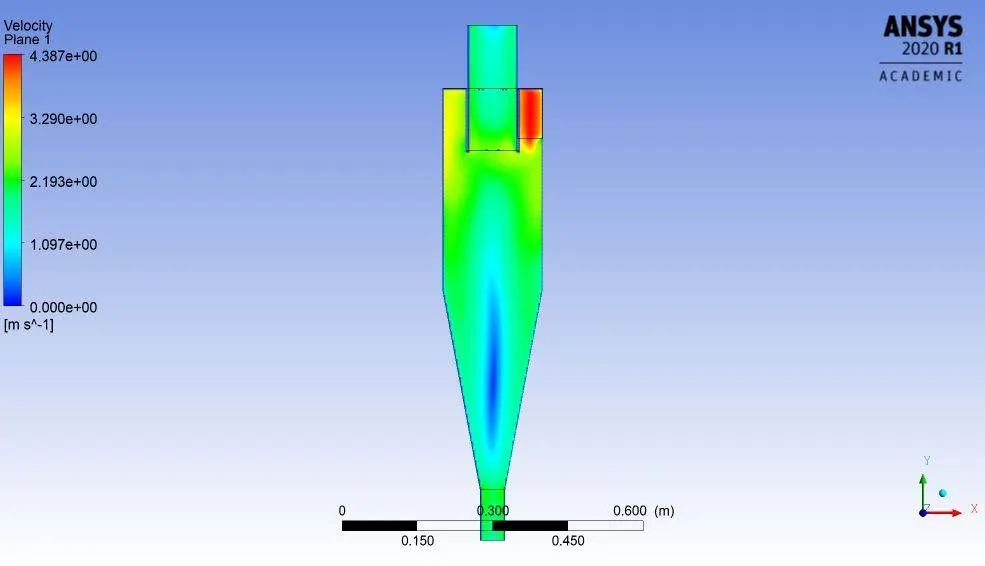
pressure and velocity contour @ yzplane
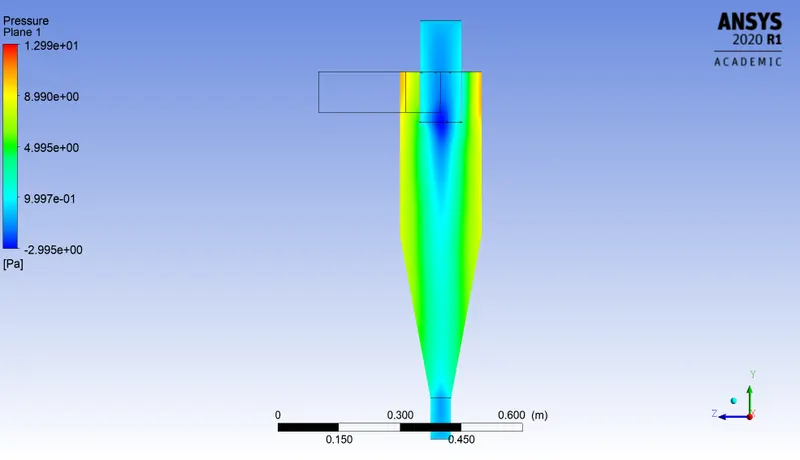
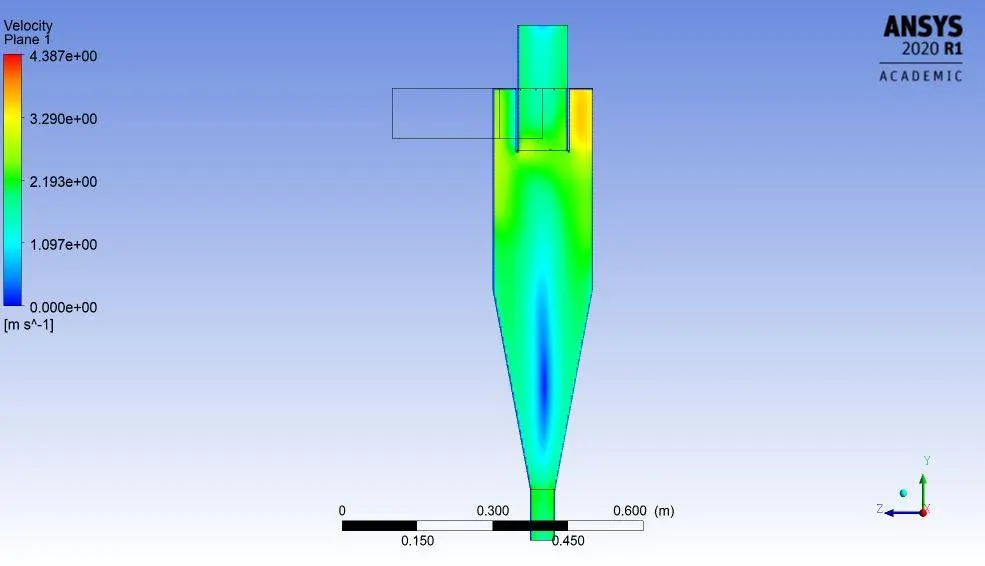
pressure and velocity variation along cyclone geometry
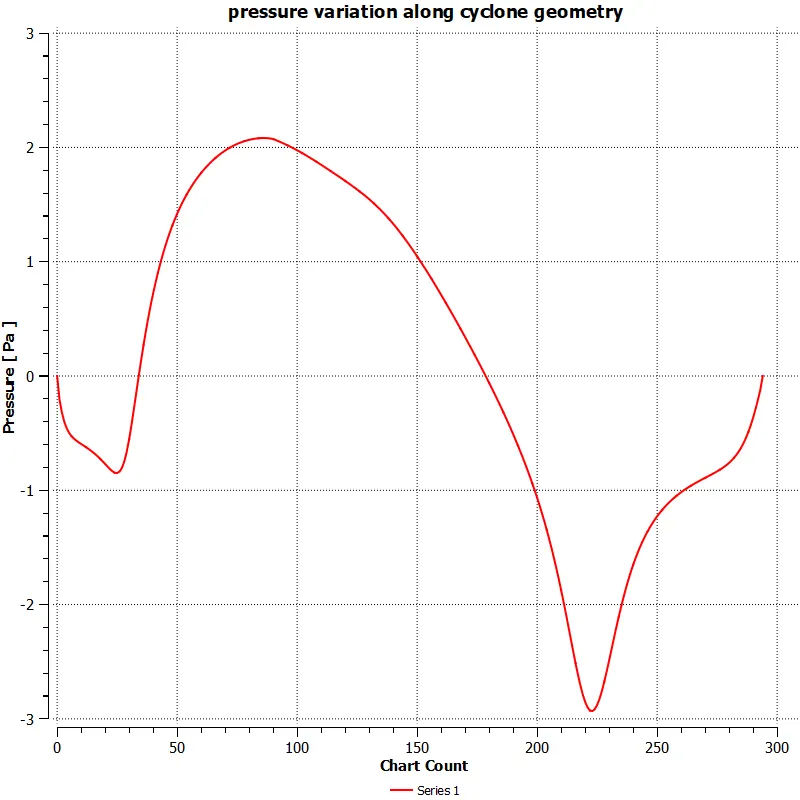
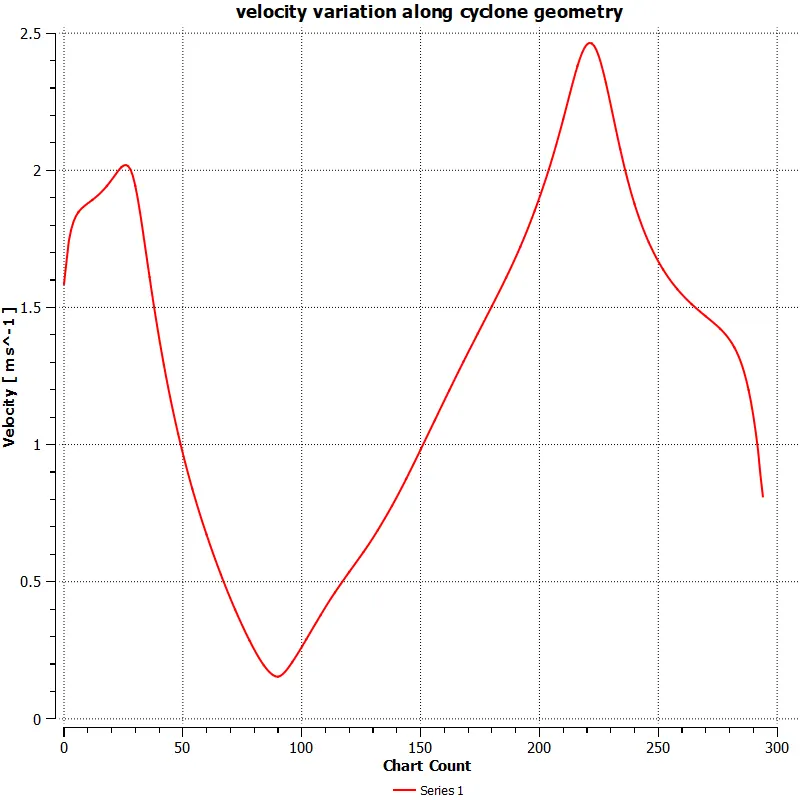
- CASE -2
1). 1 m/s particle velocity with 5 Micron Particle diameter
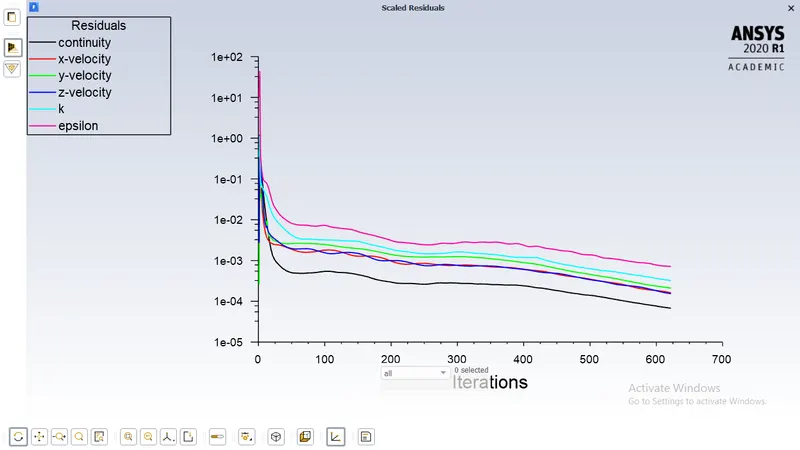
Residual plot
pressure and velocity contour plot at different plane
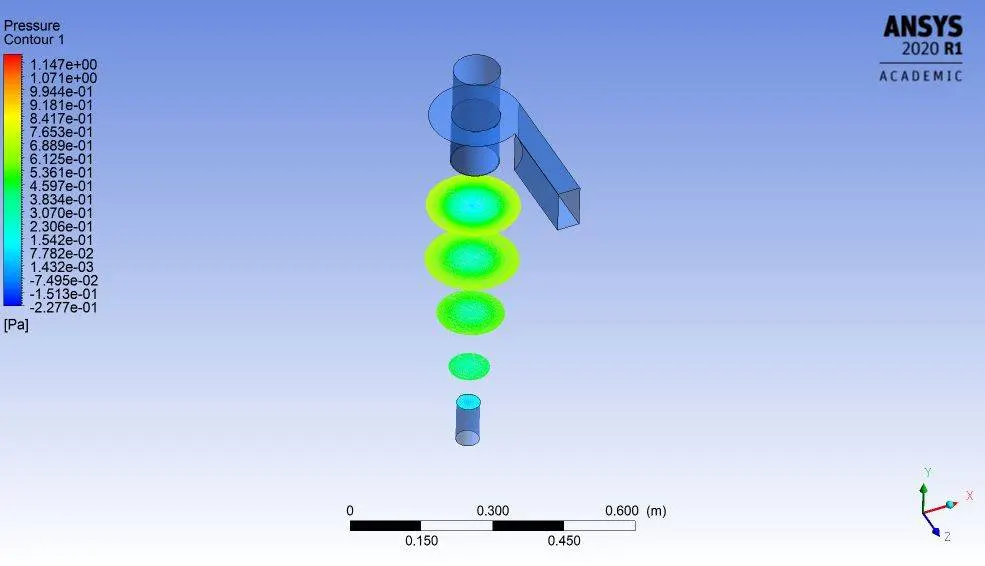
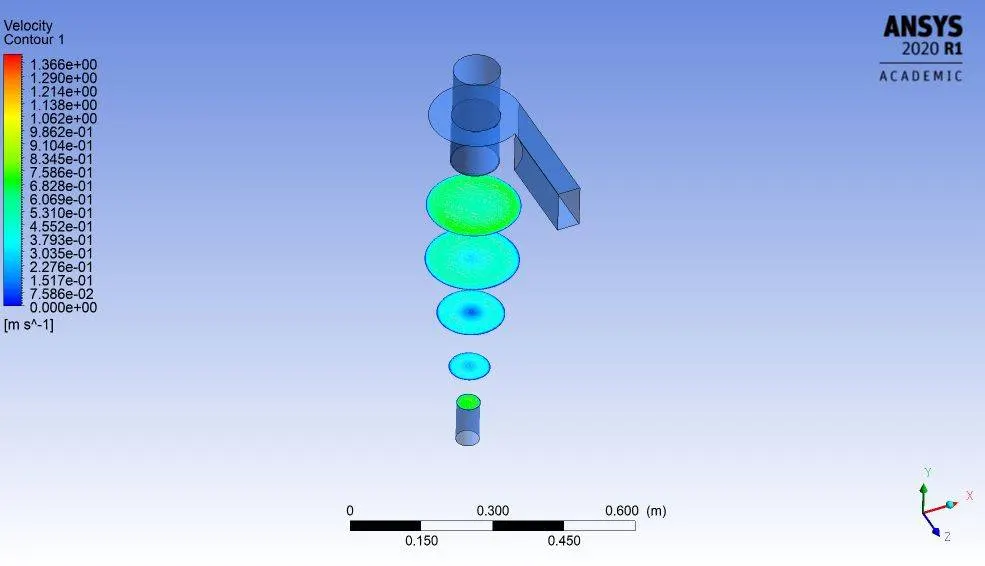
pressure and velocity contour plot @xy plane
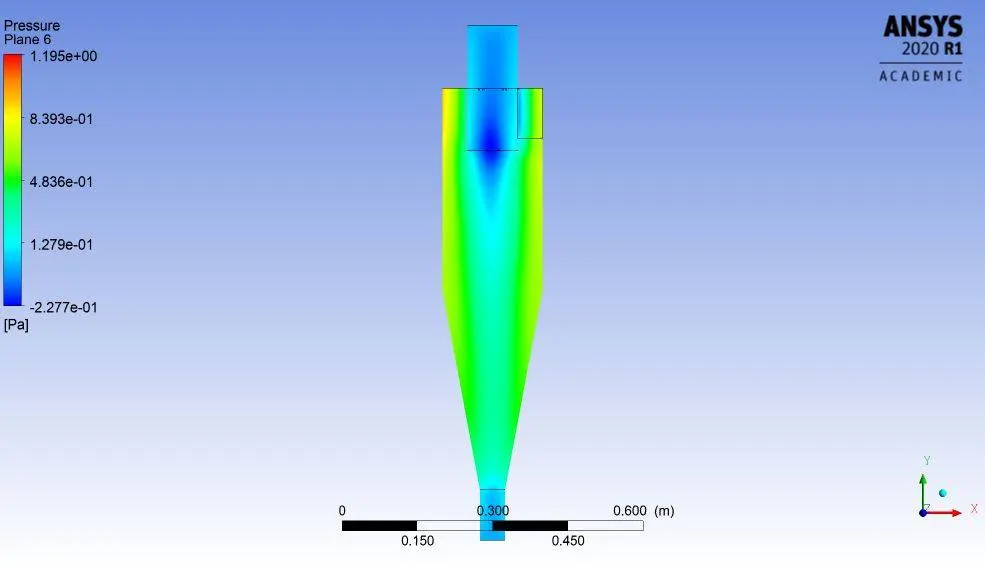
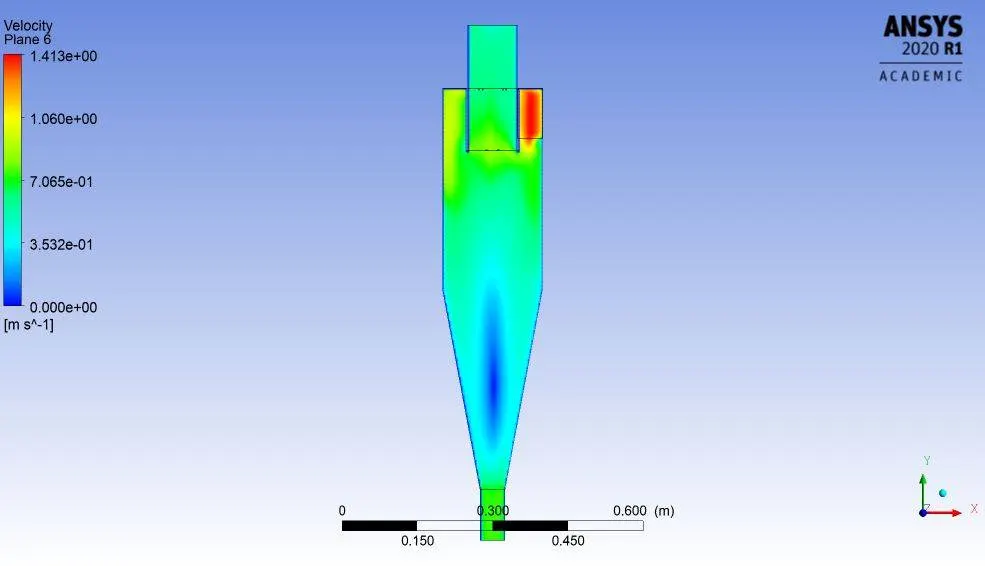
pressure and velocity contour @ yzplane
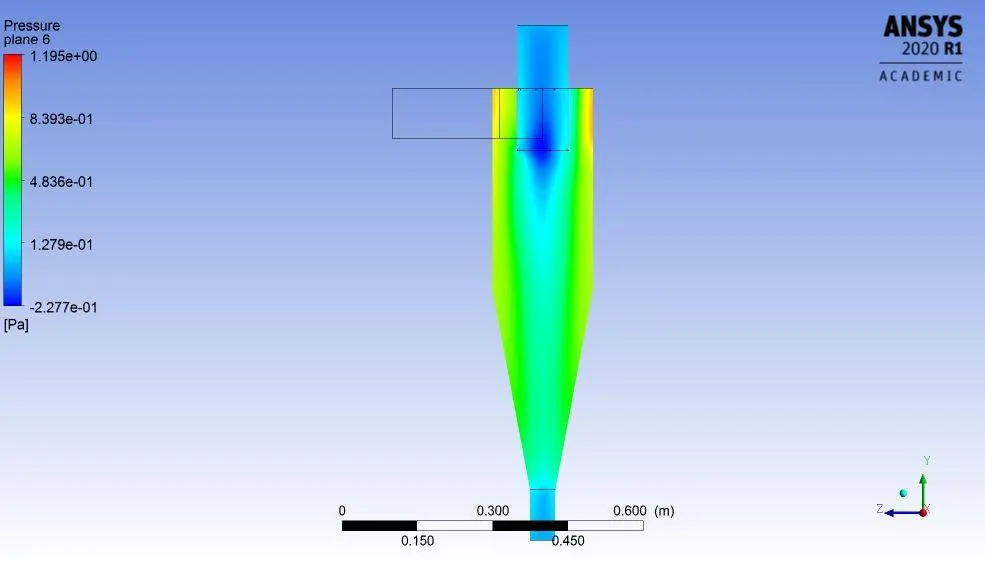
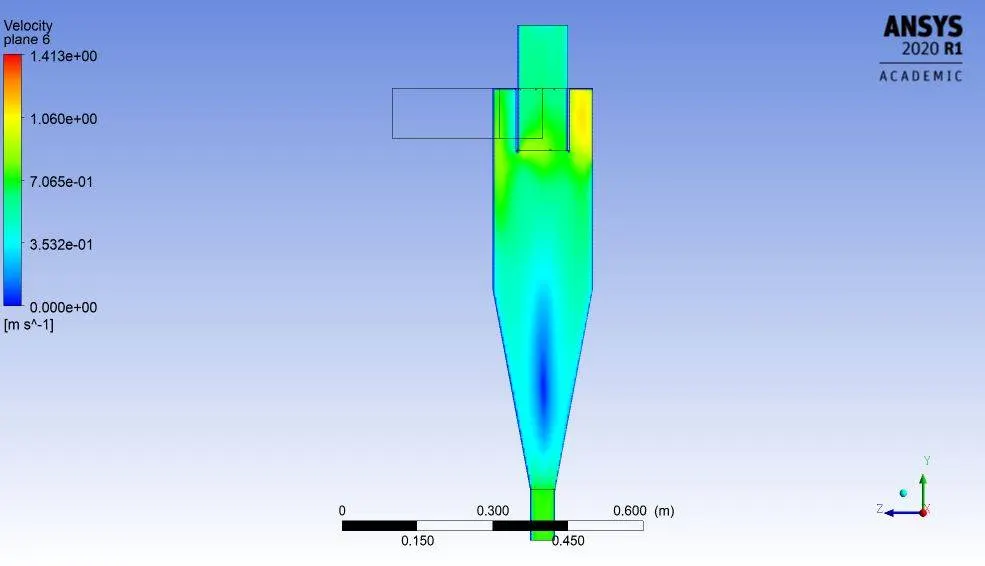
pressure and velocity variation along cyclone geometry
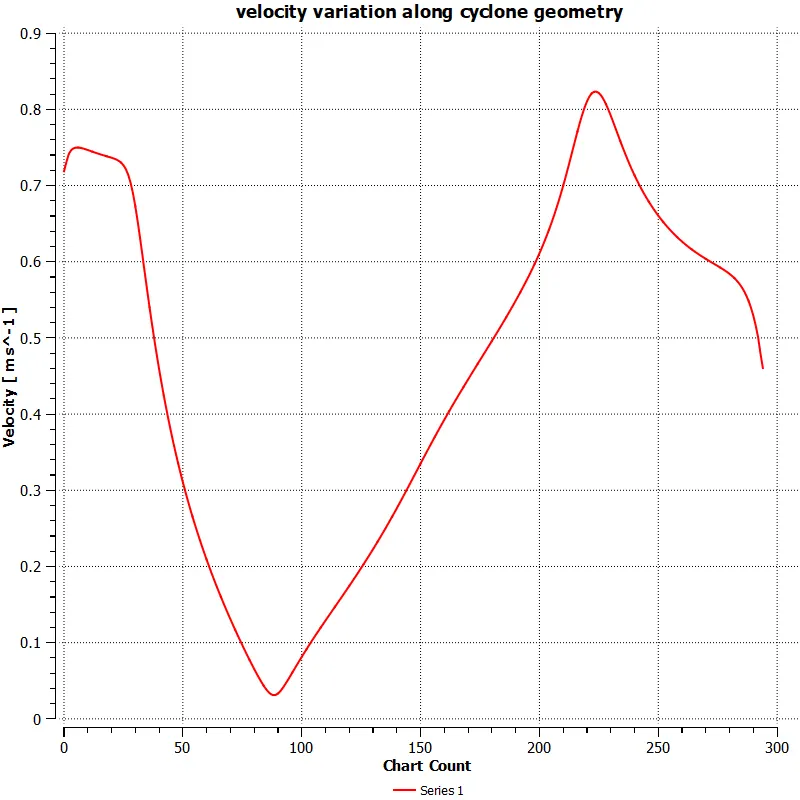
2). 3 m/s particle velocity with 5 Micron Particle diameter
Residual plot
pressure and velocity contour plot at different plane
pressure and velocity contour plot @xy plane
pressure and velocity contour @ yzplane
pressure and velocity variation along cyclone geometry
3). 5 m/s particle velocity with 5 Micron Particle diameter
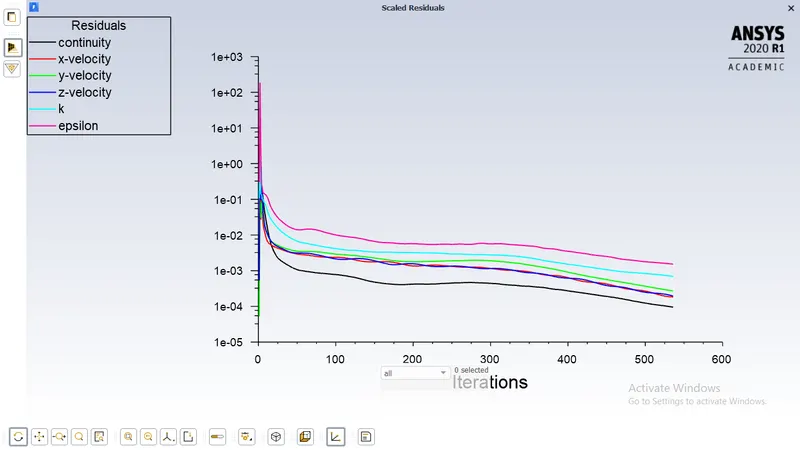
Residual plot
pressure and velocity contour plot at different plane
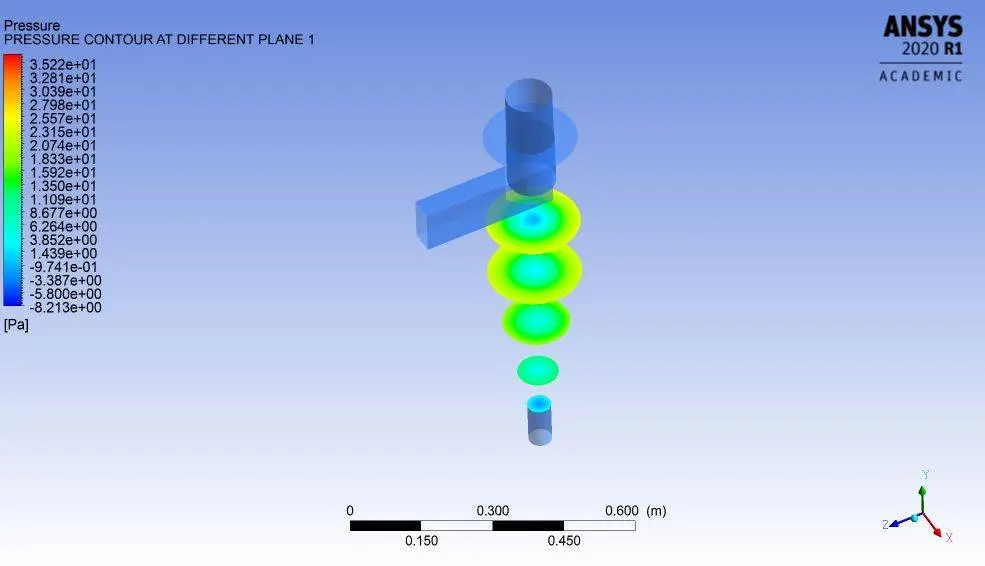
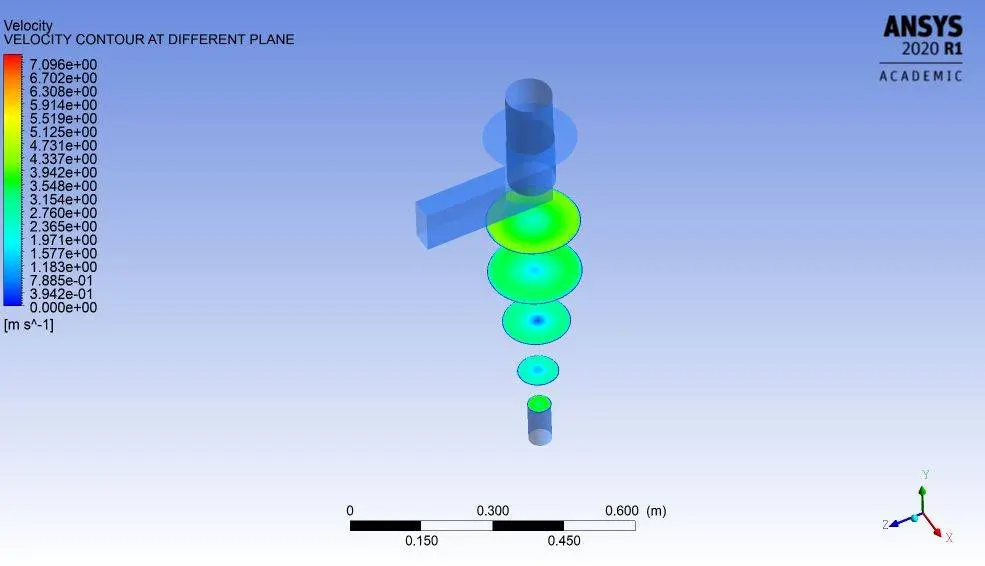
pressure and velocity contour plot @xy plane
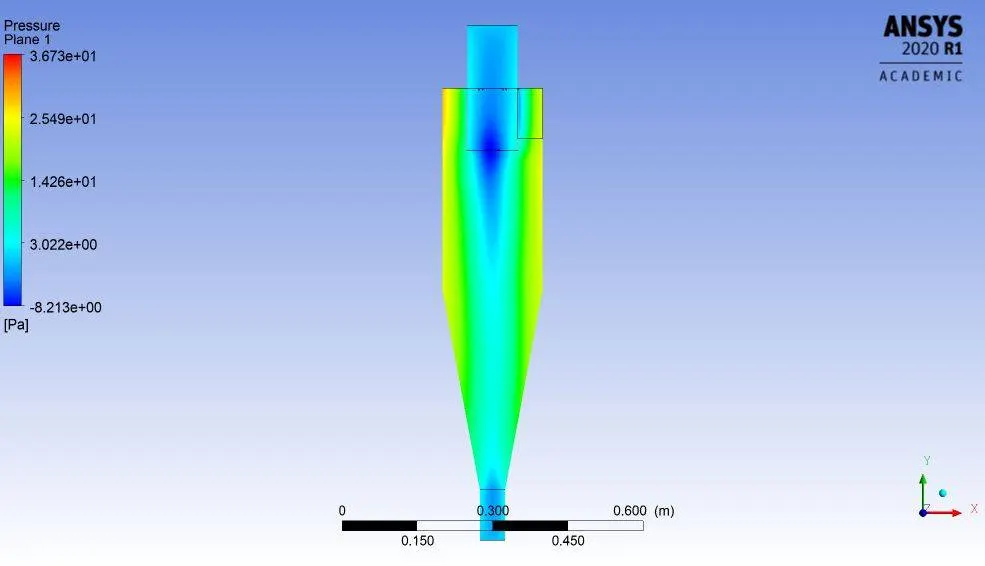
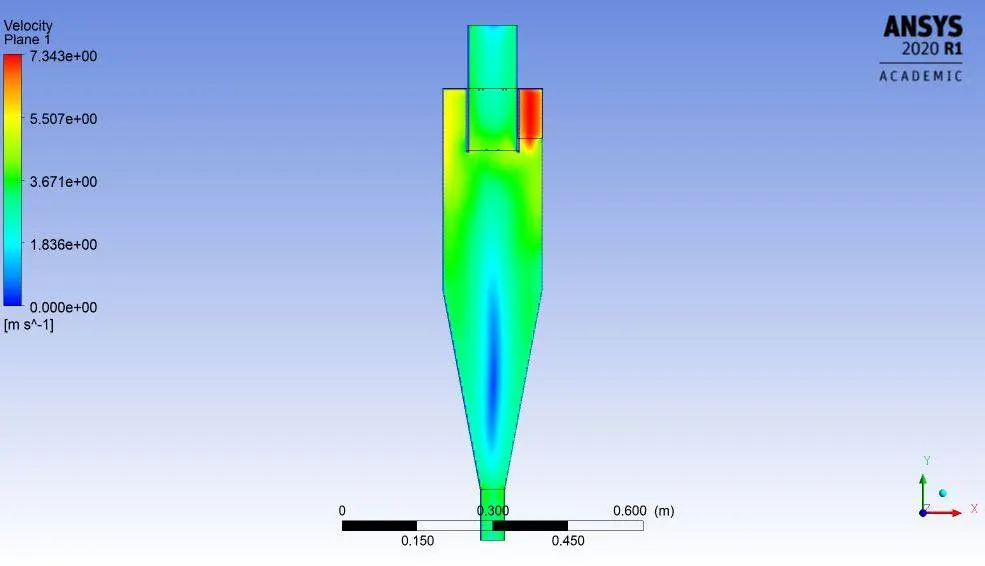
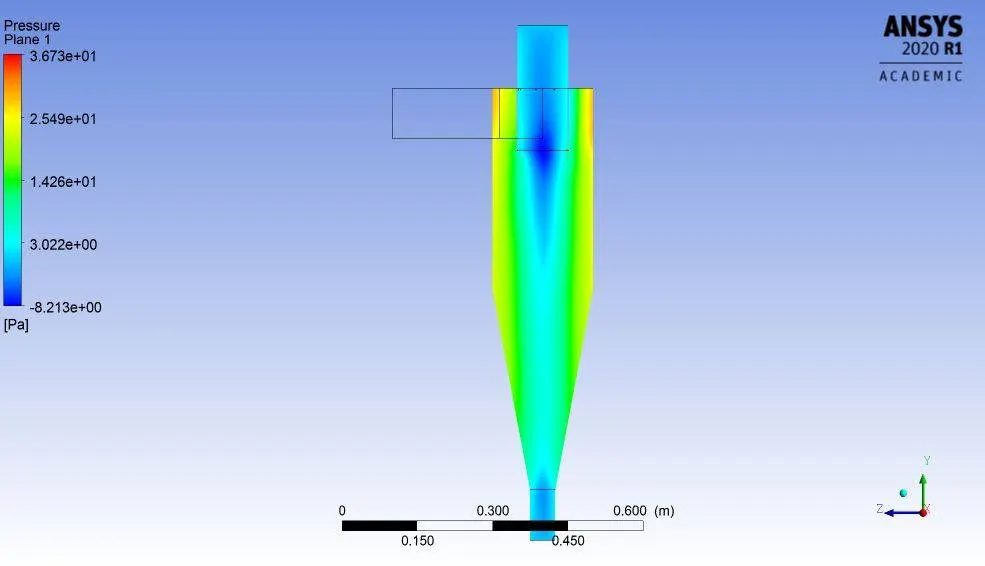
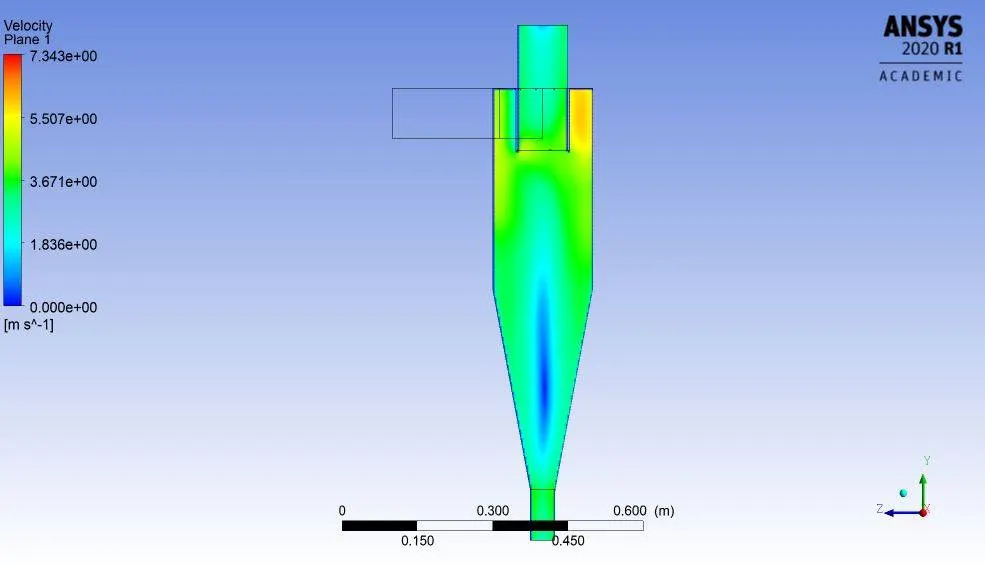
pressure and velocity contour @ yzplane
pressure and velocity variation along cyclone geometry
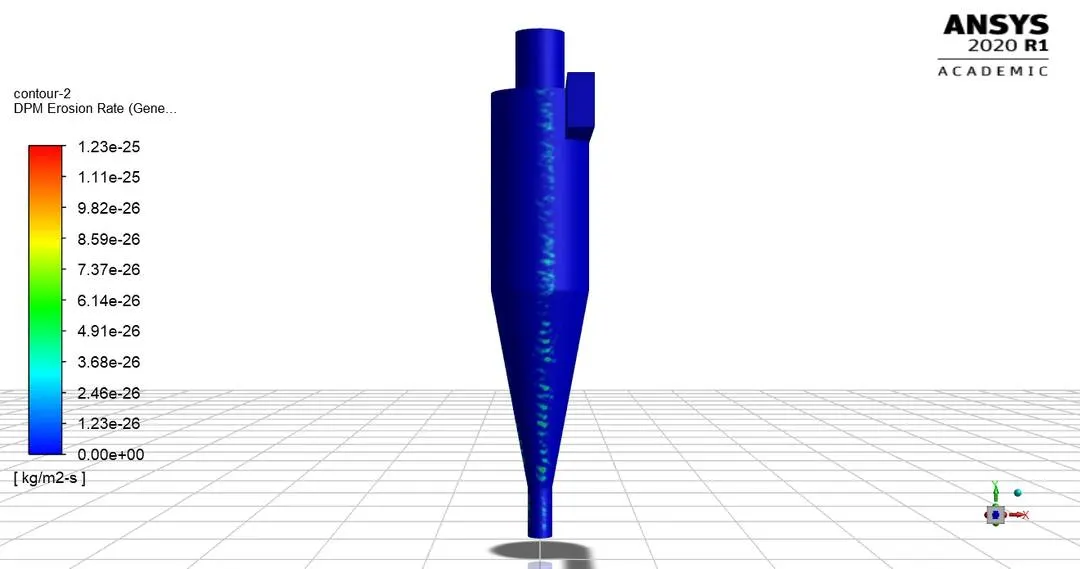
1 m/s & 1 particle Micron erosion model
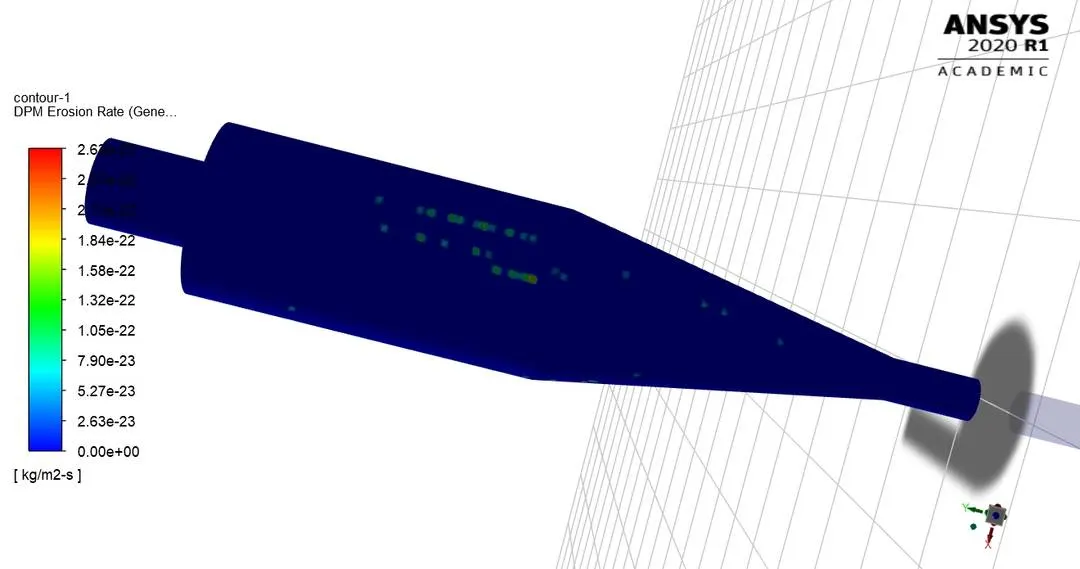
5m/s & 5 Micron particle erosion model
| TRACKED PARTICLE : 435 & INLET VELOCITY : 3 M/S | ||||||
| TRAPPED | ESCAPED | INCOMPLETE | EFFECIENCY | |||
| PARTICLE SIZE | ||||||
| 1 MICRON | 216 | 218 | 1 | 49.65 | ||
| 2.5 MICRON | 235 | 110 | 0 | 54.021 | ||
| 5 MICRON | 317 | 118 | 0 | 72.87 | ||
| TRACKED PARTICLE : 435 & PARTICLE DIA : 5 MICRON | |||||||
| TRAPPED | ESCAPED | INCOMPLETE | EFFECIENCY | PRESSURE DROP (NET) | |||
| PARTICLE VELOCITY | (Pascal) | ||||||
| 1 M/S | 130 | 276 | 29 | 29.88 | 1.19-(-0.25) = 1.45 | ||
| 3 M/S | 317 | 118 | 0 | 54.021 | 12.19-(-2.0) = 14.19 | ||
| 5 M/S | 390 | 45 | 0 | 89.65 | 36.70-(-4.5) = 41.2 | ||
CONCLUSION
- It can be shown from above plot & contour with increasing descrete particle diameter no. of trapped particle is increases and hence efficiencyBecause centrifugal force ( MV^2/R) increases with increases mass hence centrifugal force dominates particle drag force in upward direction .
- All plot of simulation reaches to converge criteria as its reaches up to tolerance limit and no more fluctuation.
- With increases in particle velocity no. of trapped particle increases also Net pressure drop increases as shown in plot which favours in increases efficiency
- Perfomance and efficiency of cyclone separator inlet width & height , cone diameter , cyclone cone height , inlet pipe geometry.
- In order to reduce pressure drop friction factor should have optimum value and hence value of surface roughness
- Finer mesh with cutcell method gives accurate result since no. of tracking particle is increases.
- By enabling erosion modeling we can get idea about erosion rate and hence material selection can be done better.